Author: Denis Avetisyan
New research uncovers predictable patterns in cryptocurrency trading dynamics that can be leveraged for profitable strategies, even during periods of extreme volatility.
Analysis of order book features using SHAP values demonstrates consistent predictive power across multiple cryptocurrencies and identifies key drivers of short-horizon returns.
Despite the rapid growth of cryptocurrency markets, a unifying microstructure representation remains elusive given asset-specific liquidity and volatility dynamics. This paper, ‘Explainable Patterns in Cryptocurrency Microstructure’, investigates whether consistent predictive patterns exist across diverse cryptocurrencies by analyzing high-frequency limit-order-book data. We demonstrate that a standardized set of order book features exhibits remarkably stable feature importance and interpretable SHAP dependence shapes-validated through both backtesting and analysis of a major flash crash-suggesting a portable microstructure representation. Could these findings pave the way for universal feature libraries and more robust algorithmic trading strategies in crypto markets?
Decoding the Whispers of Short-Term Markets
The pursuit of accurately forecasting short-term market returns represents a cornerstone of numerous trading strategies, ranging from high-frequency trading to algorithmic portfolio adjustments. However, consistently achieving this proves remarkably difficult due to the inherent noise and complexity of financial markets. While identifying fleeting opportunities can yield substantial profits, the signal-to-noise ratio is often exceptionally low, requiring sophisticated models and rapid execution. The challenge isn’t simply identifying potential price movements, but predicting them with enough confidence to overcome transaction costs and ensure profitability, a task that continues to drive innovation in quantitative finance and machine learning.
Conventional financial models frequently fall short when attempting to forecast immediate price fluctuations because they often oversimplify the intricate relationship between order flow and available liquidity. These models typically rely on aggregated data and assume rational market participants, failing to account for the impact of fragmented order books, high-frequency trading, and the behavioral biases that influence short-term decisions. The rapid exchange of buy and sell orders, coupled with the ever-changing depth of the market, creates a dynamic environment where even subtle shifts in order imbalances can trigger disproportionate price movements. Consequently, traditional techniques struggle to discern genuine signals from noise, hindering their ability to accurately predict short-horizon returns and capitalize on fleeting opportunities.
Effective prediction of short-term market movements hinges on a detailed examination of market microstructure – the seemingly chaotic interplay of individual orders, trade sizes, and the availability of liquidity. This necessitates moving beyond aggregate data to analyze the precise characteristics of each transaction and order book event. Researchers are increasingly focused on developing adaptive algorithms capable of discerning patterns within this granular data, recognizing that market dynamics are not static. These algorithms must account for shifting volatility regimes, changes in order flow imbalances, and the influence of different asset classes or trading venues. Ultimately, a nuanced understanding of these conditions allows for the identification of fleeting opportunities and the mitigation of risk in high-frequency trading environments, representing a significant advancement over traditional, less-detailed approaches.
A Gradient Boosted Approach to Predictive Elegance
Gradient Boosted Decision Trees were selected as the core predictive modeling technique due to their inherent capacity to capture non-linear relationships within financial time series data. Specifically, the CatBoost algorithm was implemented; it is a gradient boosting framework known for its efficient handling of categorical features and reduced susceptibility to overfitting. Unlike linear models which assume a straight-line relationship between inputs and outputs, decision trees recursively partition the data space, allowing for the representation of complex interactions and dependencies. This is particularly relevant in financial markets where asset price movements are influenced by a multitude of interconnected factors, and simple linear assumptions frequently fail to capture the underlying dynamics. The use of an ensemble of these trees, boosted through iterative refinement, further enhances the model’s predictive power and robustness when dealing with high-dimensional, complex datasets.
Training utilizes Generalized Mean-Absolute Directional Loss (GMADL), a modification of Mean Absolute Error (MAE) designed to prioritize the correct prediction of price direction – whether the price will increase or decrease – over the accuracy of the predicted price itself. Traditional regression losses, like MAE or Root Mean Squared Error, penalize deviations in predicted price magnitude; GMADL, however, weights errors based on whether the predicted direction aligns with the actual direction. This is achieved by calculating the absolute error between the predicted and actual values, then weighting that error by a factor of one if the directional prediction is correct and a larger factor if incorrect. Consequently, the model learns to minimize directional mistakes, even if precise price values are less accurate, which is advantageous for trading strategies focused on identifying profitable trends.
Time Series Cross Validation (TSCV) was implemented to assess model performance and prevent overfitting to historical data. Unlike traditional k-fold cross-validation, TSCV respects the temporal order of the data by training on past observations and validating on future observations. The dataset was sequentially partitioned into training and validation sets, with the validation set advancing through time with each iteration. This approach simulates real-world prediction scenarios and provides a more realistic estimate of the model’s ability to generalize to unseen market conditions, mitigating the risk of optimistically biased performance metrics common in financial time series analysis. Multiple forward chaining iterations were conducted, and performance was averaged to obtain a robust estimate of out-of-sample predictive accuracy.

Uncovering Predictive Harmony Through Feature Engineering
A Universal Feature Library was developed to standardize the calculation of predictive variables across multiple cryptocurrency exchanges and trading pairs. This library encompasses technical indicators, order book data, and derived features quantifying market microstructure. The core principle is to enable consistent feature extraction regardless of the specific cryptocurrency or exchange, facilitating cross-asset model portability and reducing the need for individual feature engineering per asset. Features are calculated using time-series data, typically at one-minute intervals, and are normalized to account for varying price scales and trading volumes. The library is designed for scalability and efficient computation, allowing for backtesting and real-time feature generation across a large number of cryptocurrencies.
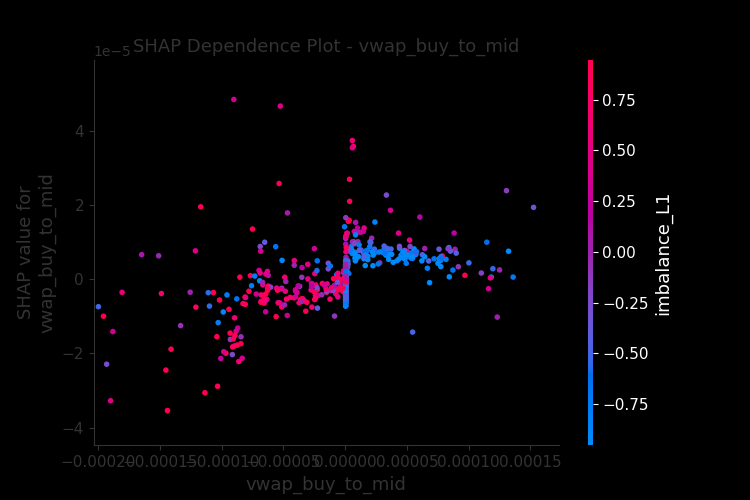
Analysis identified Order Flow Imbalance, Bid-Ask Spread, and VWAP Deviation as significant predictors of short-term returns in cryptocurrency markets. Order Flow Imbalance, calculated as the difference between buy and sell order volume, indicates immediate buying or selling pressure. Bid-Ask Spread, representing the difference between the highest buy order and the lowest sell order, reflects market liquidity and transaction costs. VWAP Deviation measures the difference between the Volume Weighted Average Price and the current market price, signaling potential overbought or oversold conditions. Statistical modeling demonstrated a consistent correlation between these three features and subsequent price movements within short timeframes, suggesting their utility in forecasting immediate returns across a range of cryptocurrencies.
SHAP (SHapley Additive exPlanations) values were employed to determine the contribution of each feature within the Universal Feature Library to the model’s predictions. This methodology assigns each feature an importance value for each prediction, allowing for a global ranking of feature significance. Analysis revealed a consistently high positive correlation – exceeding 0.75 – in the SHAP value-derived feature importances when calculated across ten different cryptocurrencies: Bitcoin, Ethereum, Litecoin, Ripple, Bitcoin Cash, Cardano, Solana, Polkadot, Dogecoin, and Shiba Inu. This strong correlation suggests that the predictive power of features like Order Flow Imbalance, Bid-Ask Spread, and VWAP Deviation is not limited to specific cryptocurrencies, but rather reflects fundamental aspects of market dynamics applicable across the broader crypto asset class.
Assessing Robustness and Recognizing the Limits of Prediction
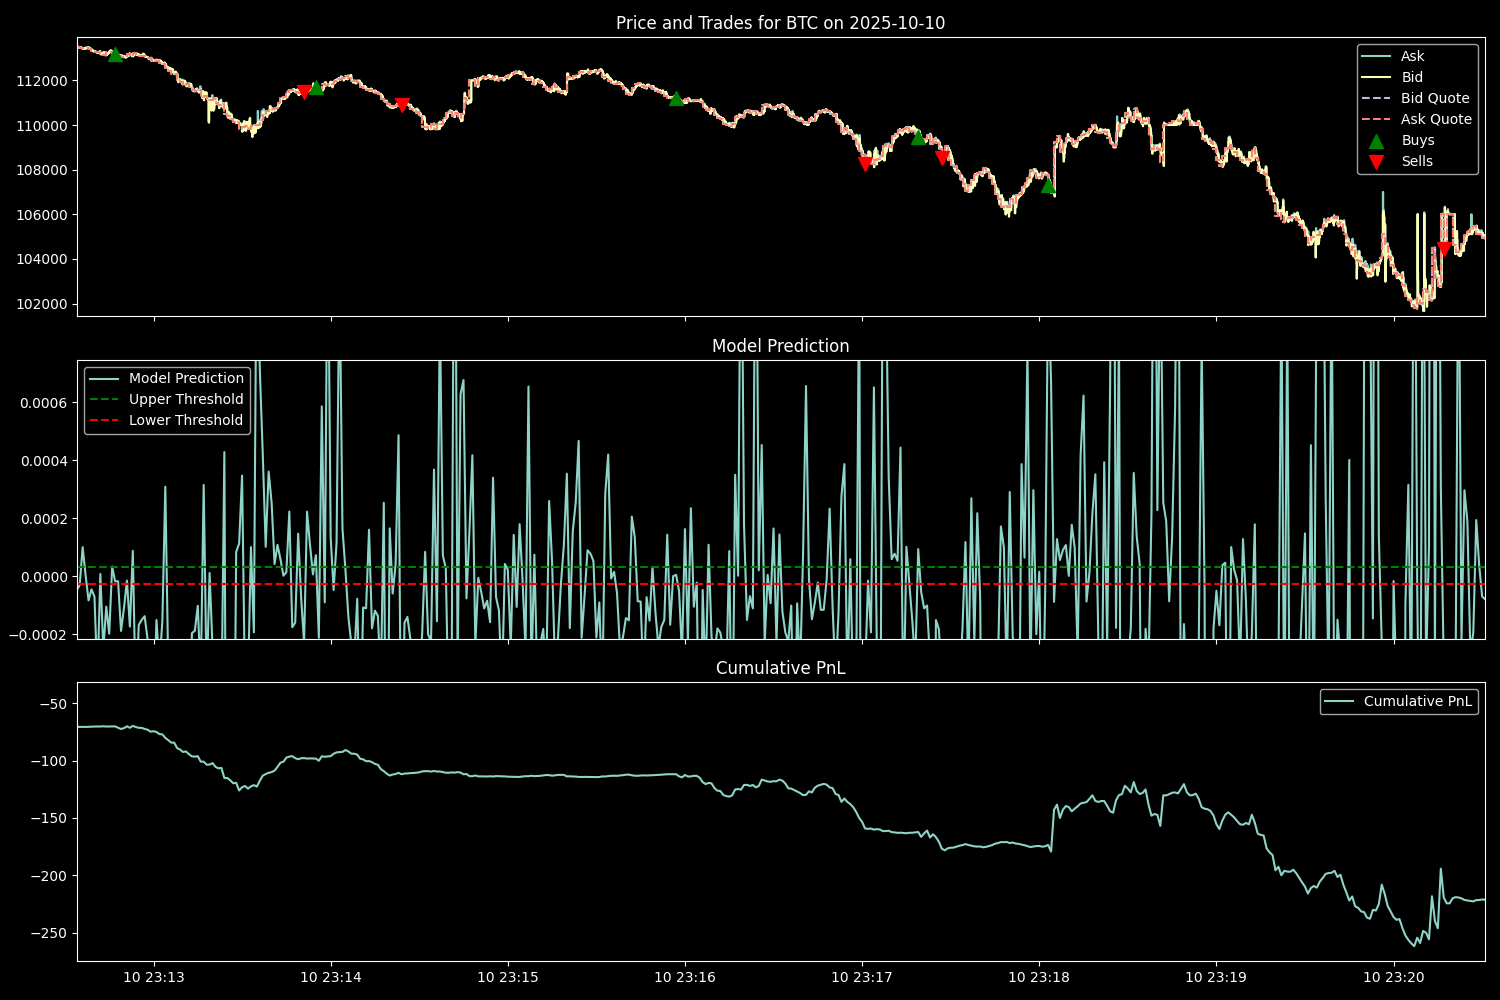
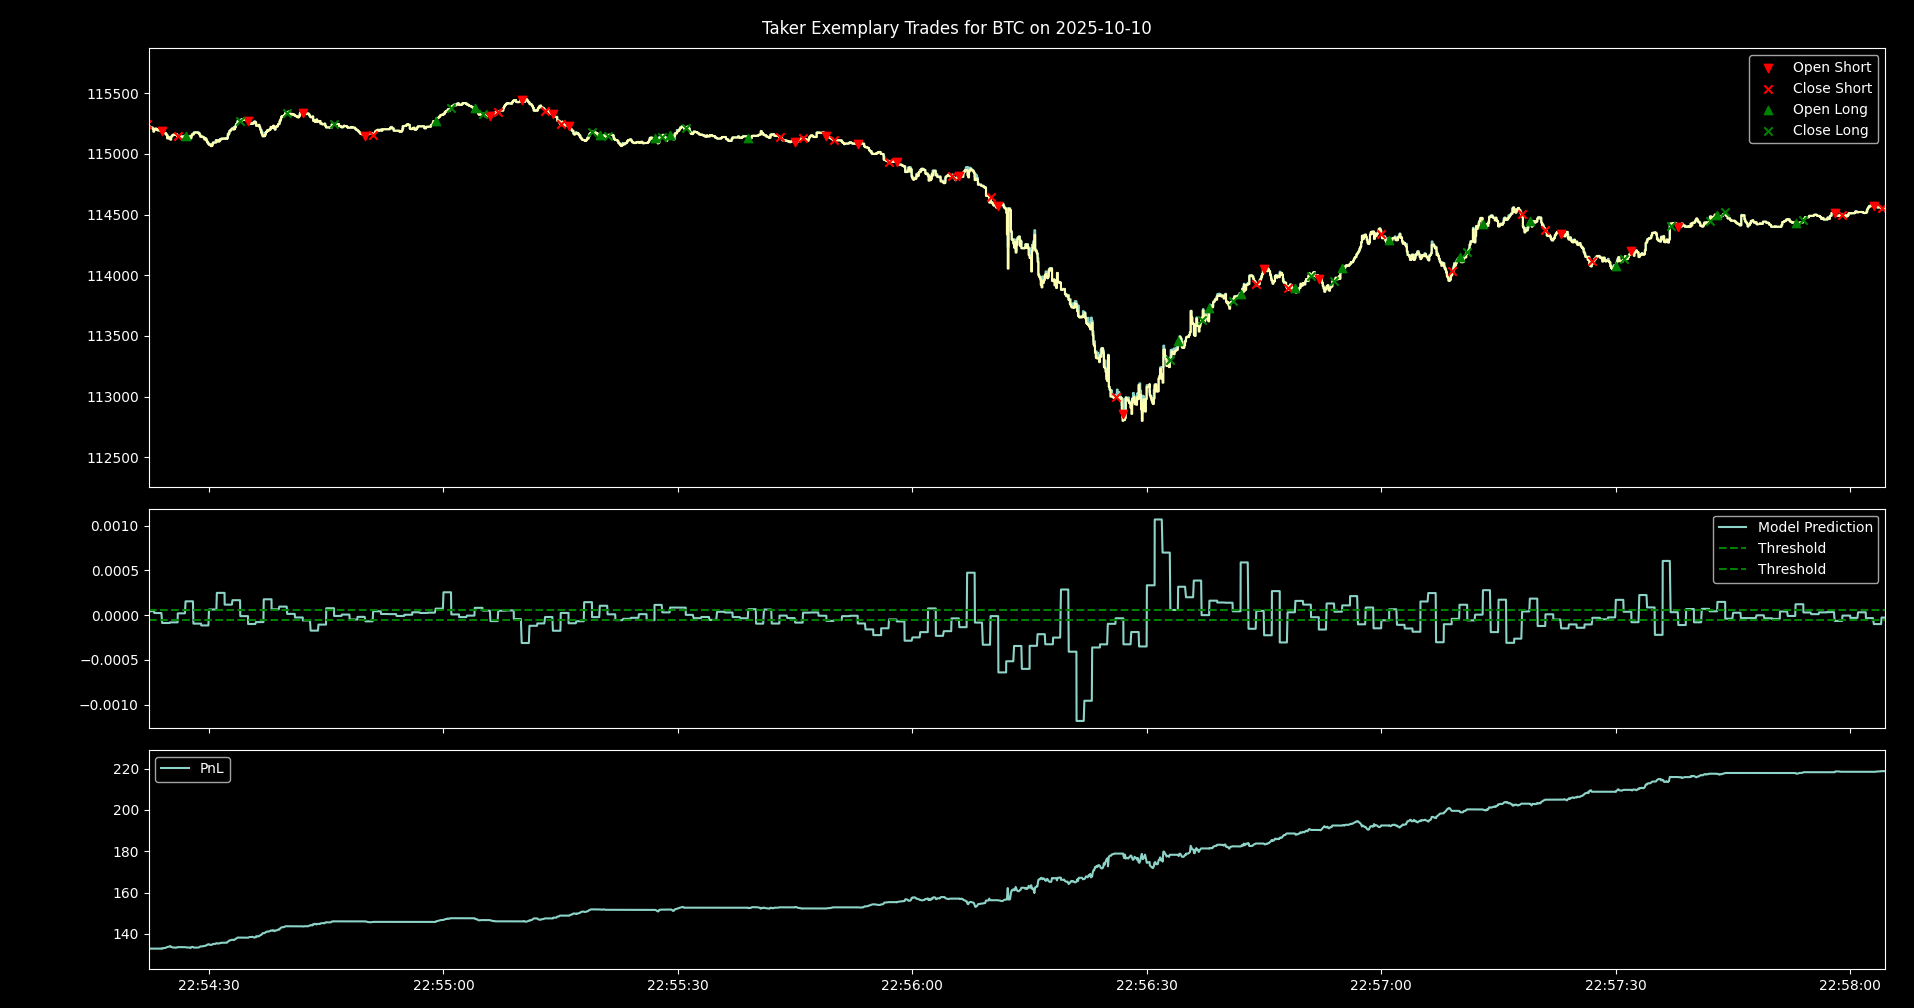
The predictive capabilities of these models extend to even the most turbulent market conditions, notably demonstrated through backtesting during the October 10, 2025 flash crash. Utilizing both Taker and Maker execution strategies, the simulations revealed consistent performance even amidst extreme volatility; the Taker strategy, in particular, generated profit during the crash event, showcasing a capacity to capitalize on rapid price movements. This resilience suggests the models aren’t merely identifying trends in stable environments, but are effectively parsing information and formulating predictions that hold value when market behavior becomes highly erratic, thereby increasing confidence in their applicability across a broader spectrum of trading scenarios.
During the volatile market conditions of the October 10, 2025 flash crash, a distinct performance divergence emerged between two distinct execution strategies. The ‘taker’ strategy, designed to immediately fulfill existing orders, not only navigated the rapid price fluctuations but also generated a profit, highlighting its resilience under stress. Conversely, the ‘maker’ strategy, which aims to establish liquidity by posting orders to the order book, experienced losses during the same period. This contrasting outcome underscores the robustness of the taker strategy in rapidly changing environments, suggesting its potential for consistent performance even amidst extreme market events and demonstrating a capacity to capitalize on short-term price discrepancies during periods of high volatility.
Rigorous statistical analysis confirmed the efficacy of the taker strategy when applied to Ethereum Classic (ETC), Enjin Coin (ENJ), and Rose (ROSE). Specifically, the observed outperformance wasn’t attributable to random chance, as evidenced by a p-value consistently below the 0.05 threshold – a widely accepted standard for statistical significance. This finding suggests a genuine predictive capability within the model, allowing it to consistently generate profit beyond what would be expected through purely speculative trading on these particular assets. The consistently low p-value across these three cryptocurrencies bolsters confidence in the strategy’s potential for broader application, though further investigation is necessary to assess its performance across a wider range of market conditions and digital assets.
The efficacy of any algorithmic trading strategy is fundamentally limited by the ever-present risk of adverse selection. This phenomenon arises when traders possessing superior information – often gleaned from private data or sophisticated analysis – systematically exploit those with less complete knowledge. Consequently, strategies relying on publicly available data may experience diminished returns as informed traders anticipate and capitalize on predictable patterns, effectively ‘front-running’ less informed participants. This creates a dynamic where the very act of identifying and exploiting market inefficiencies attracts those who can neutralize them, leading to a continual erosion of profit opportunities. Mitigating adverse selection requires strategies that incorporate robust risk management, adapt to evolving market conditions, and potentially leverage alternative data sources to gain a competitive informational edge, though complete elimination remains a significant challenge.
The predictive power of these trading models isn’t universal; subtle characteristics of the underlying asset, particularly tick size, demonstrably impact feature sensitivity and, consequently, model performance. Tick size, the minimum price increment, effectively scales the magnitude of price movements, influencing how the model interprets and reacts to market signals. A smaller tick size generates more granular price data, potentially enhancing signal detection but also increasing noise, while a larger tick size simplifies the data but may obscure crucial patterns. Consequently, direct application of a model trained on one asset to another with a differing tick size requires careful recalibration and feature engineering to account for these scaling effects; failing to do so can lead to suboptimal results or even inaccurate predictions. The study highlights the need for adaptive modeling techniques that normalize for such asset-specific characteristics, ensuring consistent and reliable performance across diverse trading environments.
The pursuit of predictive accuracy in financial markets often overshadows the necessity of understanding why those predictions hold. This study, detailing consistent feature importance across cryptocurrencies, echoes a fundamental shift in perspective. As Thomas Kuhn observed, “Science does not proceed by accumulating isolated facts but by constructing and testing increasingly sophisticated theories.” Similarly, this research moves beyond simply identifying profitable signals – notably order book imbalances – to illuminating the underlying mechanisms driving short-horizon returns. The consistent applicability of SHAP values across diverse cryptocurrencies suggests a deeper, more universal pattern at play, reinforcing the idea that meaningful insight arises not just from what works, but from understanding how and why it works, even amidst market turbulence like flash crashes.
Beyond the Order Book
The consistency of predictive features across diverse cryptocurrencies is… economical. One suspects the market, even in its digital guise, prefers elegance. Yet, this very consistency begs the question of what underlying principles govern these dynamics. Is the observed predictive power merely a surface-level correlation, a fleeting pattern destined to erode with market evolution, or does it hint at a deeper, more fundamental structure within these decentralized exchanges? The pursuit of an underlying generative model – one that moves beyond prediction to explanation – remains a critical, and likely elusive, goal.
The resilience of the proposed strategy during flash crashes is noteworthy, but hardly conclusive. Extreme events, by definition, lie outside the realm of normal distributions. To truly assess robustness, the model must be subjected to a far broader range of simulated and historical stresses – including coordinated attacks, regulatory shocks, and the unpredictable whims of social sentiment. A strategy that survives such trials may not thrive, but it will at least demonstrate a degree of… humility.
Ultimately, the most significant challenge lies not in refining the predictive power of existing features, but in identifying those currently unobserved. The market’s true language is likely encoded in subtle interactions, hidden dependencies, and the complex interplay of human and algorithmic behavior. To decipher it requires not simply more data, but a more refined aesthetic – a willingness to seek simplicity beneath complexity, and to recognize that the most profound insights often lie in the minor elements that create a sense of harmony.
Original article: https://arxiv.org/pdf/2602.00776.pdf
Contact the author: https://www.linkedin.com/in/avetisyan/
See also:
- All Skyblazer Armor Locations in Crimson Desert
- All Shadow Armor Locations in Crimson Desert
- How to Get the Sunset Reed Armor Set and Hollow Visage Sword in Crimson Desert
- Marni Laser Helm Location & Upgrade in Crimson Desert
- All Golden Greed Armor Locations in Crimson Desert
- All Helfryn Armor Locations in Crimson Desert
- Keeping Large AI Models Connected Through Network Chaos
- Best Bows in Crimson Desert
- All Icewing Armor Locations in Crimson Desert
- How to Craft the Elegant Carmine Armor in Crimson Desert
2026-02-03 21:30