Get ready to party like it’s 2021 because HBAR is back in the game, baby! 🎉 According to technical indicators and chart formations across multiple timeframes, it looks like Hedera might be experiencing a mid-term shift in sentiment. At the time of writing, HBAR is trading above $0.19, which is a major win after months of subdued performance. 📈
ZAYK Charts Signals Breakout From Descending Wedge
The daily HBAR/USDT chart published by ZAYK Charts (@ZAYKCharts) shows a clear breakout from a descending wedge pattern, which had formed through months of narrowing lower highs and lower lows. 📉 The breakout above the upper trendline indicates that the asset has exited the compression zone with some serious momentum. This technical pattern is often viewed as a bullish reversal, especially when accompanied by volume and market structure shifts. 💸
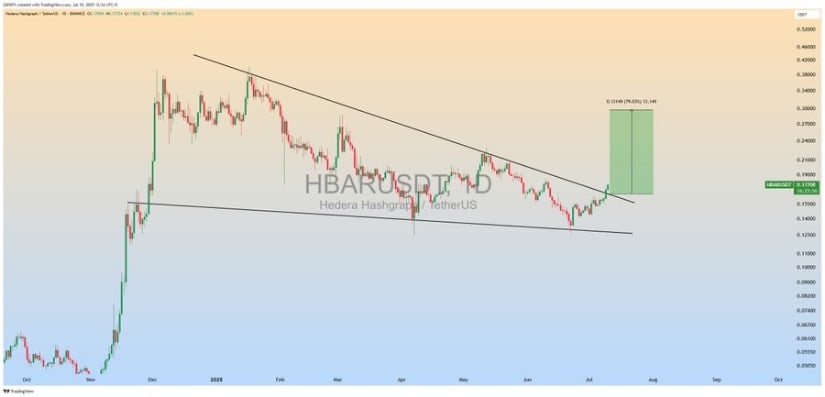
The analyst projects a measured target near $0.31, representing an estimated 72% upside from the breakout level at $0.18. This target corresponds to the height of the wedge pattern extrapolated from the breakout point. 🎯
Currently, HBAR has cleared the wedge resistance and is holding above prior compression zones. Minor resistance levels lie at $0.22 and $0.26, but if the breakout structure remains intact, price action could continue toward the projected zone. Sustained volume and broader Layer-1 market interest are likely to support this momentum. 🚀
Buyers Reclaim Control as Volume Surges
According to BraveNewCoin’s 24-hour data, HBAR gained 12.42%, pushing from $0.17 to $0.193. The price broke above the psychological and structural resistance at $0.18, signaling a clean shift in control from sellers to buyers. Volume exceeded $387.93 million, with the majority of activity occurring as the token moved past the $0.18 mark—an area previously identified as a liquidity zone. 💸
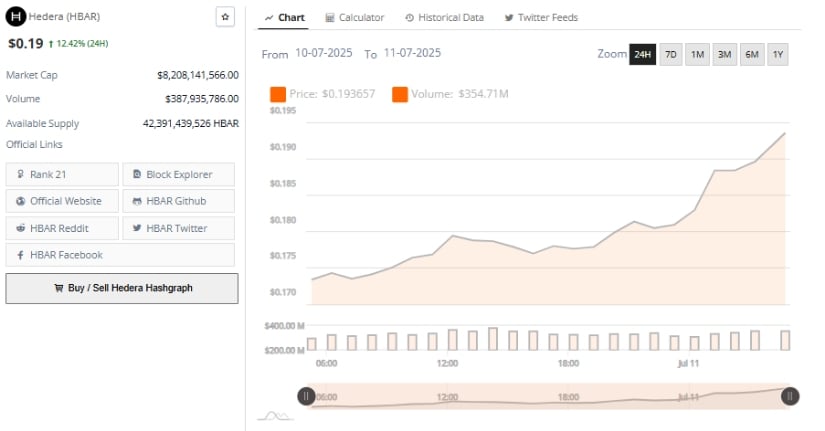
Source: BraveNewCoin
The market capitalization has crossed $8.2 billion, placing Hedera among the top 25 crypto assets. This rise in both price and trading volume reinforces that the rally is underpinned by strong participation rather than isolated spikes. 📈
The circulating supply remains above 42 billion tokens, which provides enough liquidity for institutional and large-scale participants. Should the token hold above the $0.185–$0.190 level, the next resistance is projected between $0.20 and $0.22. 📈
TradingView Indicators Validate Trend Reversal
Technical insights from TradingView show supportive momentum across lower timeframes. The 1-hour chart shared by Grovot Crypto Alert Bot identifies a liquidity zone breakout around $0.17987. After multiple rejections at this level, the price surged past it with a strong sequence of green candles, reaching a local high of $0.19017. This move confirms that short-term resistance has been flipped into support. 📈
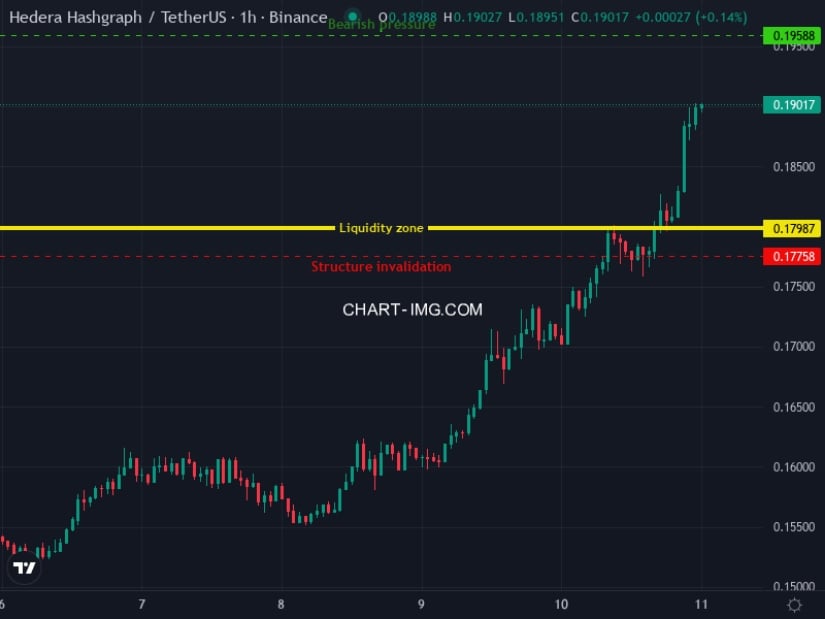
The chart marks $0.19588 as the next immediate pressure zone, while $0.20 remains the broader psychological barrier. Continued strength above $0.17987 would validate the breakout structure. 💪
Price movement, supported by increasing volume and minimal retracements, indicates that bulls remain in control. For short-term confirmation, the market will watch for follow-through above $0.195 and consolidation above support zones before any further upward extension. 📈
Read More
- All Skyblazer Armor Locations in Crimson Desert
- One Piece Chapter 1180 Release Date And Where To Read
- How to Get the Sunset Reed Armor Set and Hollow Visage Sword in Crimson Desert
- All Shadow Armor Locations in Crimson Desert
- All Golden Greed Armor Locations in Crimson Desert
- How to Beat Stonewalker Antiquum at the Gate of Truth in Crimson Desert
- Grime 2 Map Unlock Guide: Find Seals & Fast Travel
- Cassius Morten Armor Set Locations in Crimson Desert
- Marni Laser Helm Location & Upgrade in Crimson Desert
- Amber Alert Secrets & CDs In Crime Scene Cleaner Act 2
2025-07-11 23:55