I’ve been watching Bitcoin closely today, and over the past hour it’s been trading between $122,762 and $123,092. The overall market cap is sitting at around $2.44 trillion, with about $56.77 billion worth of Bitcoin traded in the last 24 hours. Throughout the day, we’ve seen it fluctuate between $121,235 and $124,072. It seems like things have settled down a bit after a pretty significant climb, and we’re seeing some consolidation near those recent highs.
Bitcoin Chart Outlook and Price Prediction
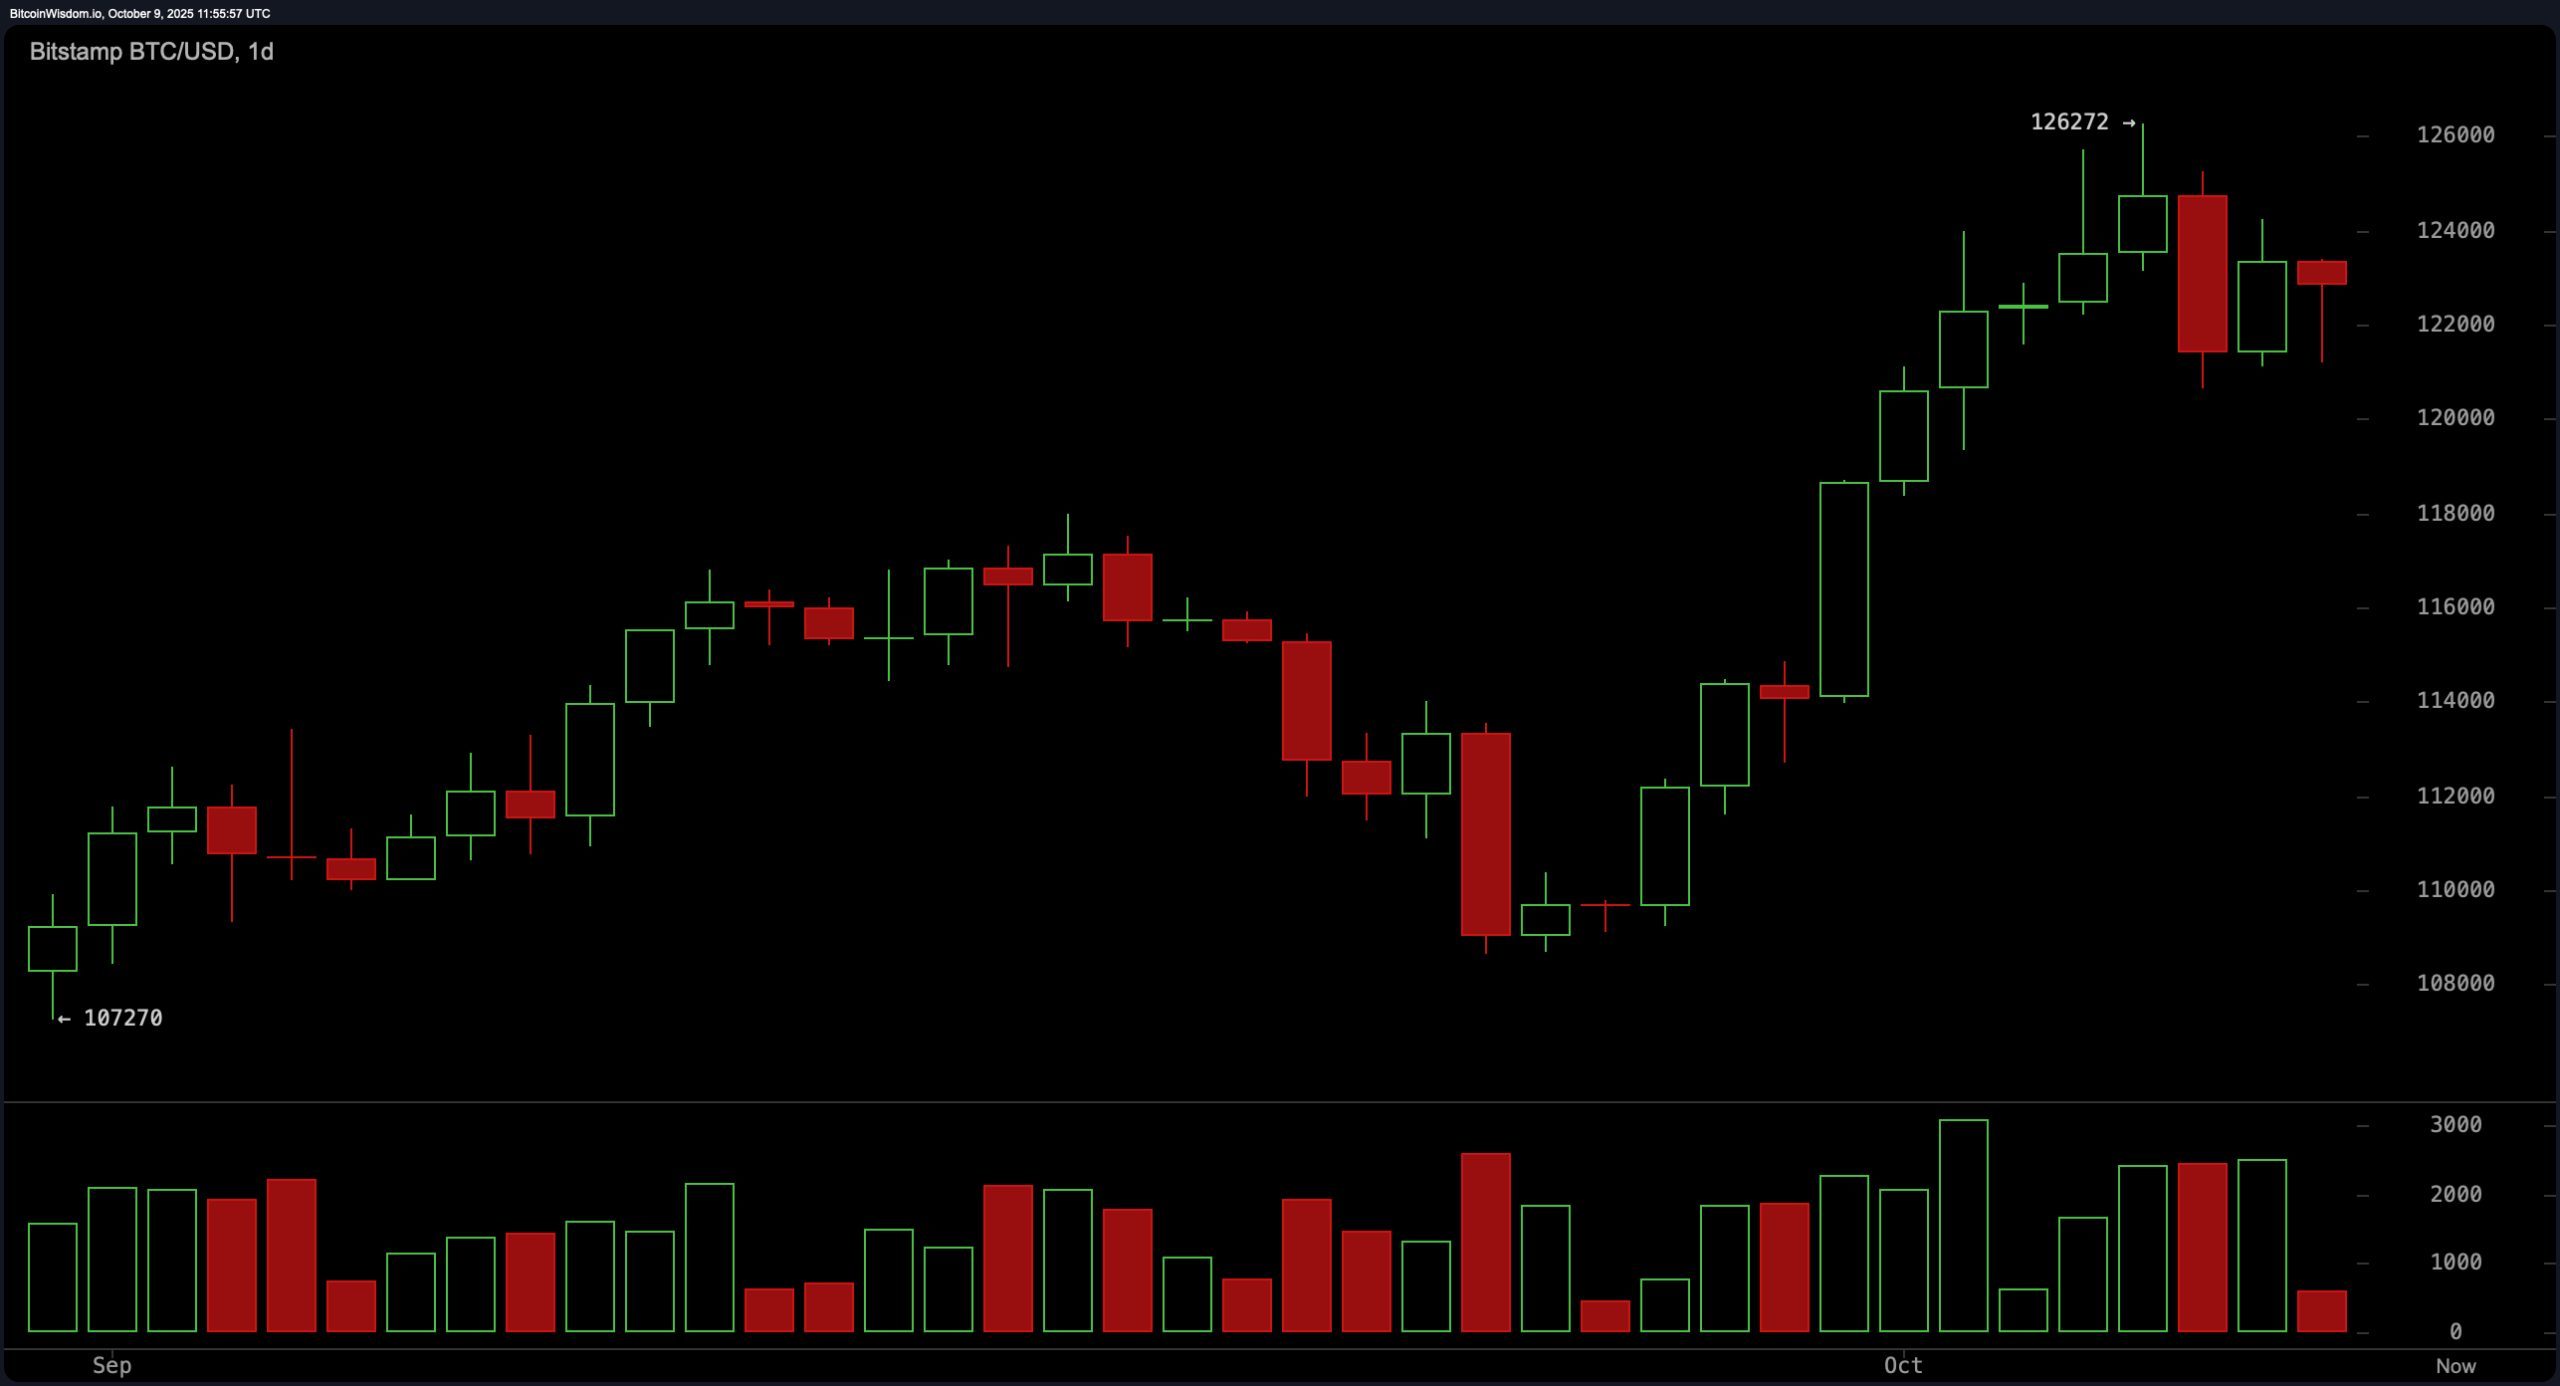
Bitcoin’s daily chart shows signs of consolidation following a powerful rally that carried prices from approximately $107,000 to $126,000 in late September and early October. The move was accompanied by declining volume on the recent pullback, suggesting weak selling pressure.
The price is currently finding strong support between $113,000 and $115,000, but struggles to break past resistance around $126,000. The recent price action shows uncertainty, with candles suggesting the current trend might pause or even reverse. If the price, currently at $122,762, can gain momentum with increased trading volume, it could signal a shift in direction.
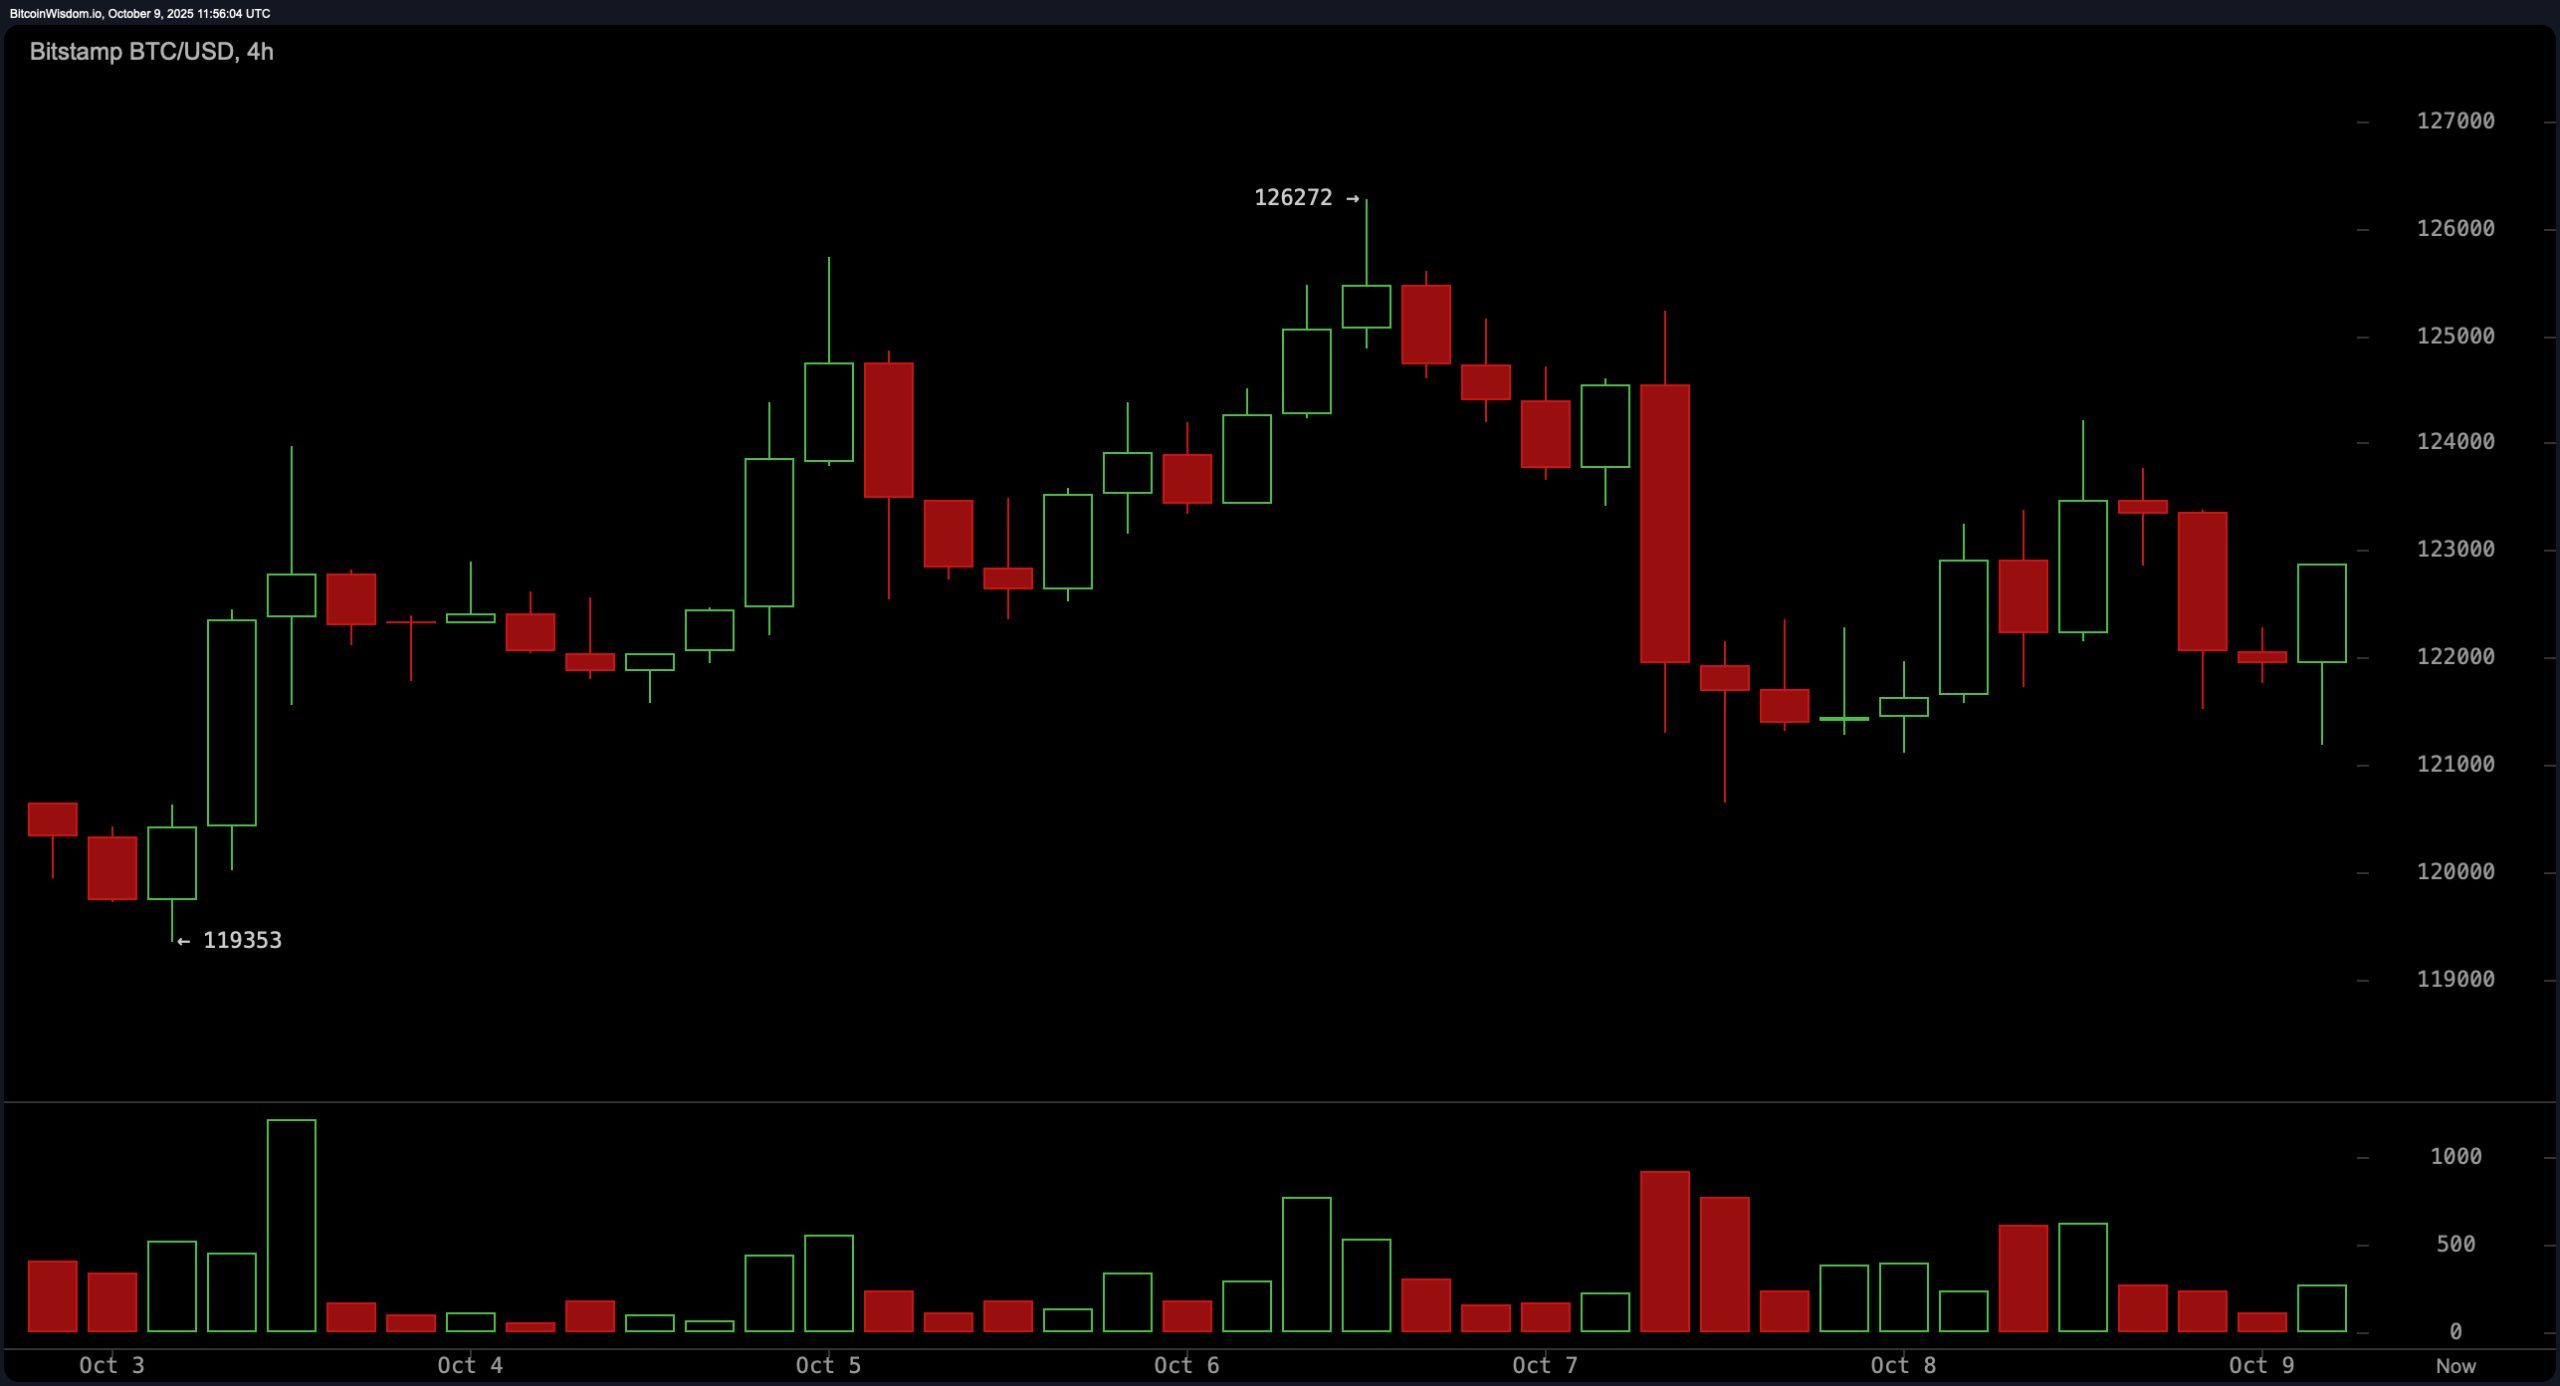
On the 4-hour chart, the trend has shifted to lower highs and lower lows after topping out near $126,000. A bearish candle with elevated volume broke through short-term support at $123,500, a critical level now acting as intraday resistance. Despite minor bullish attempts, volume on recovery candles remains subdued, suggesting a lack of conviction from market participants. Should bitcoin reestablish itself above $123,500 with a confirmed volume surge, upward targets between $125,500 and $126,000 could reemerge. Until such a move materializes, the market remains tentative and reactive to minor price fluctuations.
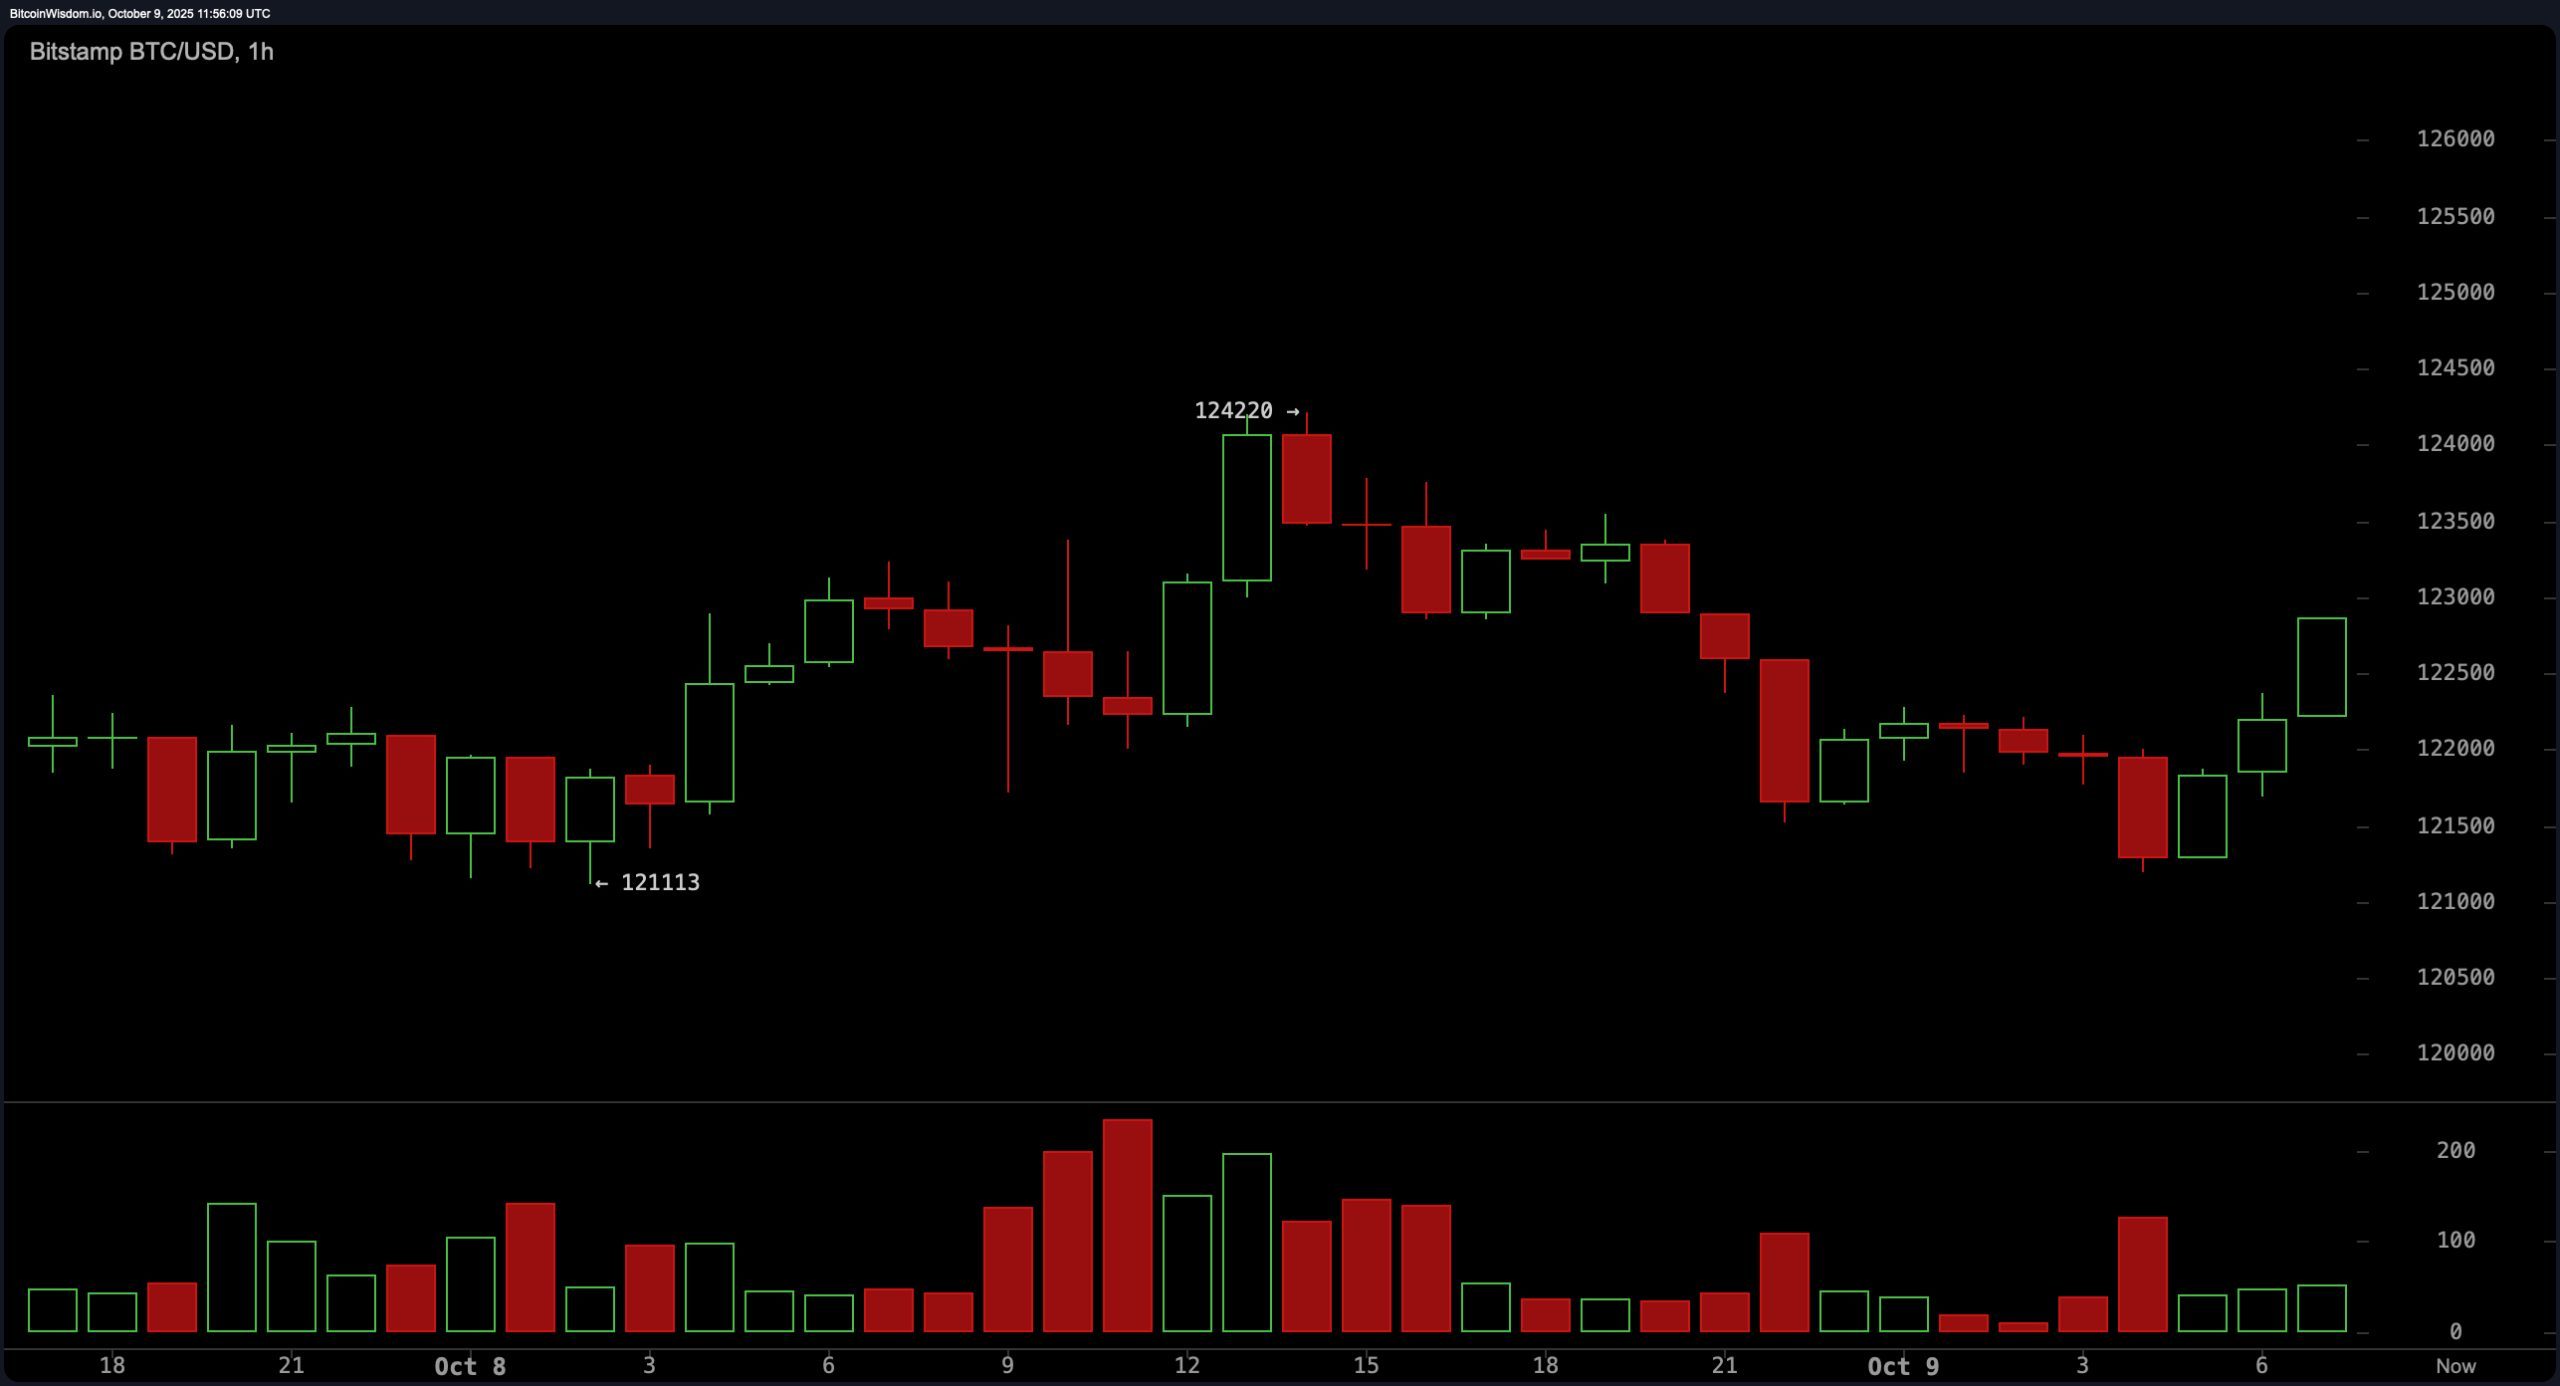
Looking at the 1-hour chart, the price is moving sideways with a slight downward trend, staying within a range of $121,000 to $124,000. There’s more selling pressure than buying, suggesting the price might continue to fall. The price is currently trying to move above $122,800, but this move isn’t convincing yet because it lacks strong buying activity. If the price can break above $122,800 with increased buying, it could potentially rise to $124,200. However, if it fails, we might see the price fall back towards the $121,000 level.
Oscillators show a mixed picture, reflecting market hesitation. The relative strength index (RSI) sits at 63.1, the stochastic oscillator at 78.7, the commodity channel index (CCI) at 81.1, the average directional index (ADX) at 31.1, and the awesome oscillator at 7,578.1—all categorized as neutral. However, the momentum oscillator shows a value of 8,410.0, signaling bearish divergence, while the moving average convergence divergence (MACD) level at 2,612.3 offers a contrasting bullish indication. This divergence among key indicators highlights uncertainty and supports a wait-and-see approach until a definitive signal aligns across tools.
The suite of moving averages (MAs) reveals a dominant bullish backdrop. All short-term and long-term moving averages, including the exponential moving average (EMA) and simple moving average (SMA) across 10, 20, 30, 50, 100, and 200 periods, are positioned below current price levels and labeled bullish. For instance, the 10-period EMA stands at $121,020.4 and the 10-period SMA at $121,389.5, both significantly below the current price. Longer-term trends remain supportive of upward momentum, reinforcing the macro bullish trend despite short-term consolidation across lower timeframes. Should bitcoin hold above $121,000, these averages are likely to continue offering technical support.
Bull Verdict:
Overall, the market is still trending upwards, as prices are above key moving averages and economic indicators are positive. Although there’s been some recent sideways movement, if the price stays above $121,000 and breaks past $124,000, it could climb to $126,000 and potentially reach even higher levels.
Bear Verdict:
Despite a resilient macro trend, weakening momentum across shorter timeframes and bearish volume dynamics raise caution. If bitcoin fails to reclaim and hold above $123,500, and particularly if $121,000 breaks down, the asset could retrace toward the $119,000 support zone, suggesting a deeper corrective phase is in motion.
⚡ Bitcoin Price Watch — Quick FAQ
Bitcoin’s price isn’t rising past $124,000 because investors are selling to realize gains and are holding off on further investment until they see more significant trading activity, which would signal a likely price increase.
Traders should pay attention to key support levels between $115,000 and $121,000. The price is likely to encounter resistance around $124,000 to $126,000.
Right now, market indicators are sending mixed signals. While the upward trend is losing some strength, moving averages still suggest a generally positive direction.
The price of Bitcoin is likely to make a significant move if it either breaks above $124,000 with strong trading volume, or falls below $121,000. These levels will likely determine the future direction of the price.
Read More
- NTE Drift Guide (& Best Car Mods for Drifting)
- How to Get the Wunderbarrage in Totenreich (BO7 Zombies)
- All Aswang Evidence & Weaknesses in Phasmophobia
- How to Get Necrolei Cyst & Strong Acid in Subnautica 2
- Conduit Crystal Location In Subnautica 2
- Where to Find Prescription in Where Winds Meet (Raw Leaf Porridge Quest)
- Diablo 4 Best Loot Filter Codes
- Best Burst & Full Auto Builds for the M16A4 in BF6
- How to Craft Repair Tools in Subnautica 2
- Best Where Winds Meet Character Customization Codes
2025-10-09 16:55