Ethereum, as of Sunday, Oct. 26, is standing on the precipice of greatness at $4,070 per unit, oscillating within an intraday range of $3,926 to $4,081.90, while its wallet bulges with $16.27 billion in trading volume and a market cap strutting proudly at $489 billion. This digital dreamboat is testing the dreaded overhead resistance with renewed vim, though its long-term trend remains a confusing mix of technical signals that may or may not result in a major life decision for your portfolio.
Ethereum Chart Outlook
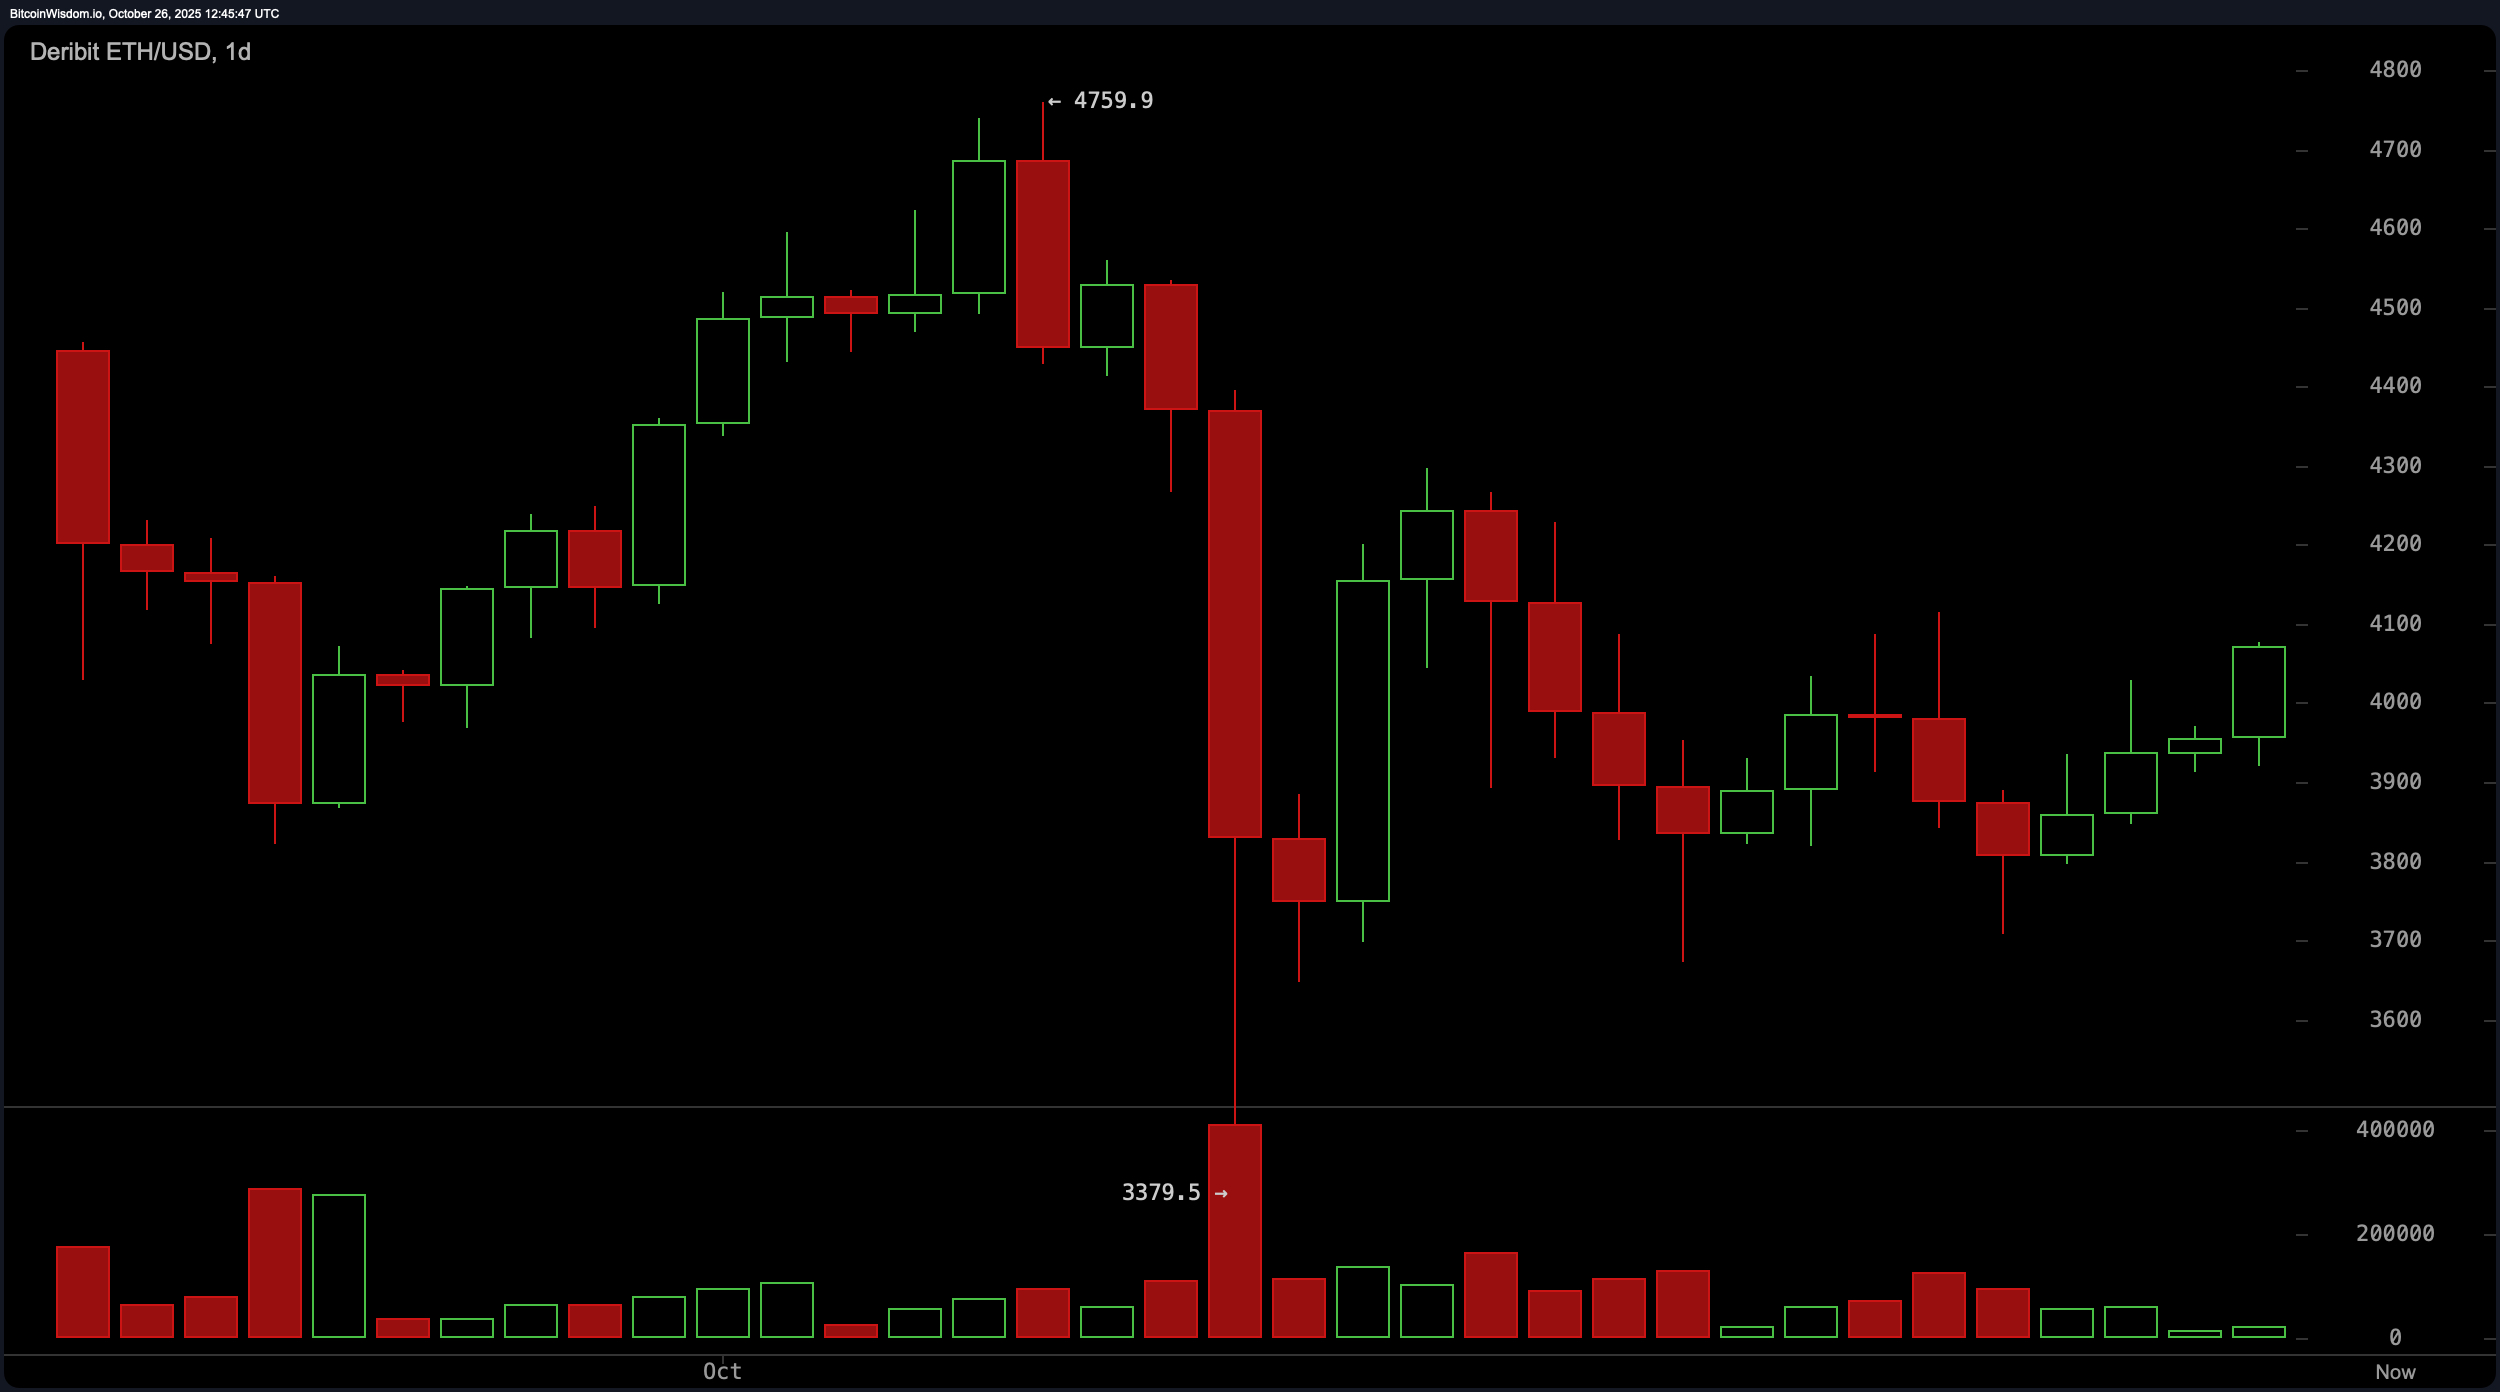
The daily chart (1D) offers a panoramic view of Ethereum’s story arc. After plummeting from $4,759.9 to $3,379.5 like a falling meteorite of sadness, Ethereum began writing its redemption arc, printing higher lows and giving the impression that buyers are valiantly reclaiming control-cue epic movie music.
Currently, Ethereum’s bullish candles are tiptoeing around the $4,100-$4,200 resistance zone-an area it’s tried to conquer in the past with about as much success as a cat trying to catch a laser pointer. Volume during this recovery phase is increasing, with green candles popping up like fireworks on New Year’s Eve, suggesting there may be more behind this rally than just a caffeine-fueled market frenzy. The macro tone? If Ethereum manages to stay above $4,000, we might just be looking at the beginning of something big-cue the dramatic music again.
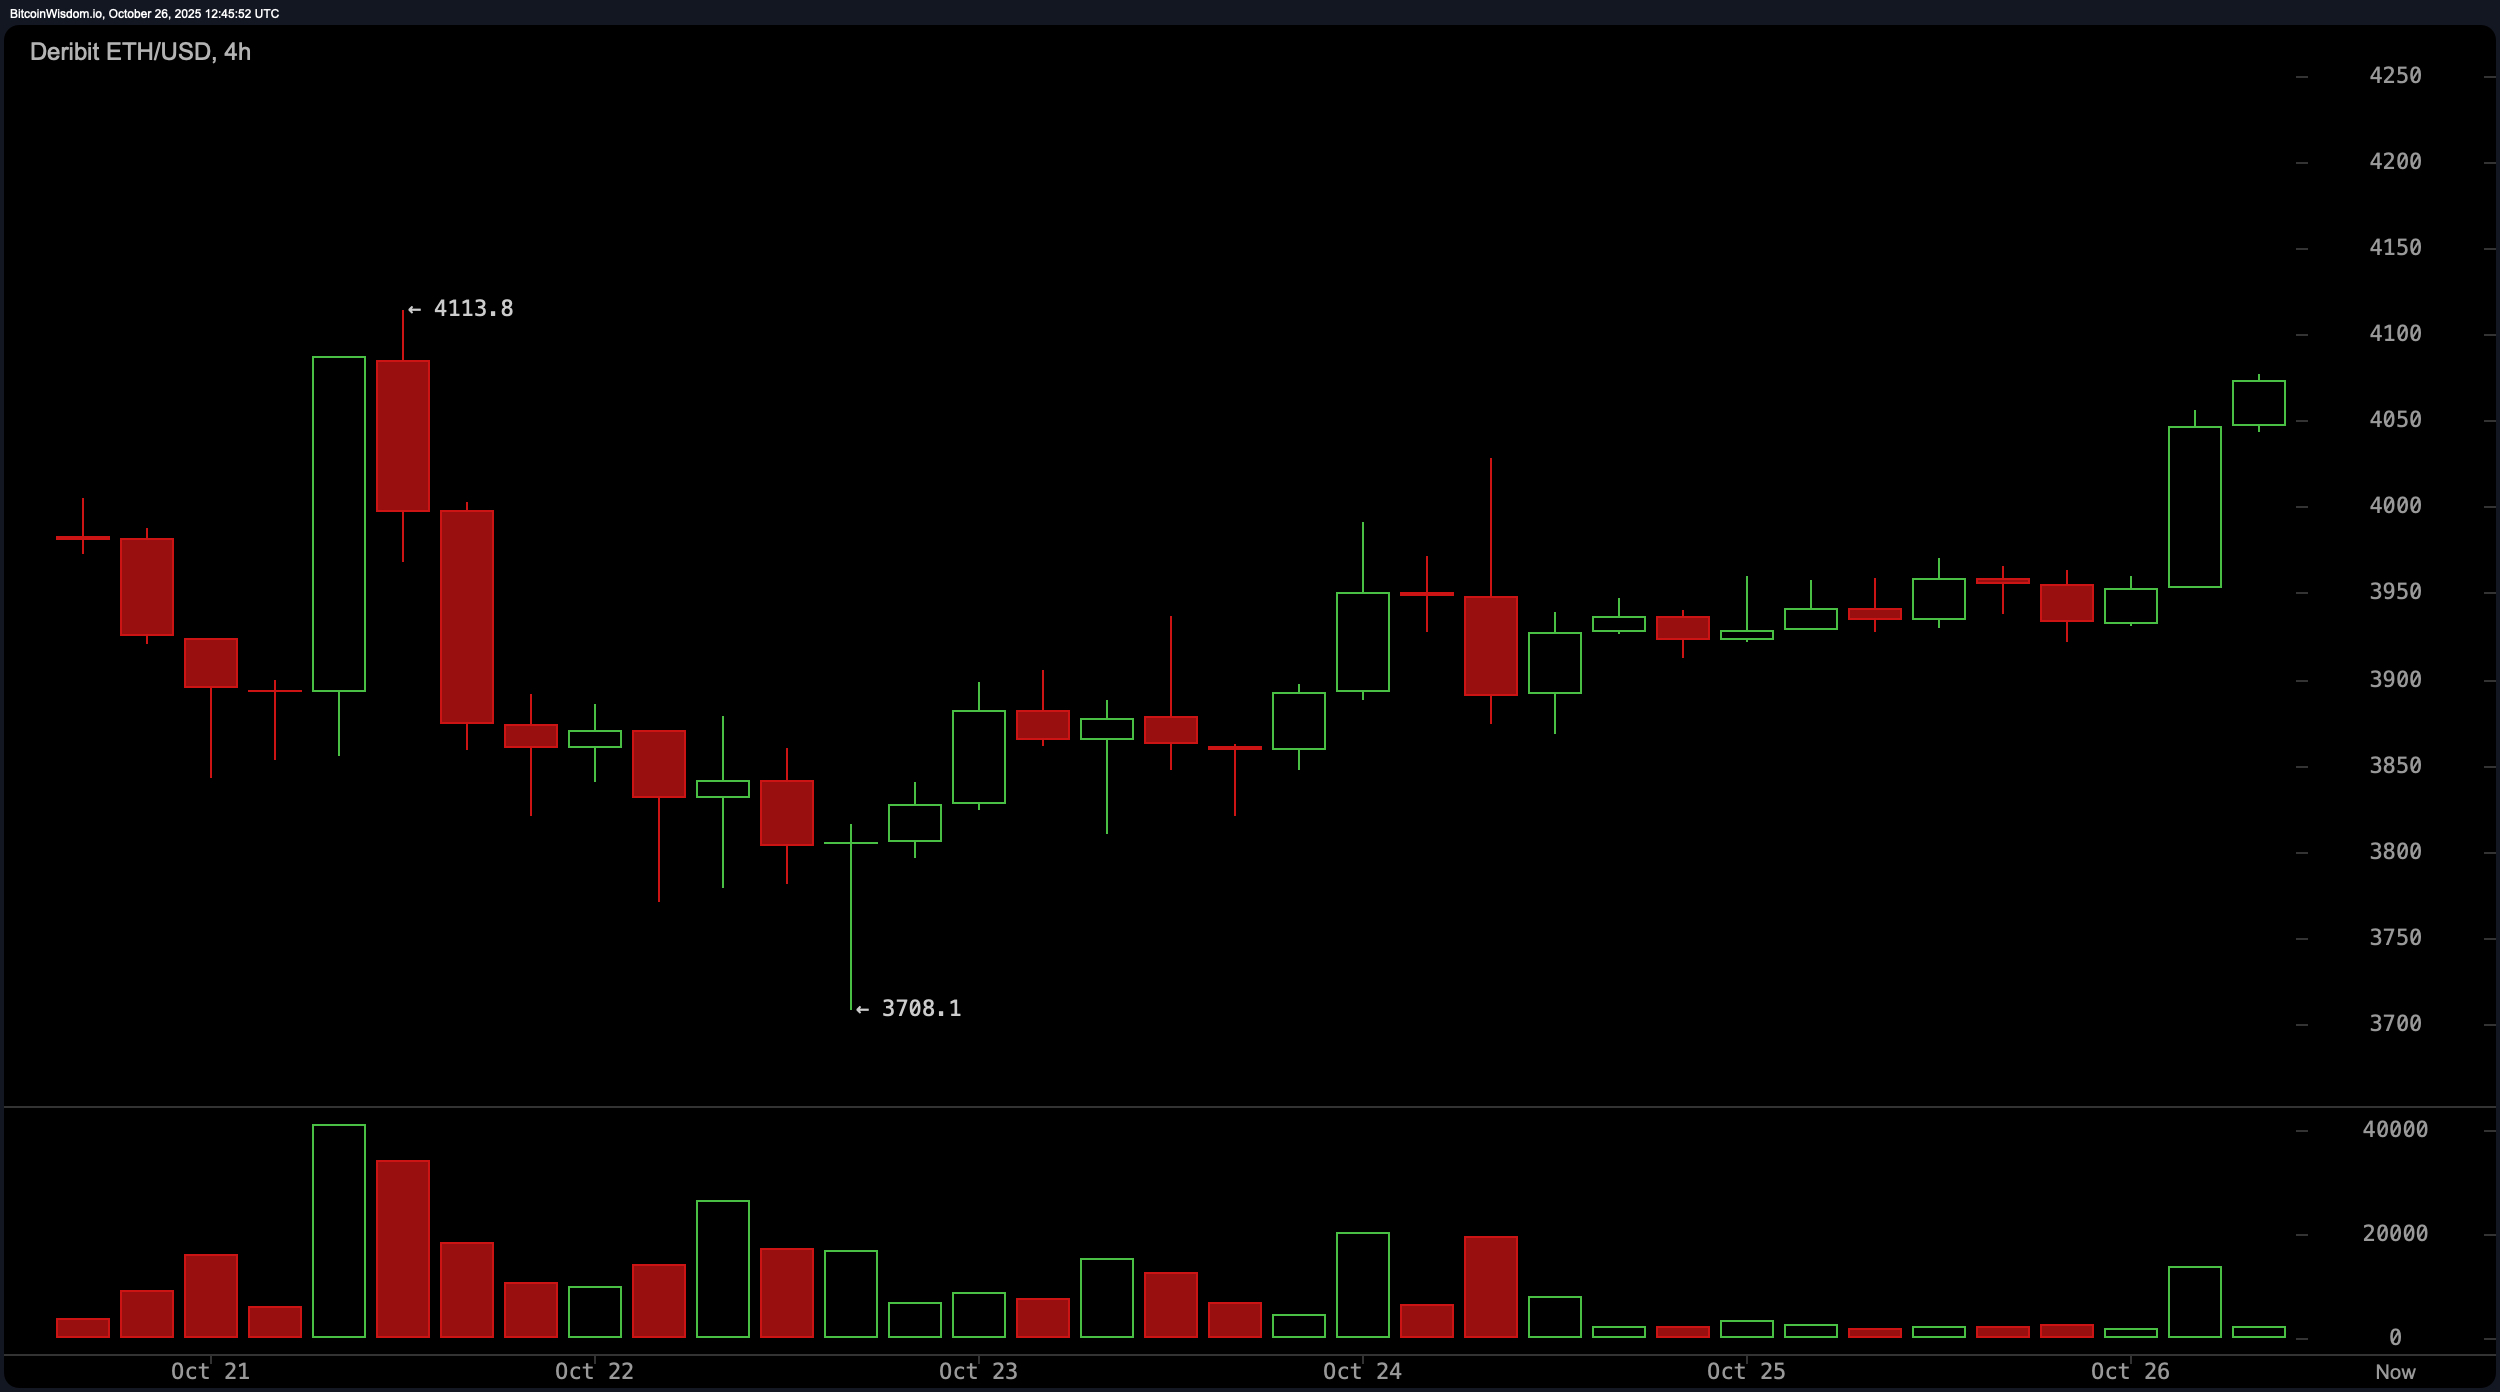
Looking at the 4-hour chart (4H), Ethereum’s bounce off $3,708.1 has turned into a rounded bottom pattern-a shape so classic it practically screams “trend reversal” like a vinyl record being scratched. The breakout above $3,950 came with high volume, signaling that market participants are all in-no turning back now. With a solid structure of higher lows and candles that seem to surge in a ‘hulk smash’ fashion, this looks like a setup for something big, especially with momentum charging toward the next resistance at $4,100 and $4,200. For the time being, the short-term target remains a humble $4,100-$4,200 zone, but traders, watch out-$3,875 is the crucial level to hold for the trend to remain solid.
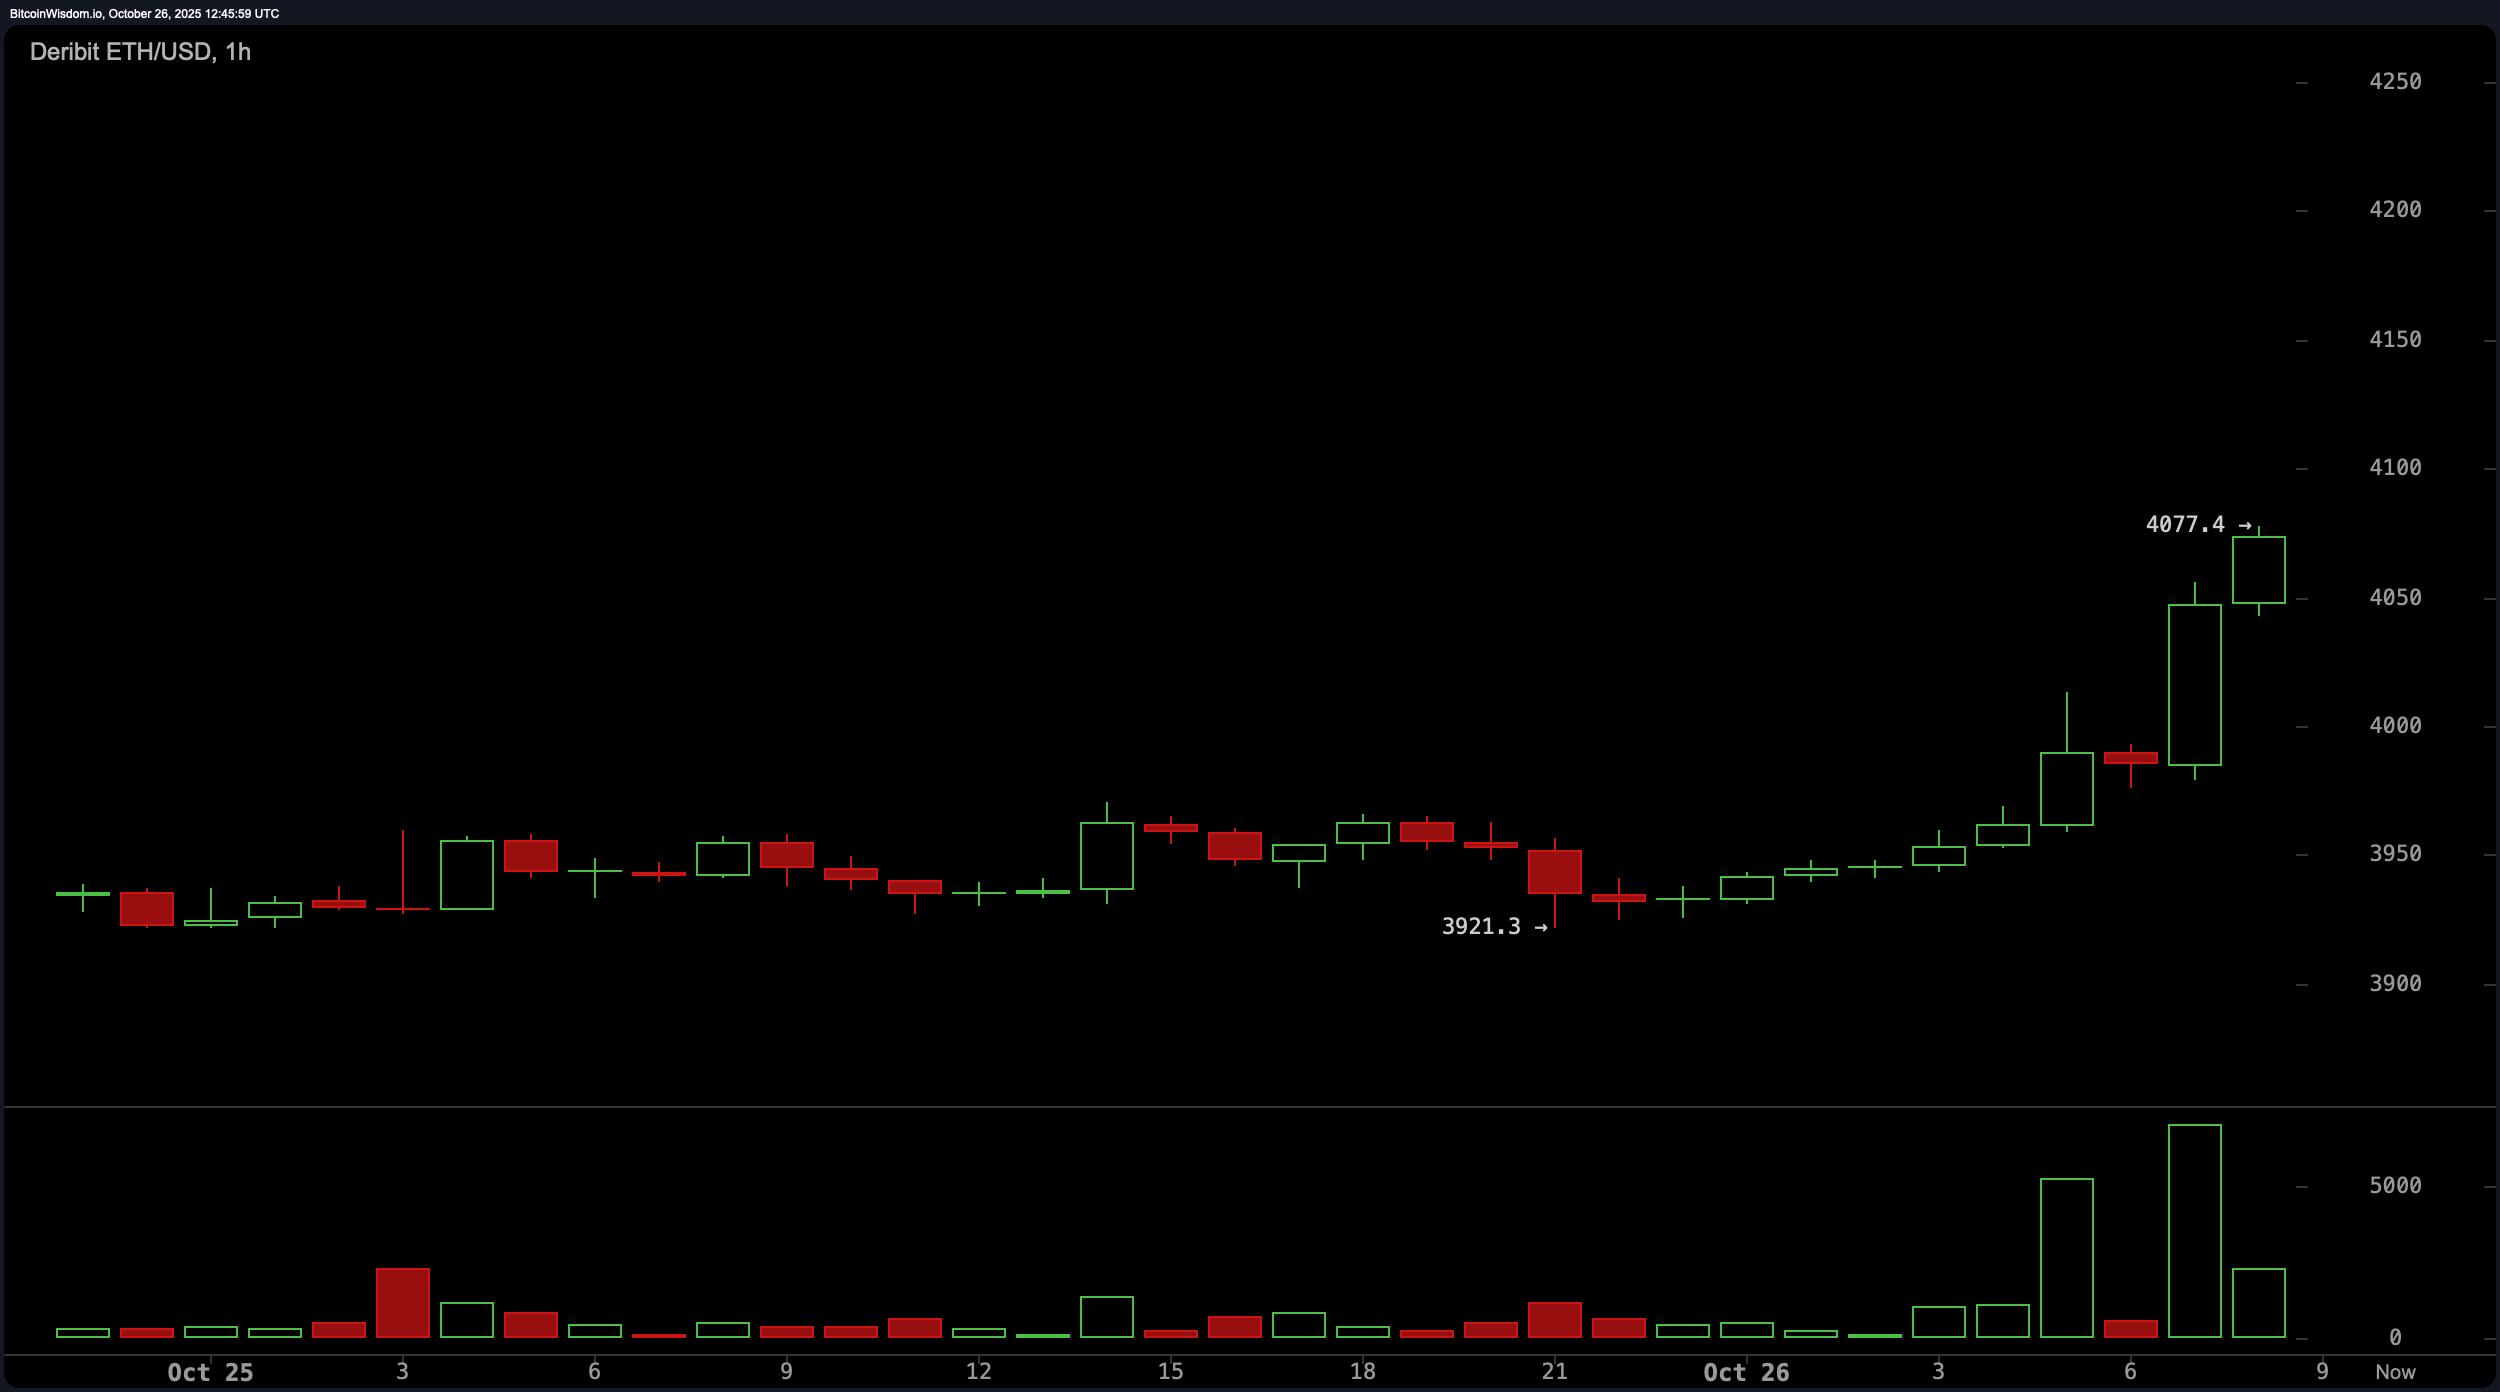
On the 1-hour chart (1H), Ethereum is acting like it’s in a race, charging towards a session high of $4,081.9, propelled by early-session enthusiasm that’s almost palpable. The structure? It’s a textbook case of the market saying, “Look at me go!” with a series of smaller candles transforming into massive green breakouts, underpinned by a sharp increase in volume. But-hold onto your hats-it’s not immune to a little froth. A pullback to the $4,000-$4,025 zone could be the perfect moment for a strategic re-entry. But remember, risk control below $3,985 is key for those willing to venture into the $4,090-$4,100 zone for a scalp or two.
Oscillators aren’t exactly waving pom-poms for Ethereum’s cheerleading squad, but they’re certainly not booing either. The relative strength index (RSI) is sitting at a neutral 49.5-neither overbought nor oversold. The stochastic oscillator is at a mild 50.2, and the commodity channel index (CCI) is hanging out at a flat −4.9. The average directional index (ADX) is a bit of a party pooper at 21.1, suggesting that trend strength is weak, and market conviction is still finding its footing. On the other hand, momentum is sitting strong at 161.6, while the moving average convergence divergence (MACD) is perched at −91.5, signaling potential for upward movement. Hold on tight, this rollercoaster might be worth it.
Moving averages aren’t quite on the same page, however. The short-term exponential moving average (EMA 10) is sitting at $3,961.7, with the simple moving average (SMA 10) close behind at $3,917.3, showing a positive short-term outlook. But once you start stretching things out to the 30, 50, and 100-period averages, things start to get a little… moody. The 30-period simple moving average is at $4,136.4 and the 50-period EMA is at $4,124.2-both pointing downward. So, yeah, Ethereum’s got some strong short-term excitement, but it’s also got to break past that nagging resistance above. Classic Ethereum.
If Ethereum can maintain momentum above the $4,000 threshold and bulldoze through the $4,100-$4,200 resistance zone on hefty volume, we might be looking at the start of a glorious upward journey. With short-term indicators looking rosy and buyers making their presence known, this rally could be just getting started.
Bear Verdict:
Despite all the excitement, Ethereum still faces an unforgiving ceiling above. The long-term moving averages are flashing their “we’re not convinced” warning signs, and if volume fails to impress and Ethereum can’t stay above $4,100, well… it might just take a breather and fall back into its old habits. Only time will tell, dear trader.
FAQ ⏰
- Where is Ethereum trading now?
Ethereum is lounging at $4,070, with resistance making itself comfortable around $4,100-$4,200. - Is Ethereum showing bullish momentum?
Oh, absolutely! Short-term charts are flashing green, and volume is heading north-this is no fleeting excitement. - What’s the key support level to watch?
Support is hanging around $3,875, with $4,000 acting as the ultimate pivot point. - What could signal a breakout?
A solid close above $4,200, backed by strong volume, would send the bulls into a frenzy.
Read More
- Re:Zero Season 4, Episode 6 Release Date & Time
- NTE Drift Guide (& Best Car Mods for Drifting)
- How to Get the Wunderbarrage in Totenreich (BO7 Zombies)
- How to Beat Turbines in ARC Raiders
- All Aswang Evidence & Weaknesses in Phasmophobia
- How to Get Necrolei Cyst & Strong Acid in Subnautica 2
- Diablo 4 Best Loot Filter Codes
- Alan Wake Event in Phasmophobia, Explained
- Top 8 UFC 5 Perks Every Fighter Should Use
- USD RUB PREDICTION
2025-10-26 17:10