This $0.14 region has been the crypto world’s version of a safety net… if you’re a squirrel trying to avoid a fall 🐿️. TradingView data shows repeated reactions to this level across multiple cycles, making it a key area for assessing short-term momentum and long-term structural resilience. 🧠
Some experienced technical analysts who track multi-cycle structure-rather than anonymous social-media posts-note that the current price action still allows room for a short-term rebound, provided that buyers maintain consistency. This view is based on standard technical principles such as support-resistance behavior and momentum oscillators, rather than price calls from individual influencers. 🧙♂️
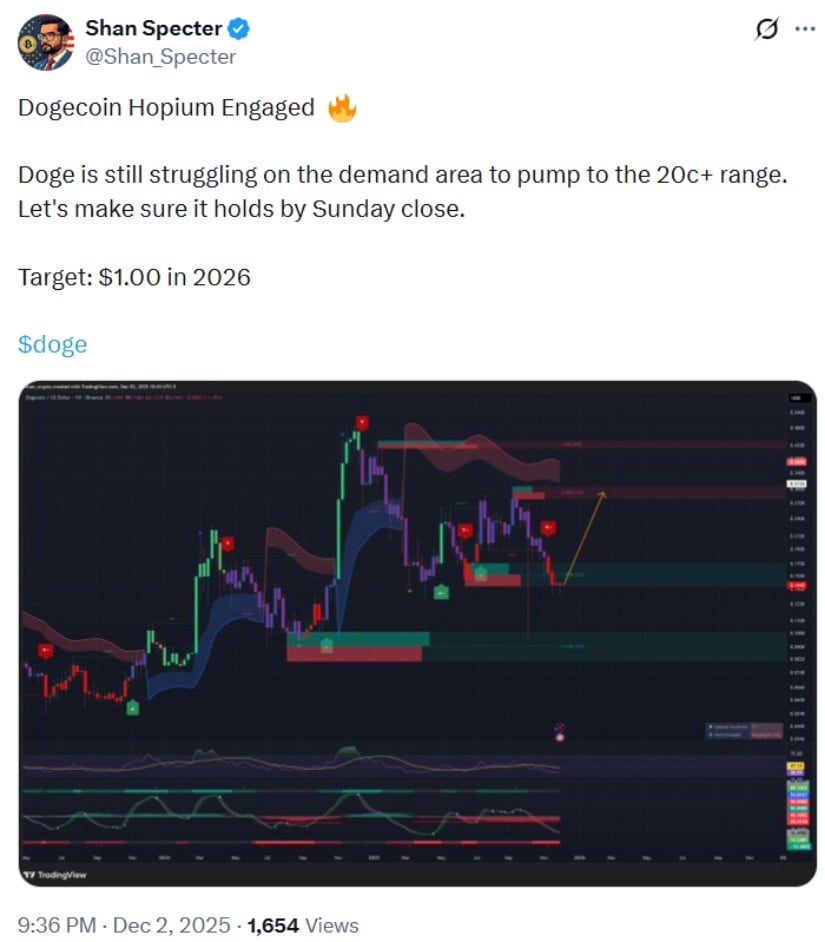
While community-driven discussions often revive long-standing questions about a potential move to $1 by 2026, most data-based models place near-term fair-value ranges considerably lower. Historically informed projections that rely on previous cycle behavior and liquidity trends currently suggest a more conservative band around $0.18-$0.24, depending on overall market strength. 📉
Cycle Structures and Long-Term Outlook
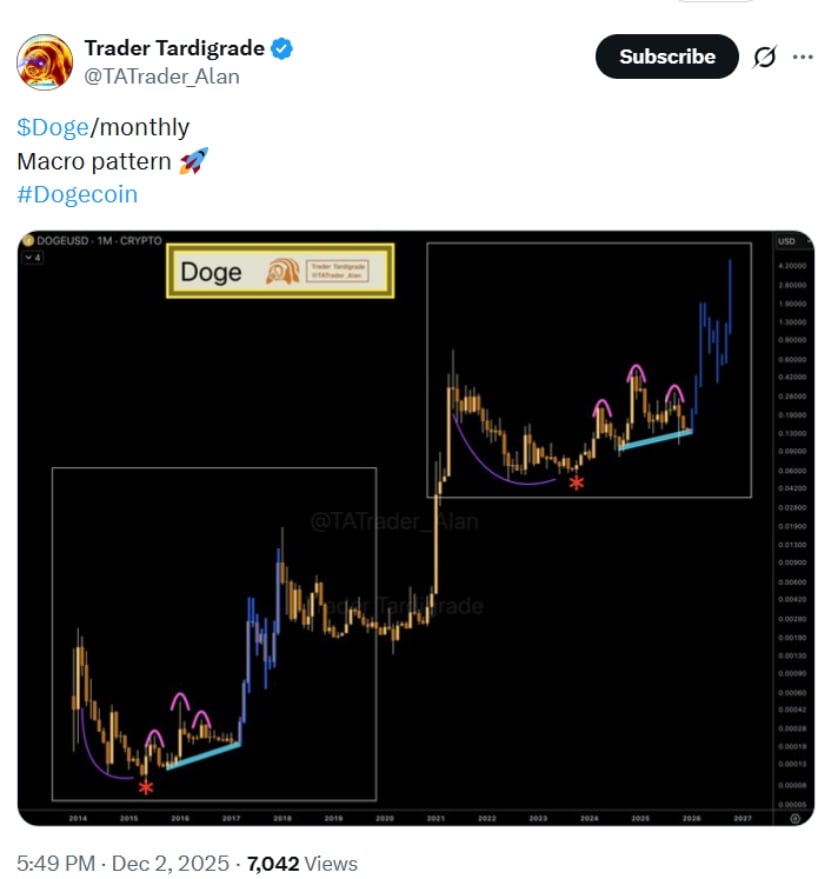
A frequently referenced long-term DOGE chart tracks multi-year structure from 2014 to 2025, highlighting prior breakout moments in 2017 and 2021 and a broader ascending trendline. Cycle analysis-while limited in its predictive reliability-can provide historical context. These models assume that investor psychology and liquidity patterns may repeat across cycles, but they also carry high uncertainty in volatile markets. 🌀
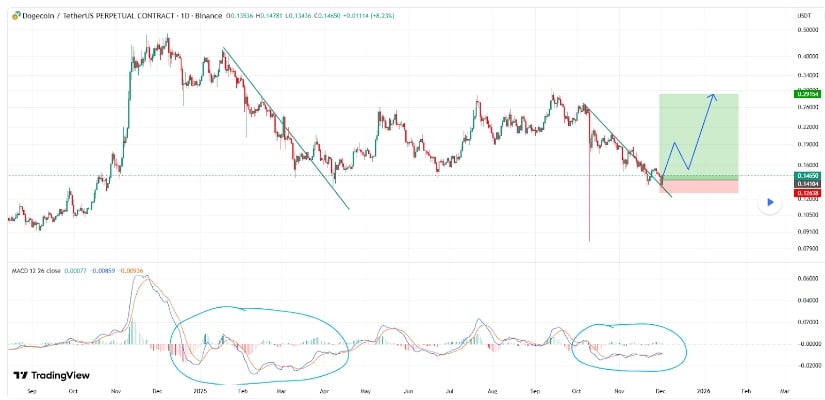
Analysts following accumulation indicators note mixed signals: some accumulation clusters resemble early-stage cup-and-handle structures, while others show hesitation tied to current liquidity and macro conditions. Some models suggest that, if accumulation persists and market liquidity improves, DOGE could revisit ranges such as $0.30-$0.45; however, these should be interpreted as conditional scenarios-not expectations. 🤷♂️
Community sentiment remains divided. Traders on social platforms often share highly optimistic targets (e.g., $0.42 or $1), but these views typically reflect community enthusiasm rather than data-driven forecasting. More experienced analysts caution that Dogecoin’s annual inflation of ~5 billion coins continues to weigh on long-term valuation unless accompanied by sustained demand growth. 🚧
Potential Drivers for Future Growth
Ongoing conversations around a potential Dogecoin spot ETF have contributed to heightened interest. While institutional access could influence liquidity and visibility, no approvals are guaranteed, and initial inflows into related thematic products have been modest. Historically, ETF announcements for other assets (e.g., Bitcoin and Ethereum) have shown that early inflows are not always immediate catalysts for price expansion. 📈
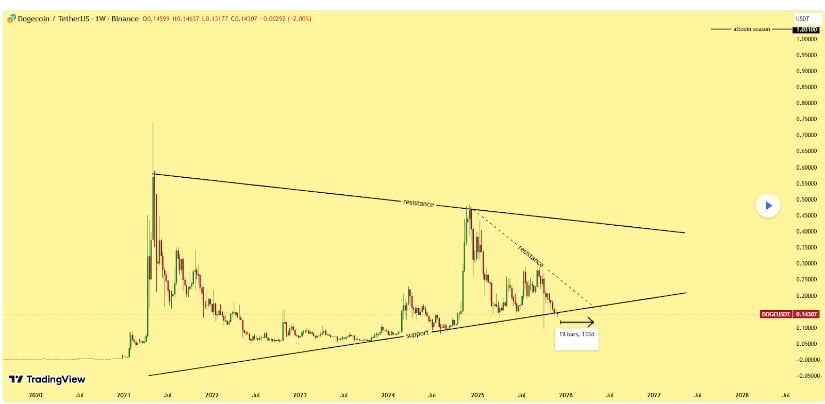
From a technical perspective, several traders point to a developing falling wedge pattern-a compression formation that can signal a reversal if price breaks the upper boundary with increased volume. This reinforces the importance of confirmation rather than anticipation. 🧪
Dogecoin’s utility-particularly in low-fee payments and microtransactions-continues to support its long-term relevance. The asset’s cultural presence has historically contributed to durable network activity, although long-term adoption trends will depend on merchant integration, user growth, and broader market conditions. 🏦
Long-Term Price Predictions
Forecasts for 2025 and beyond vary widely depending on methodology. More cautious models emphasize:
-
DOGE’s uncapped supply, which may limit long-term appreciation 🚫
-
macroeconomic constraints such as liquidity tightening 🧊
-
The possibility that enthusiasm-driven rallies may diverge from fundamentals 🧠
Meanwhile, optimistic models suggest that if DOGE repeats patterns seen in previous late-cycle expansions-and if it breaks its 2024 local high near $0.20-a consolidation zone around $0.25 could form before any larger move. These comparisons, however, are conceptual frameworks rather than precise predictive systems. 🧩
On lower timeframes, Dogecoin has recently tested the bottom of a descending channel on the 1-hour chart. The RSI-a momentum indicator-hovered near oversold conditions, and repeated bounces around $0.15, alongside the 100-period moving average, suggest early stabilization. However, trend confirmation requires a break above channel resistance. Some traders note that a Kijun breakout on the Ichimoku system above $0.15100 could indicate a momentum shift, but this is an advanced indicator and should be used with caution. 🧭
Technical Indicators and Short-Term Overview
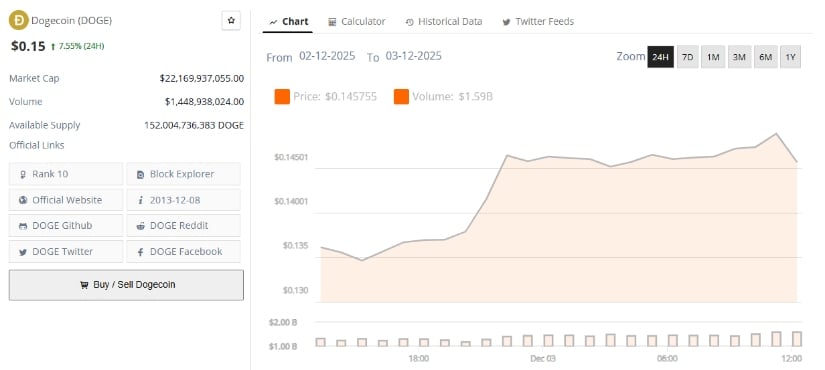
Recent price action shows Dogecoin under short-term pressure after falling below $0.15, triggering a high-volume selloff exceeding 1.56 billion DOGE, according to TradingView data. Despite increased discussion around Dogecoin-related ETFs from firms such as Grayscale and Bitwise, early inflows remain too small to meaningfully alter market structure. 💸
Current metrics (approximate, Dec. 3 data):
-
Price: ~$0.15 🧾
-
Market cap: ~$20.9 billion 💵
-
24-hour volume: ~$1.42 billion 📈
-
Trend: Bearish across major moving averages 📉
-
RSI: Neutral 🧠
Dogecoin’s inflationary supply model, unlike Bitcoin’s capped system, continues to be a central factor in long-term valuation discussions. Additionally, commentary from public figures-such as Elon Musk-often generates short-lived volatility but rarely influences sustained price trends. 🚀
Market Weakness and Fundamental Drivers
Dogecoin’s market backdrop remains challenging following the 63% decline on October 10 during a broader crypto-market selloff. While the asset has since stabilized near the mid-$0.14 range, many analysts note that evidence of long-term accumulation remains limited. 🧨
Macro factors-including global liquidity constraints, regulatory developments, and inconsistent risk appetite across crypto markets-are exerting downward pressure on speculative assets. As the industry approaches 2026, analysts are watching whether DOGE can hold current support levels under shifting market conditions. 🧭
Final Thoughts
Long-term projections remain highly uncertain. Some cycle-based structural models suggest that Dogecoin could revisit or exceed previous highs in later expansion phases, but these projections rely heavily on the assumption that past behavior will repeat-a premise that historically performs inconsistently. 🌀
Current technical and fundamental data do not provide evidence to support an imminent or high-probability move back to $1 in the near term. 🚫
Ultimately, Dogecoin’s long-term trajectory will depend on the interplay of:
-
market-liquidity cycles 🌀
-
adoption trends and utility expansion 📈
-
institutional participation 🏦
-
macroeconomic conditions 🌍
-
investor sentiment 🧠
As with all crypto assets, outcomes are uncertain and evolve with market behavior, making it essential for readers to view price scenarios as conditional, not guaranteed predictions. 🧪
Read More
- All Skyblazer Armor Locations in Crimson Desert
- All Shadow Armor Locations in Crimson Desert
- How to Get the Sunset Reed Armor Set and Hollow Visage Sword in Crimson Desert
- Marni Laser Helm Location & Upgrade in Crimson Desert
- Best Bows in Crimson Desert
- All Helfryn Armor Locations in Crimson Desert
- All Golden Greed Armor Locations in Crimson Desert
- How to Craft the Elegant Carmine Armor in Crimson Desert
- Keeping Large AI Models Connected Through Network Chaos
- One Piece Chapter 1179 Preview: The Real Imu Arrives in Elbaf
2025-12-04 00:07