\n
Bitcoin, that enigmatic digital darling, was lounging at $87,382 on Dec. 27, 2025, flaunting a market cap of $1.74 trillion and trading $30.6 billion in a single day. Not bad for something you can’t even hold in your hand. It spent the day oscillating between $86,673 and $88,965, like a nervous actor pacing backstage before a big performance. Indicators across multiple timeframes-hourly, daily, and everything in between-suggested less certainty and more of a “wait and see” vibe. Think of it as watching a fuse slowly burn, wondering if it’ll spark fireworks or just fizzle out. 🎇
\n\n
Bitcoin Chart Outlook
\n
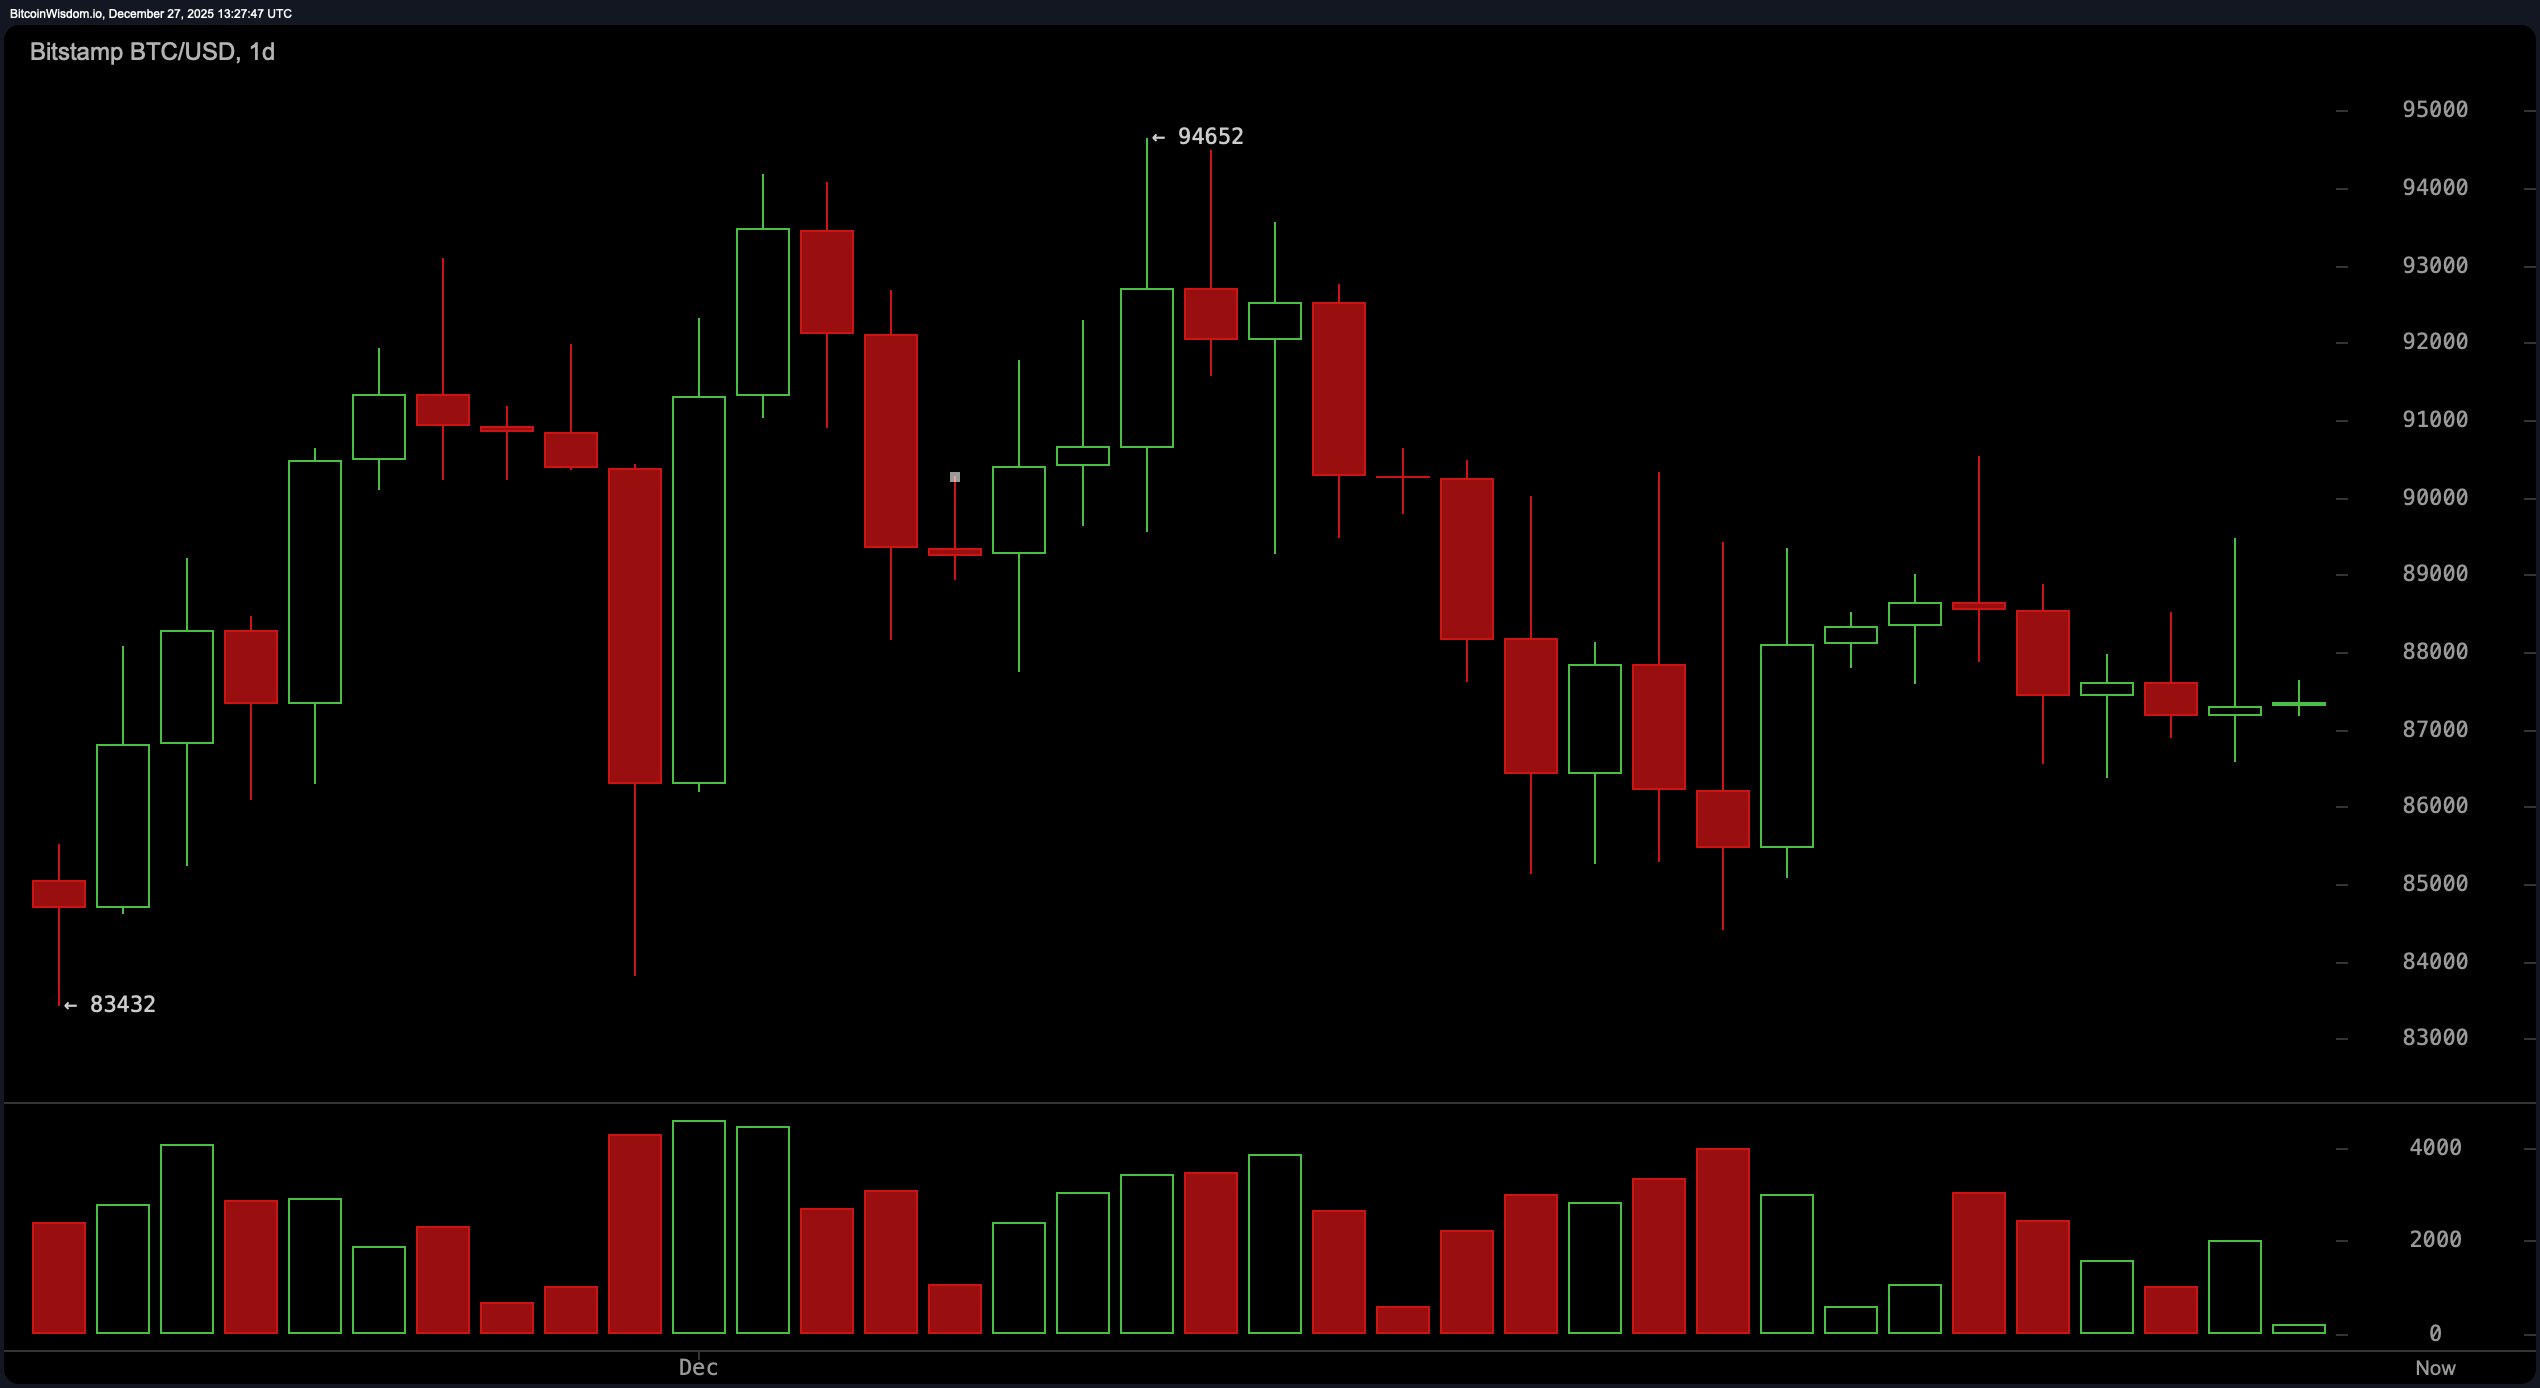
On the daily chart, Bitcoin was stitching together a robe of lower highs and lower lows-a classic descending structure that whispers “bearish” but hasn’t quite yelled it yet. After peaking near $94,652, it slid gracefully into the $87,000-$88,000 zone, where it now hums quietly, like a refrigerator you only notice when it stops. 📉
\n\n
The real plot twist, though, is the dwindling volume-downright whispery levels of buying pressure. This is often the intermission before the next act, and traders would be wise to keep an eye on whether Bitcoin reclaims the $90,000 mark, ideally with some volume fireworks, before declaring the bulls back in charge. 🎢
\n
\n
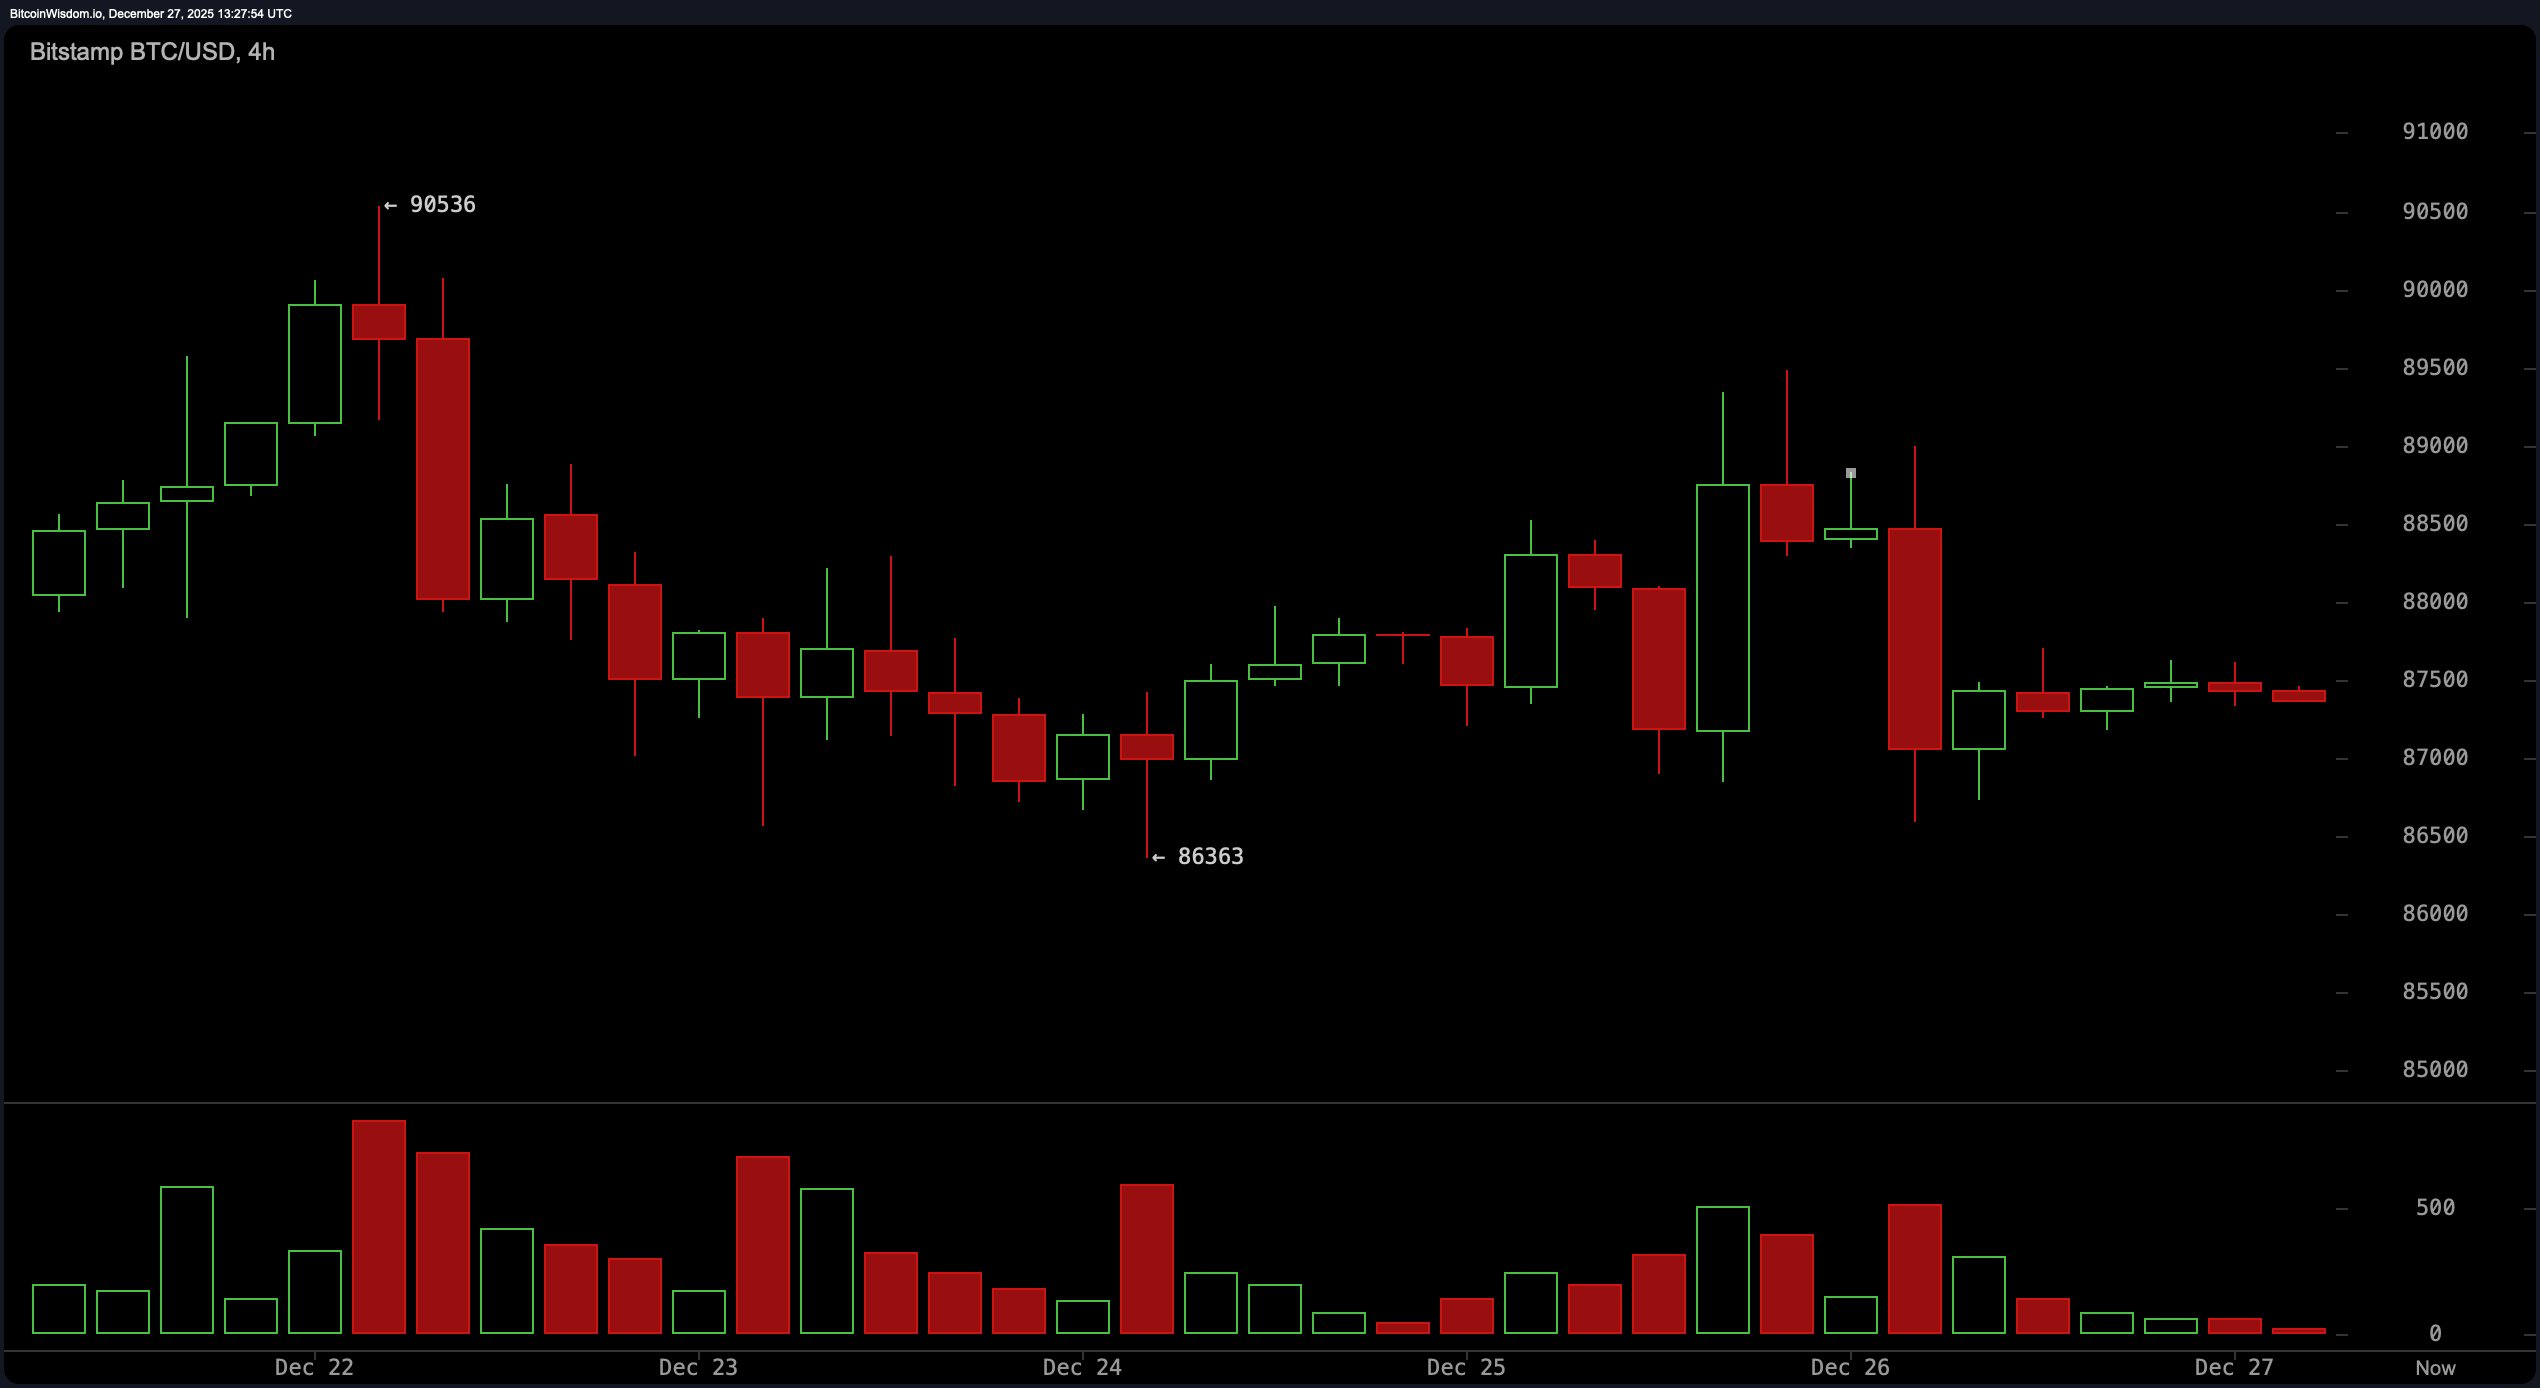
On the 4-hour chart, Bitcoin’s mood turns decidedly jaded. The $90,536 rejection came swift and harsh, escorted by a brigade of red candles-apparently, no one RSVP’d to the rally. Support at $86,363 has held firm, like a bouncer at the $86K club door, but consolidation under resistance suggests sellers still have the louder voice. Notably, upswings are met with lighter volume, while sell-offs are making more noise-a classic case of bearish pressure masquerading as a sideways market. 🐻
\n
\n
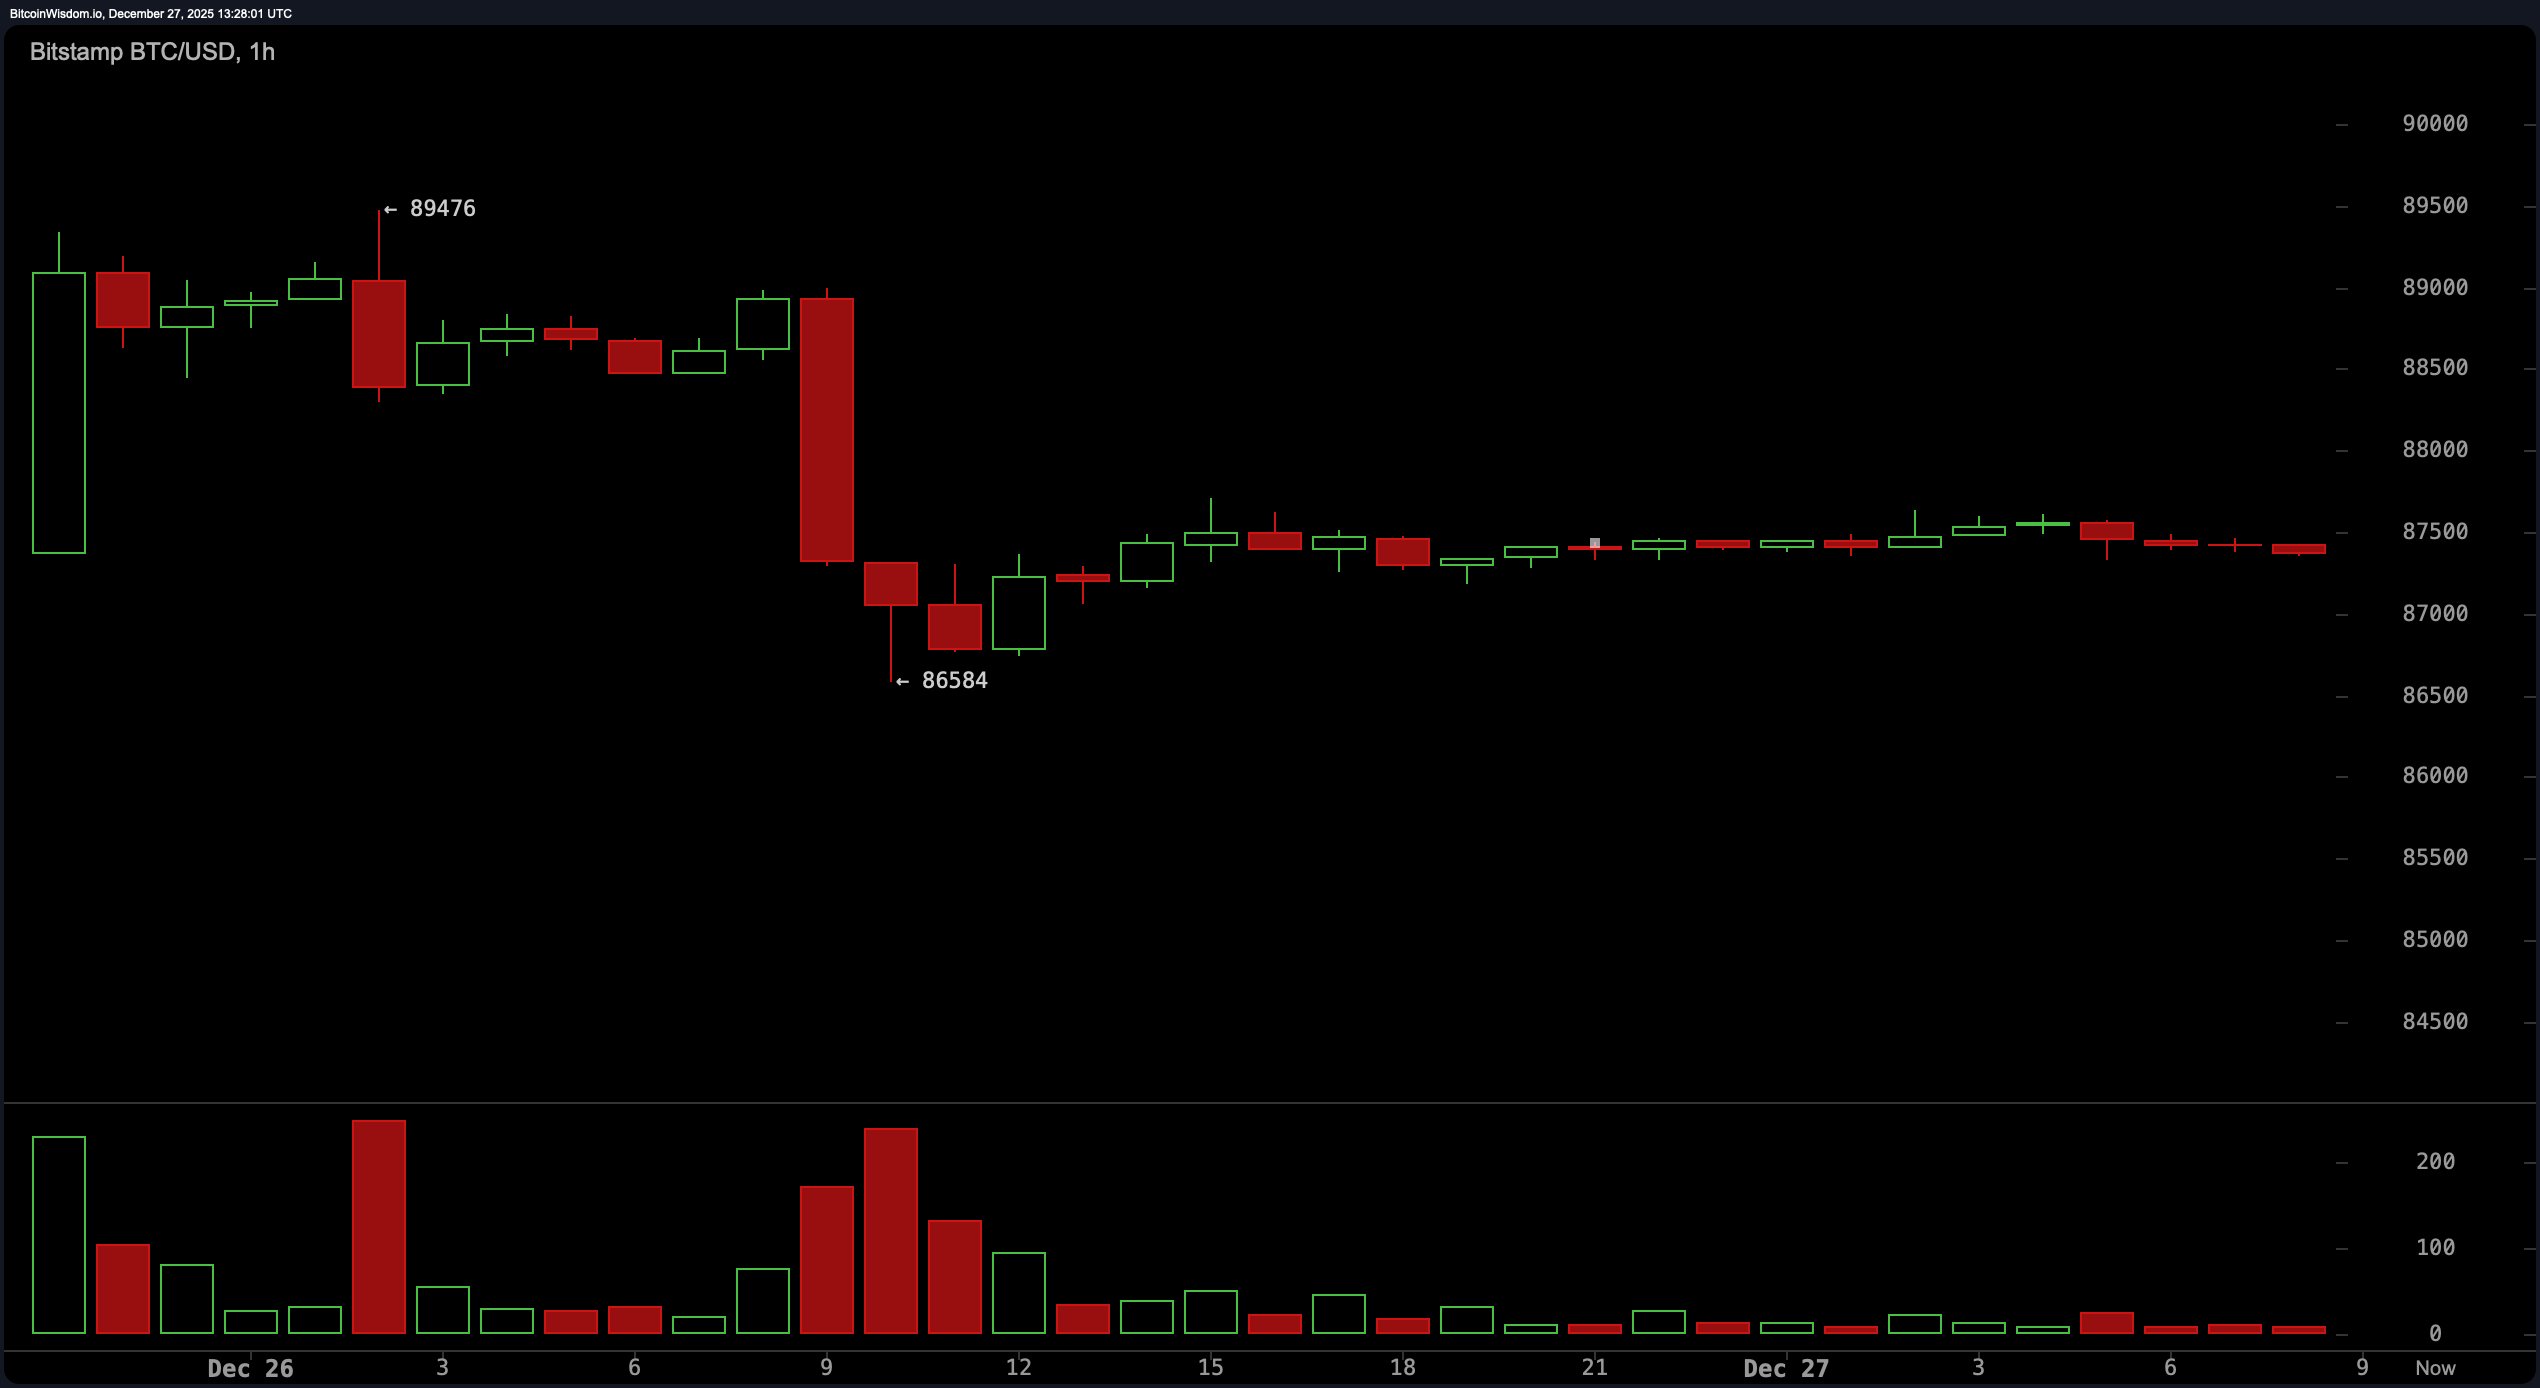
Zooming into the 1-hour chart is like stepping into a cryptographic fog. A flash drop from $89,400 to $86,500 spooked the tape, followed by price action that can best be described as… politely indecisive. The range is tight-between $87,000 and $87,500-and the volume? Practically whispering. This could be a textbook accumulation zone, preparing for a breakout above $88,000, or it could be a cunning bear flag, winding up for another leg down should $86,000 crumble. 🕵️\u200d♂️
\n
\n
The oscillators don’t exactly scream clarity either, which is perfect if you enjoy ambiguity served with a side of caution. The RSI, Stochastic, CCI, ADX, and Awesome Oscillator are all flashing neutral-the ultimate non-committal status. Only the momentum and MACD are nodding slightly upward. If the market were a cocktail party, these two would be the only guests holding espresso shots while everyone else clutches water. ☕
\n\n
As for the moving averages? They’re putting on a masterclass in collective skepticism. All short-term and long-term moving averages-from the EMA 10 through the SMA 200-are parked above the current price and leaning bearish. It’s like the entire moving average family got together and decided Bitcoin needed a timeout. Whether price can break through $88,000-$88,500 resistance will determine if it’s merely resting or plotting its next moonshot. Until then, the advice is simple: watch the volume, respect the chop, and remember-breakouts don’t RSVP, they crash the party. 🎉
\n
Bull Verdict:
\n
If Bitcoin can push decisively above the $88,500 threshold with meaningful volume, the setup favors a short-term revisit to the $90,000-$91,000 resistance zone. With the momentum (10) and MACD indicators flashing green while others snooze, there’s a slim but tangible window for upward continuation. For the bulls, it’s not a question of strength-it’s a question of timing and conviction. 🐂
\n
Bear Verdict:
\n
Failure to hold above the $86,000 support risks confirming the bear flag pattern spotted on the 1-hour chart, with potential downside targets around $83,500-$84,000. The ensemble of moving averages unanimously towering above price-and volume favoring sell-offs over rallies-suggests the path of least resistance could still tilt south. Bears may not be roaring yet, but they’re definitely circling. 🐻
\n
FAQ ❓
\n
- \n
- What is Bitcoin’s price today?
\nBitcoin is trading at $87,382 as of Dec. 27, 2025. - Is Bitcoin going up or down right now?
\nBitcoin is consolidating in a tight range with mixed technical signals. - What are key levels to watch for Bitcoin?
\nWatch $88,500 for potential upside and $86,000 for possible downside. - Why is Bitcoin’s volume so low today?
\nIt’s the holiday season, and quite normal. Low volume also suggests market indecision or a setup for a larger move.
\n
\n
\n
\n
\n
Bitcoin, that enigmatic digital darling, was lounging at $87,382 on Dec. 27, 2025, flaunting a market cap of $1.74 trillion and trading $30.6 billion in a single day. Not bad for something you can’t even hold in your hand. It spent the day oscillating between $86,673 and $88,965, like a nervous actor pacing backstage before a big performance. Indicators across multiple timeframes-hourly, daily, and everything in between-suggested less certainty and more of a “wait and see” vibe. Think of it as watching a fuse slowly burn, wondering if it’ll spark fireworks or just fizzle out. 🎇
Bitcoin Chart Outlook
On the daily chart, Bitcoin was stitching together a robe of lower highs and lower lows-a classic descending structure that whispers “bearish” but hasn’t quite yelled it yet. After peaking near $94,652, it slid gracefully into the $87,000-$88,000 zone, where it now hums quietly, like a refrigerator you only notice when it stops. 📉
The real plot twist, though, is the dwindling volume-downright whispery levels of buying pressure. This is often the intermission before the next act, and traders would be wise to keep an eye on whether Bitcoin reclaims the $90,000 mark, ideally with some volume fireworks, before declaring the bulls back in charge. 🎢
On the 4-hour chart, Bitcoin’s mood turns decidedly jaded. The $90,536 rejection came swift and harsh, escorted by a brigade of red candles-apparently, no one RSVP’d to the rally. Support at $86,363 has held firm, like a bouncer at the $86K club door, but consolidation under resistance suggests sellers still have the louder voice. Notably, upswings are met with lighter volume, while sell-offs are making more noise-a classic case of bearish pressure masquerading as a sideways market. 🐻
Zooming into the 1-hour chart is like stepping into a cryptographic fog. A flash drop from $89,400 to $86,500 spooked the tape, followed by price action that can best be described as… politely indecisive. The range is tight-between $87,000 and $87,500-and the volume? Practically whispering. This could be a textbook accumulation zone, preparing for a breakout above $88,000, or it could be a cunning bear flag, winding up for another leg down should $86,000 crumble. 🕵️♂️
The oscillators don’t exactly scream clarity either, which is perfect if you enjoy ambiguity served with a side of caution. The RSI, Stochastic, CCI, ADX, and Awesome Oscillator are all flashing neutral-the ultimate non-committal status. Only the momentum and MACD are nodding slightly upward. If the market were a cocktail party, these two would be the only guests holding espresso shots while everyone else clutches water. ☕
As for the moving averages? They’re putting on a masterclass in collective skepticism. All short-term and long-term moving averages-from the EMA 10 through the SMA 200-are parked above the current price and leaning bearish. It’s like the entire moving average family got together and decided Bitcoin needed a timeout. Whether price can break through $88,000-$88,500 resistance will determine if it’s merely resting or plotting its next moonshot. Until then, the advice is simple: watch the volume, respect the chop, and remember-breakouts don’t RSVP, they crash the party. 🎉
Bull Verdict:
If Bitcoin can push decisively above the $88,500 threshold with meaningful volume, the setup favors a short-term revisit to the $90,000-$91,000 resistance zone. With the momentum (10) and MACD indicators flashing green while others snooze, there’s a slim but tangible window for upward continuation. For the bulls, it’s not a question of strength-it’s a question of timing and conviction. 🐂
Bear Verdict:
Failure to hold above the $86,000 support risks confirming the bear flag pattern spotted on the 1-hour chart, with potential downside targets around $83,500-$84,000. The ensemble of moving averages unanimously towering above price-and volume favoring sell-offs over rallies-suggests the path of least resistance could still tilt south. Bears may not be roaring yet, but they’re definitely circling. 🐻
FAQ ❓
- What is Bitcoin’s price today?
Bitcoin is trading at $87,382 as of Dec. 27, 2025. - Is Bitcoin going up or down right now?
Bitcoin is consolidating in a tight range with mixed technical signals. - What are key levels to watch for Bitcoin?
Watch $88,500 for potential upside and $86,000 for possible downside. - Why is Bitcoin’s volume so low today?
It’s the holiday season, and quite normal. Low volume also suggests market indecision or a setup for a larger move.
Read More
- Robinhood’s $75M OpenAI Bet: Retail Access or Legal Minefield?
- All Skyblazer Armor Locations in Crimson Desert
- All Hauntingham’s Letters & Hidden Page in New Super Lucky’s Tale
- Speedsters Sandbox Roblox Codes
- How to Get the Sunset Reed Armor Set and Hollow Visage Sword in Crimson Desert
- How to Catch All Itzaland Bugs in Infinity Nikki
- Who Can You Romance In GreedFall 2: The Dying World?
- Black Sun Shield Location In Crimson Desert (Buried Treasure Quest)
- Invincible: 10 Strongest Viltrumites in Season 4, Ranked
- USD RUB PREDICTION
2025-12-27 17:28