Oh, Bitcoin, darling, what’s got your knickers in a twist now? Slipping below the $70,000 mark like it’s last season’s handbag? The drama! The volatility! It’s like a reality TV show, but with fewer spray tans and more spreadsheets. Short-term traders are clutching their pearls, while long-term holders are sipping their chai lattes, pretending not to care. Or are they?
According to the ever-so-wise On-chain Mind (who sounds like a mystical guru but is probably just a guy with a laptop), Bitcoin’s price is about as reliable as a weather forecast in Britain. The real tea? It’s all about holder behavior. Long-term investors are usually the cool cucumbers of the crypto world, but when they start sweating, you know it’s serious. Like, “Where’s my fainting couch?” serious.
Apparently, when these stoic souls start drowning in unrealized losses, it’s like the crypto equivalent of a midlife crisis. Bear markets, am I right? Conviction wavers, capitulation looms, and suddenly everyone’s wondering if they should have stuck with Beanie Babies instead. But hey, no one said being a crypto queen was easy.
Long-Term Holders: Still Chill, But For How Long?
On-chain Mind (bless him) points out that long-term holder risk is the crypto crystal ball. Past cycles have seen this metric spike like a fever during a flu season: 95% in 2015, 83% in 2019, and a cozy 85% in 2022. It’s like the market’s way of saying, “I’m fine, I’m fine, OH MY GOD I’M NOT FINE.”
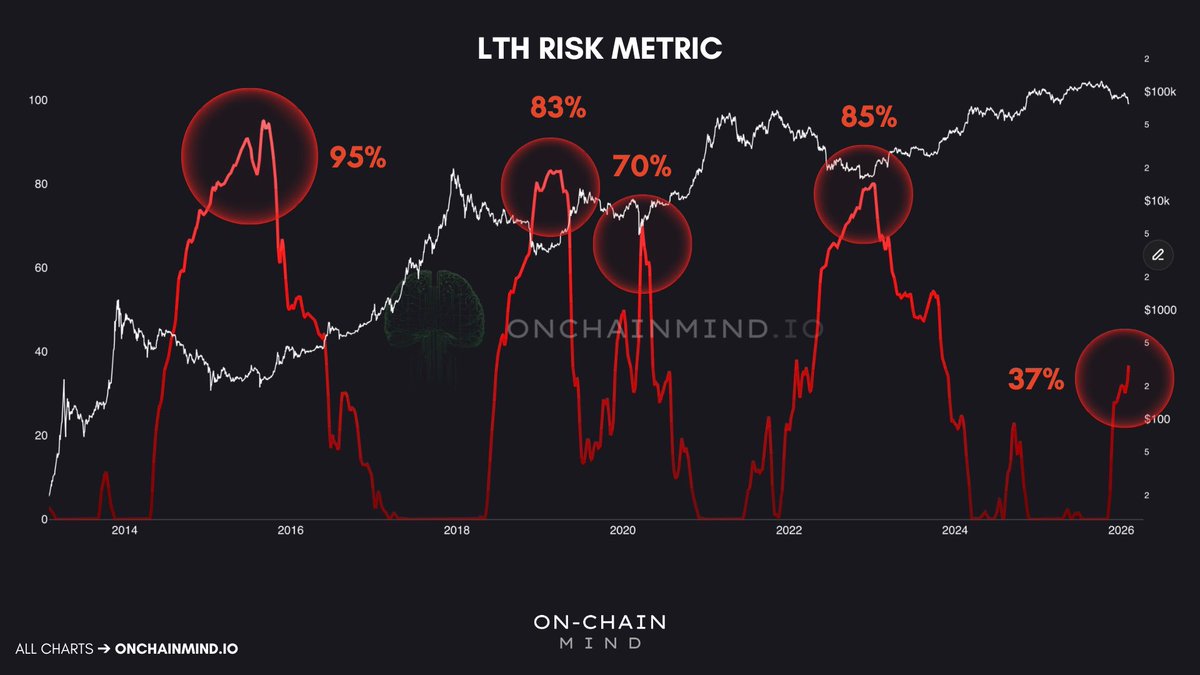
Once this indicator hits the 55-60% range, it’s like the final act of a Shakespearean tragedy-except instead of dying, everyone just sells. But right now, we’re at a mere 37%. So, is Bitcoin just having a bad hair day, or is this the calm before the storm? Only time (and probably more charts) will tell.
If history’s anything to go by, a move toward 70% would be like watching your favorite character get written off the show. Even the strongest hands would be shaking, and that’s when the market might finally hit rock bottom. Or, you know, just take a nap.
Bitcoin’s Weekly Drama: From Fab to Drab
Bitcoin’s weekly chart looks like it’s been through a breakup. Rejected from the $120K-$125K region (ouch), it’s now sulking around $69K. The 50-week and 100-week moving averages? Gone. Like last week’s leftovers. This isn’t a pullback; it’s a full-on existential crisis.

The 200-week moving average is still hanging back like the sensible friend who knows better. But those bearish candles? They’re screaming, “I’m a mess!” Volume spikes are just the cherry on top, confirming that everyone’s panicking and selling like it’s Black Friday at a sample sale.
Technically, $70K has gone from BFF to frenemy. If Bitcoin can’t claw its way back, we might be heading for the $60K bargain bin. But if it stabilizes and the sellers take a chill pill, maybe-just maybe-we’ll get a happy ending. Or at least a decent sequel.
Read More
- All Skyblazer Armor Locations in Crimson Desert
- How to Get the Sunset Reed Armor Set and Hollow Visage Sword in Crimson Desert
- All Shadow Armor Locations in Crimson Desert
- One Piece Chapter 1180 Release Date And Where To Read
- Marni Laser Helm Location & Upgrade in Crimson Desert
- All Helfryn Armor Locations in Crimson Desert
- All Golden Greed Armor Locations in Crimson Desert
- All Icewing Armor Locations in Crimson Desert
- How to Beat Stonewalker Antiquum at the Gate of Truth in Crimson Desert
- Legendary White Lion Necklace Location in Crimson Desert
2026-02-06 13:37