Ah, Bitcoin! On this fine day of February 17, 2026, it finds itself in quite the peculiar predicament, clinging to a price of $68,021 as if it were a hapless cat on a tree branch, oscillating between a meager $67,381 and an extravagant $69,999. With a staggering $36.58 billion in 24-hour trading volume and a market cap that could make even the most audacious venture capitalist blush at $1.37 trillion, this is no sleepy little market – nay, my dear friends, this is a dramatic pause before the tempest, a tantalizing dare for traders to overreact like a soap opera star caught in a scandalous love triangle.
Bitcoin Chart Outlook: A Comedy of Errors
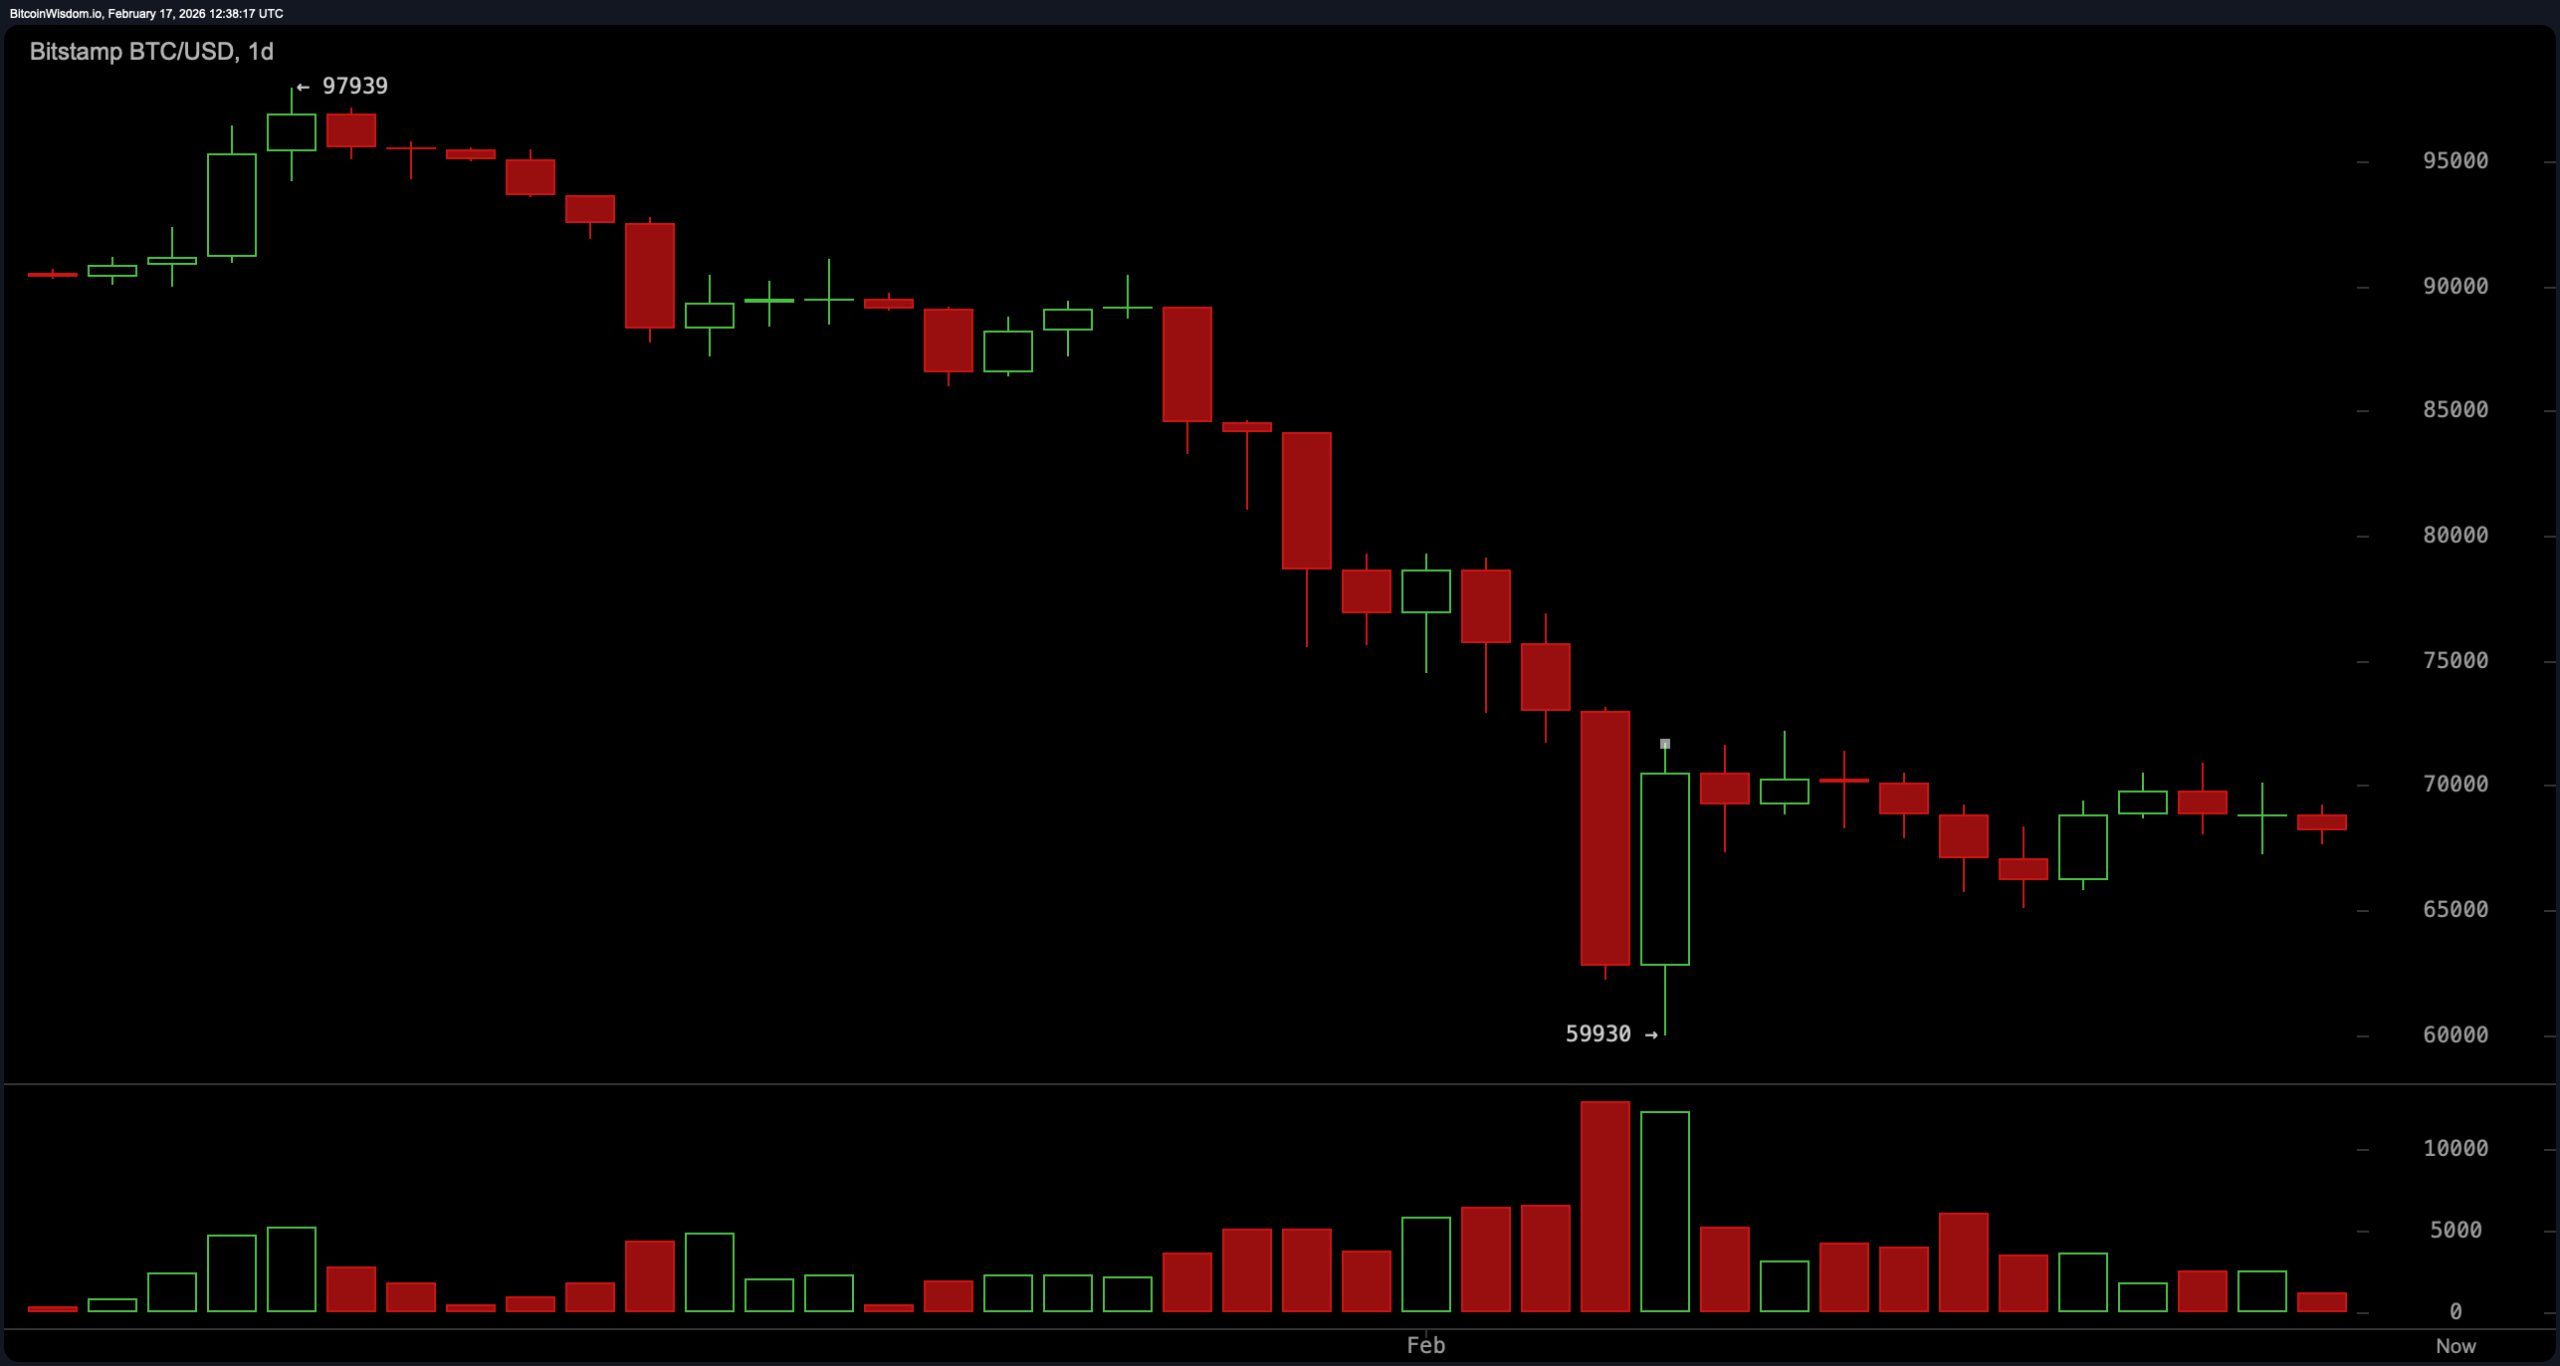
Behold the daily chart, a veritable tapestry woven with the threads of stabilization, albeit within a descending structure that resembles a sad clown at a carnival. The price remains stubbornly below its previous zenith of $97,900, dancing between $68,000 and $70,000 like a timid performer afraid of the spotlight. Major support, like an old friend with questionable advice, lurks between $60,000 and $62,000, while the intricate web of resistance lies above, between $72,000 and $75,000. Fear not! For only a valiant daily close above $75,000 will send our bearish woes packing. Until that glorious day arrives, we remain in cautious territory – digesting our options rather than igniting any wild celebrations.
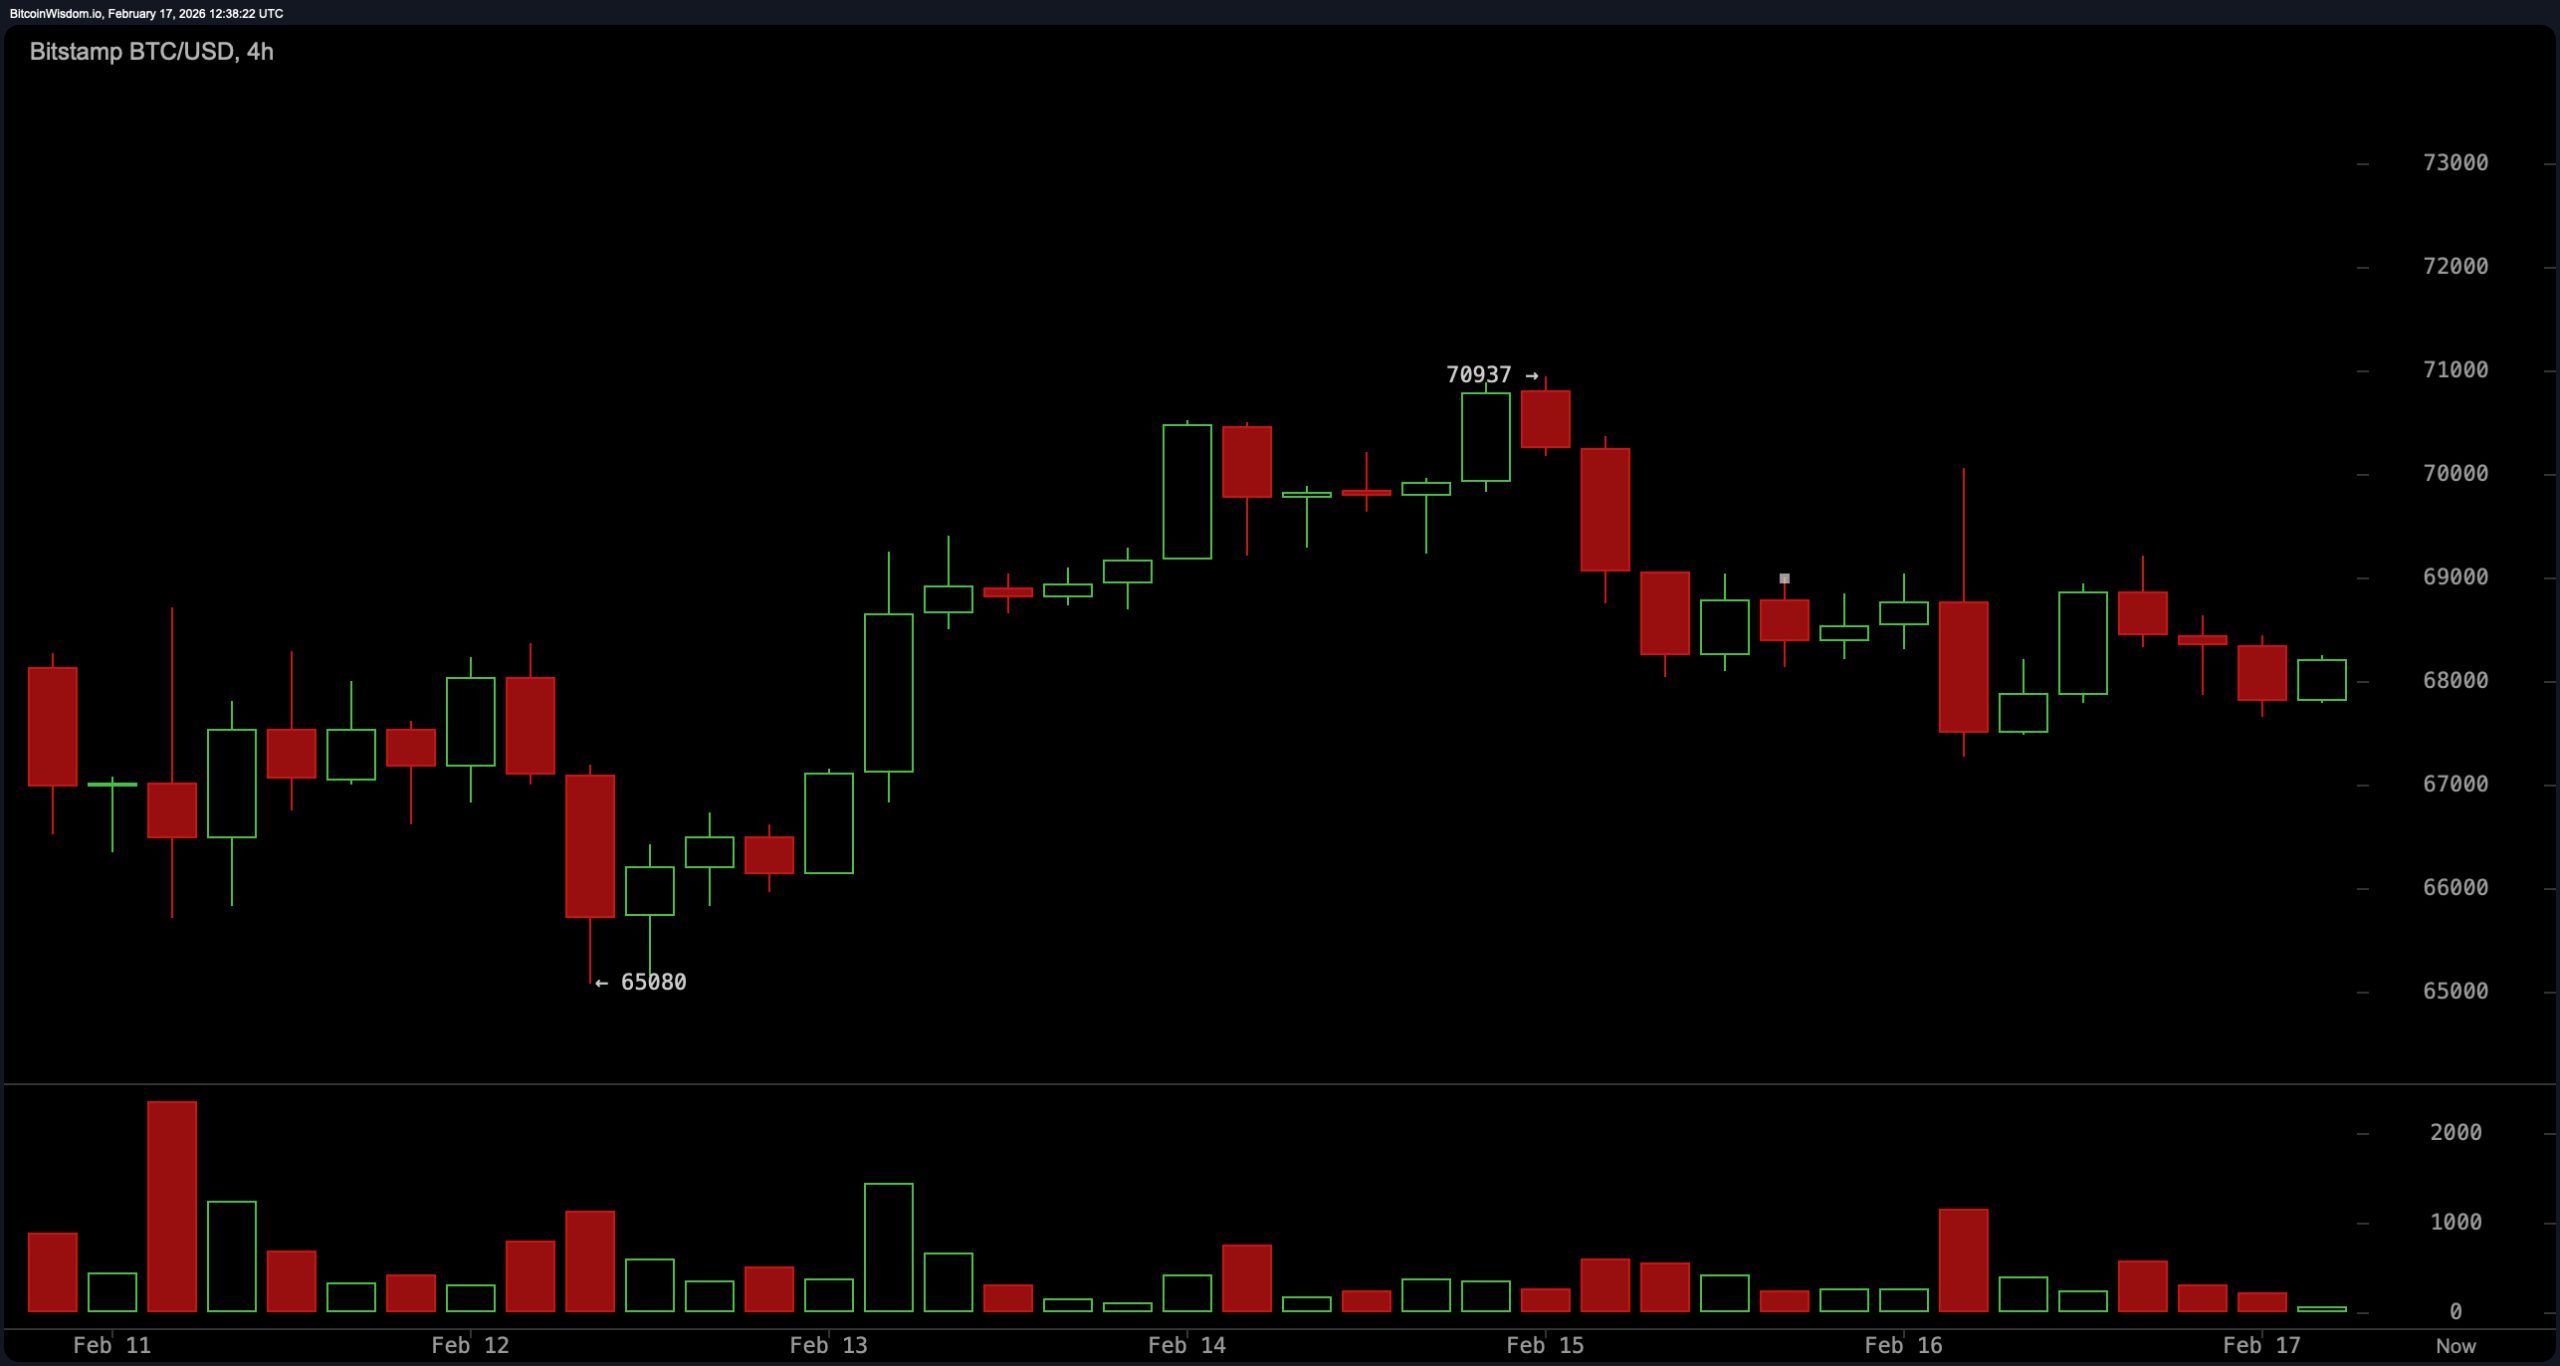
On the four-hour chart, Bitcoin is sauntering about within a predefined range, having just bounced back from the abyss of $60,000. A series of descending peaks are emerging like a bad haircut, compressing the price into a lateral consolidation tighter than a drum. Ah, but what’s this? Volume has taken a vacation during upward attempts, signaling a lack of conviction behind these tepid rallies. The trade zones are as clear as a sunny day: support hangs out between $66,500 and $68,000 while resistance takes a stand between $72,000 and $73,000. This, dear friends, is a playground for range traders – not a stage for breakout artists seeking their fame.
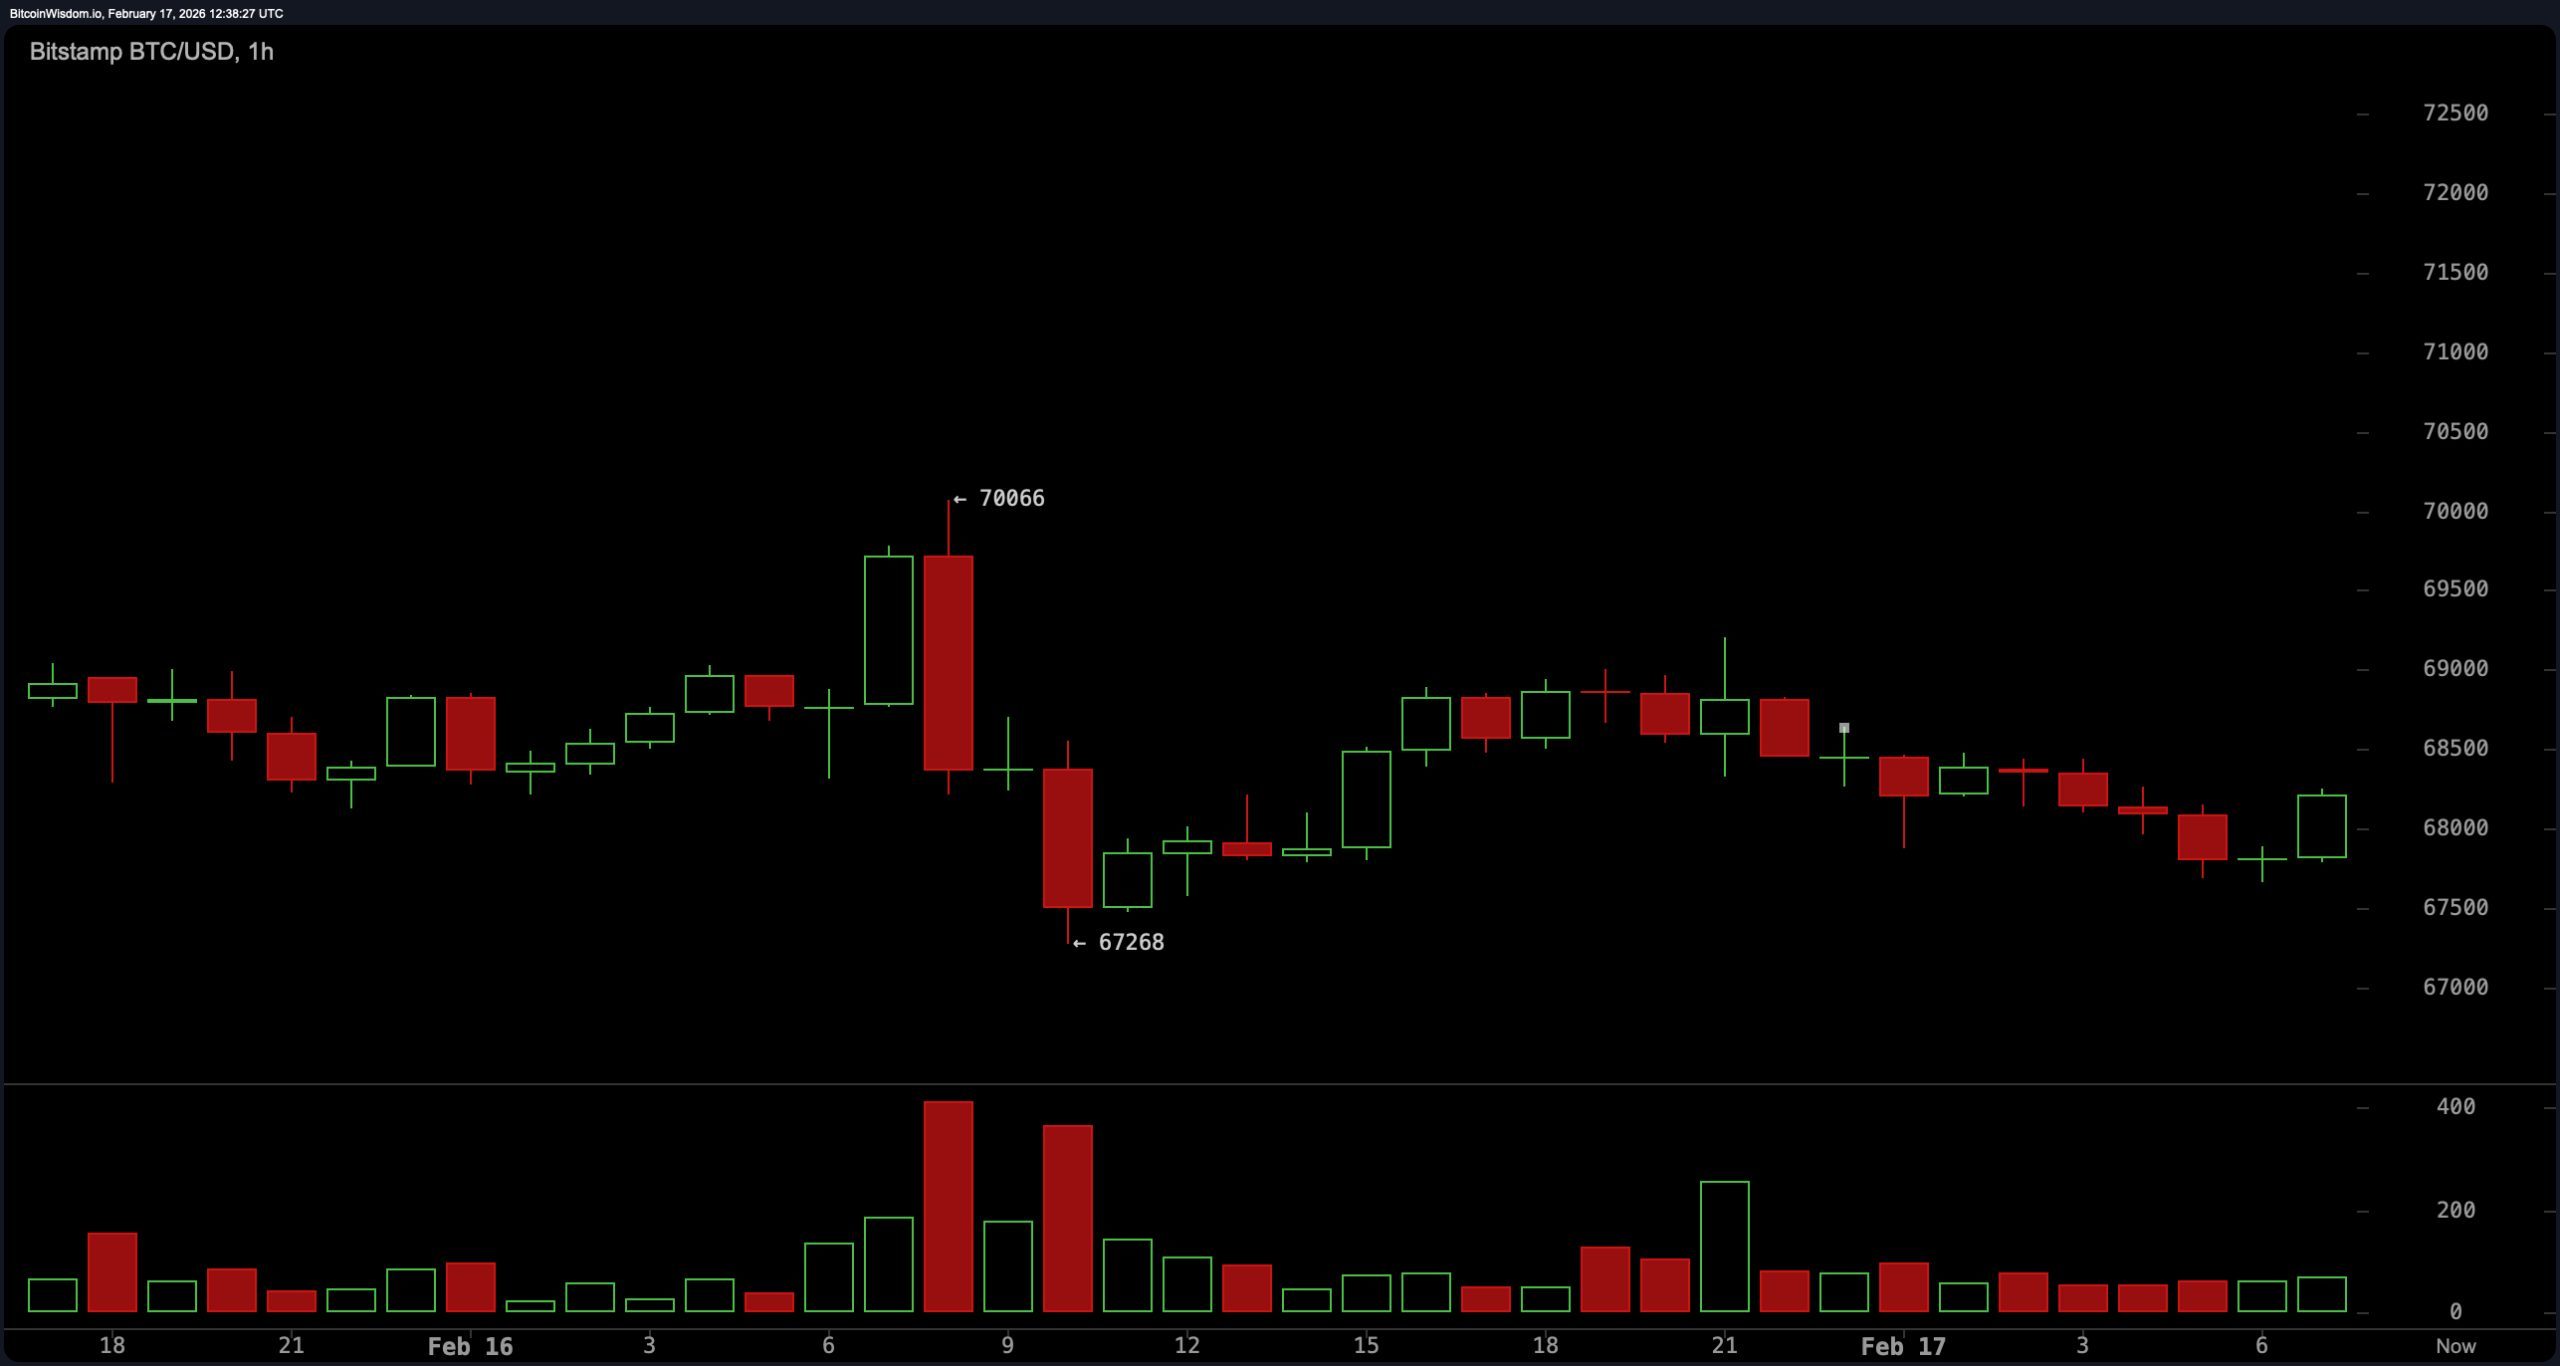
As we squint at the one-hour chart, it leans ever so softly towards despair. Descending peaks and marginal new lows paint a picture of short-term trend ennui, while momentum appears as lively as a sloth on a lazy afternoon. Recoveries have been more corrective than impulsive, reinforcing the notion that intraday strength lacks the stamina of a marathon runner. The $68,000 to $68,500 zone acts like a trampoline for bounces, while the ever-elusive recovery near $70,500 to $71,000 seems to attract pressure like a magnet for misfortune. Sellers reign supreme over intraday flows, and until this sequence of lower highs is disrupted, we tread lightly upon this fragile short-term structure.
Now, let us consult the oscillators, which reveal a market caught in equilibrium, rather than one of sheer exhaustion. The relative strength index ( RSI) at 36, Stochastic at 48, and commodity channel index (CCI) at a dismal negative 47 all offer neutral readings, much like a referee at a particularly dull match. Meanwhile, the average directional index (ADX) at 57 indicates strong trend conditions without a clue as to which way to turn. The Awesome oscillator, bless its heart, prints a negative 11,127, and momentum at negative 453 gives off vibes of constructive signals within this chaotic report. Internally, flickers of stabilization appear – but alas, no fireworks!
As we glance over the moving averages (MAs), they continue to loom heavy, casting shadows over our hopes. The exponential moving average (EMA) (10) at $69,519 stands defiantly against the simple moving average (SMA) (10) at $68,739. The EMA (20) at $72,810 and SMA (20) at $72,074 reinforce the overhead resistance, while the EMA (50) at $80,180 and SMA (50) at $83,491 float far above like distant stars in a night sky. Higher still, the EMA (100) at $87,067 and SMA (100) at $86,987, along with the EMA (200) at $93,608 and SMA (200) at $100,105, underline the technical gravity that Bitcoin must eventually overcome. It’s a formidable task, akin to moving a mountain with a spoon.
Bull Verdict:
A decisive four-hour close above $72,500 with expanding participation would shift the short- and mid-term structure, opening the door toward the $72,000 to $75,000 resistance corridor and challenging the descending framework on the daily chart. Sustained strength above $75,000 would invalidate the broader bearish structure and signal that compression has resolved to the upside. In short, the bulls would be throwing a grand festival!
Bear Verdict:
A breach of $66,000 would confirm weakening support on the lower time frames and expose Bitcoin to a move back toward the $60,000 to $62,000 major support zone. Failure to defend that corridor would reinforce the prevailing descending formation on the daily chart, prolonging our current corrective phase rather than concluding it. Oh, what a tragedy!
FAQ ❓
- What is Bitcoin’s price on Feb. 17, 2026? Bitcoin is trading at a mere $68,827.93, consolidating in the space between the wise old support of $66,500 and the lofty heights of $72,000.
- Is Bitcoin bullish or bearish right now? Our beloved Bitcoin remains trapped in a range-bound existence within a descending structure, holding a cautious bias until it either breaks above $75,000 or sinks below $66,000. Such drama!
- What are the key bitcoin support and resistance levels? Major support resides in the cozy embrace of $60,000 to $62,000, while major resistance stands tall between $72,000 and $75,000, like a guard at a castle gate.
- What would confirm bitcoin’s next breakout? A strong four-hour close above $72,500 or a breakdown below $66,000 would signal the next directional move, perhaps worthy of a standing ovation.
Read More
- Quantum Agents: Scaling Reinforcement Learning with Distributed Quantum Computing
- Boruto: Two Blue Vortex Chapter 33 Preview — The Final Battle Vs Mamushi Begins
- All Skyblazer Armor Locations in Crimson Desert
- Every Melee and Ranged Weapon in Windrose
- How to Get the Sunset Reed Armor Set and Hollow Visage Sword in Crimson Desert
- One Piece Chapter 1180 Release Date And Where To Read
- New Avatar: The Last Airbender Movie Leaked Online
- USD RUB PREDICTION
- Zhuang Fangyi Build In Arknights Endfield
- All Shadow Armor Locations in Crimson Desert
2026-02-17 16:27