So, Bitcoin’s hanging out at $66,759 on March 29, 2026, at 9 a.m. Eastern time. Big whoop. It’s basically doing the crypto equivalent of scrolling through Instagram-stuck in a 24-hour range of $66,266 to $67,185. Meanwhile, its price is cozying up to short-term support like it’s a couch cushion, and the technical signals are as indecisive as a Libra at a buffet. Market cap? $1.33 trillion. Volume? $23.11 billion. Basically, everyone’s here but no one’s committing.
Bitcoin Chart Outlook (Or: What’s This Blob Doing?)
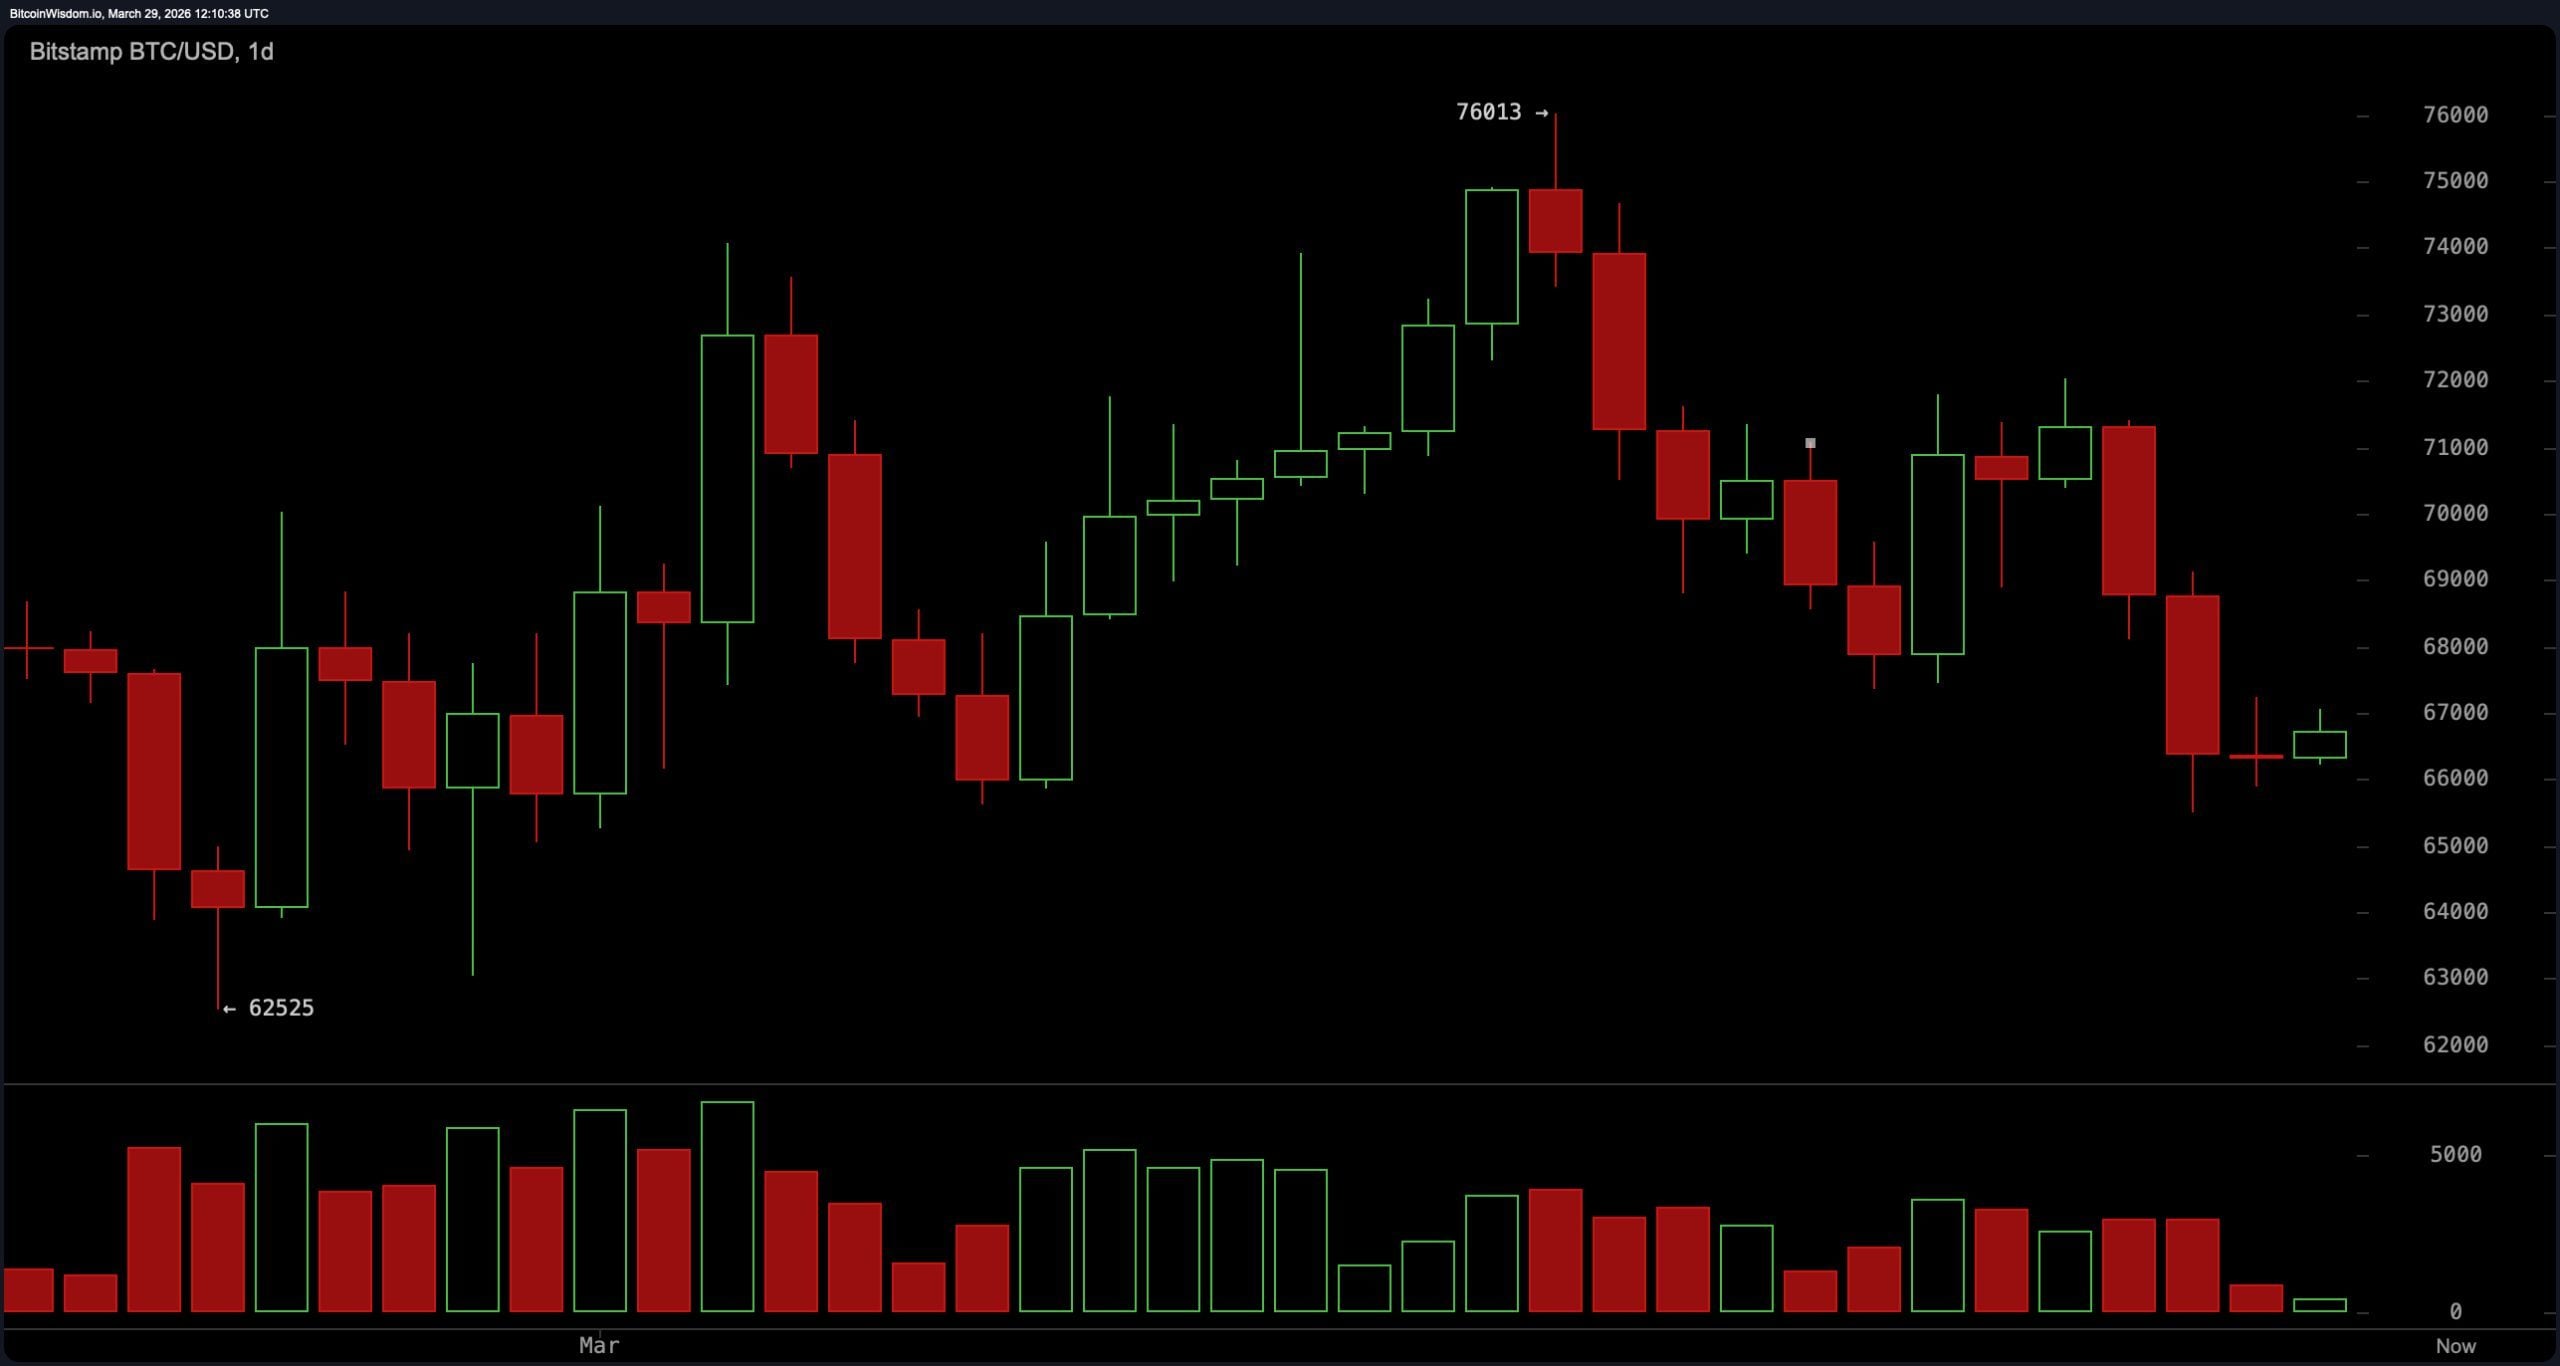
On the daily chart, Bitcoin’s structure is weaker than a decaf latte after a rejection near $76,000. It’s now chilling in the $66,000-$67,000 zone, which is basically its safety blanket. Volume during the decline? Higher than a kite, suggesting distribution instead of a casual pullback. So, yeah, bearish-neutral vibes. To get exciting again, it needs to hit $70,000-otherwise, it’s looking at a date with $65,000 or even $62,500. Fun.
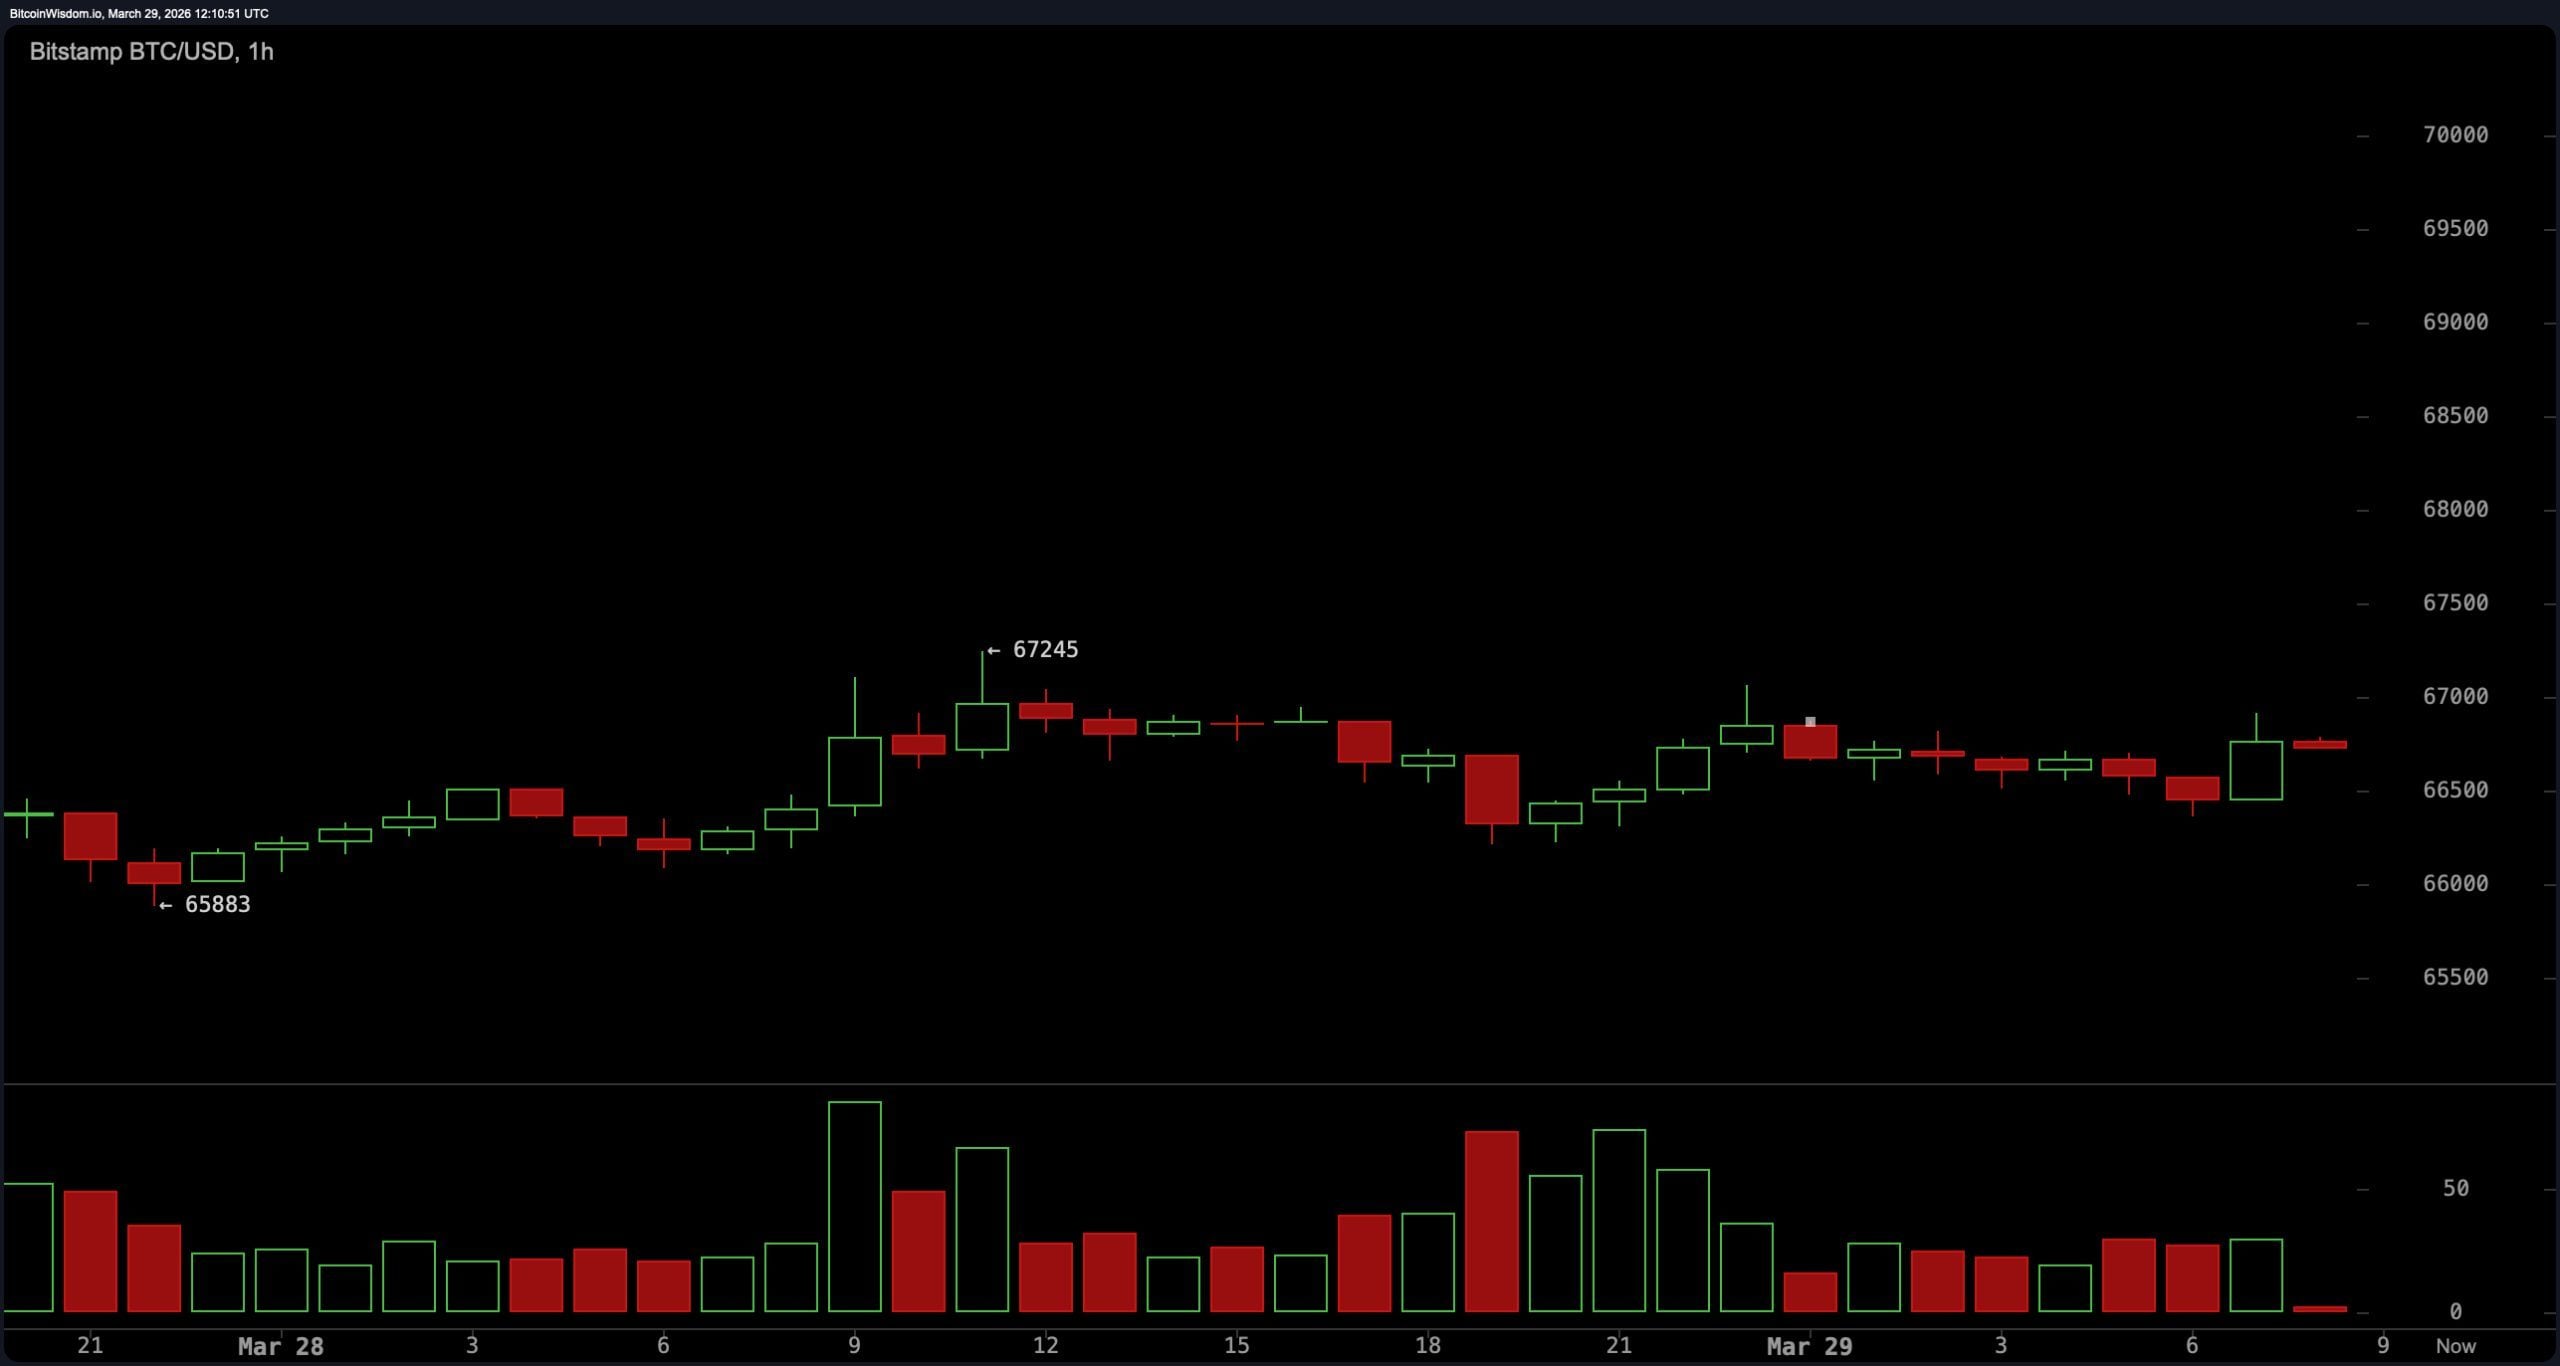
On the 1-hour chart, Bitcoin’s in a consolidation range tighter than skinny jeans after Thanksgiving. Tiny candles, shrinking volume-basically, it’s napping. Support’s at $65,800-$66,000, and resistance is capping it at $67,000-$67,500. Breakout potential? Sure. Direction? Who knows. It’s like asking a toddler where they’re going when they’re just spinning in circles.
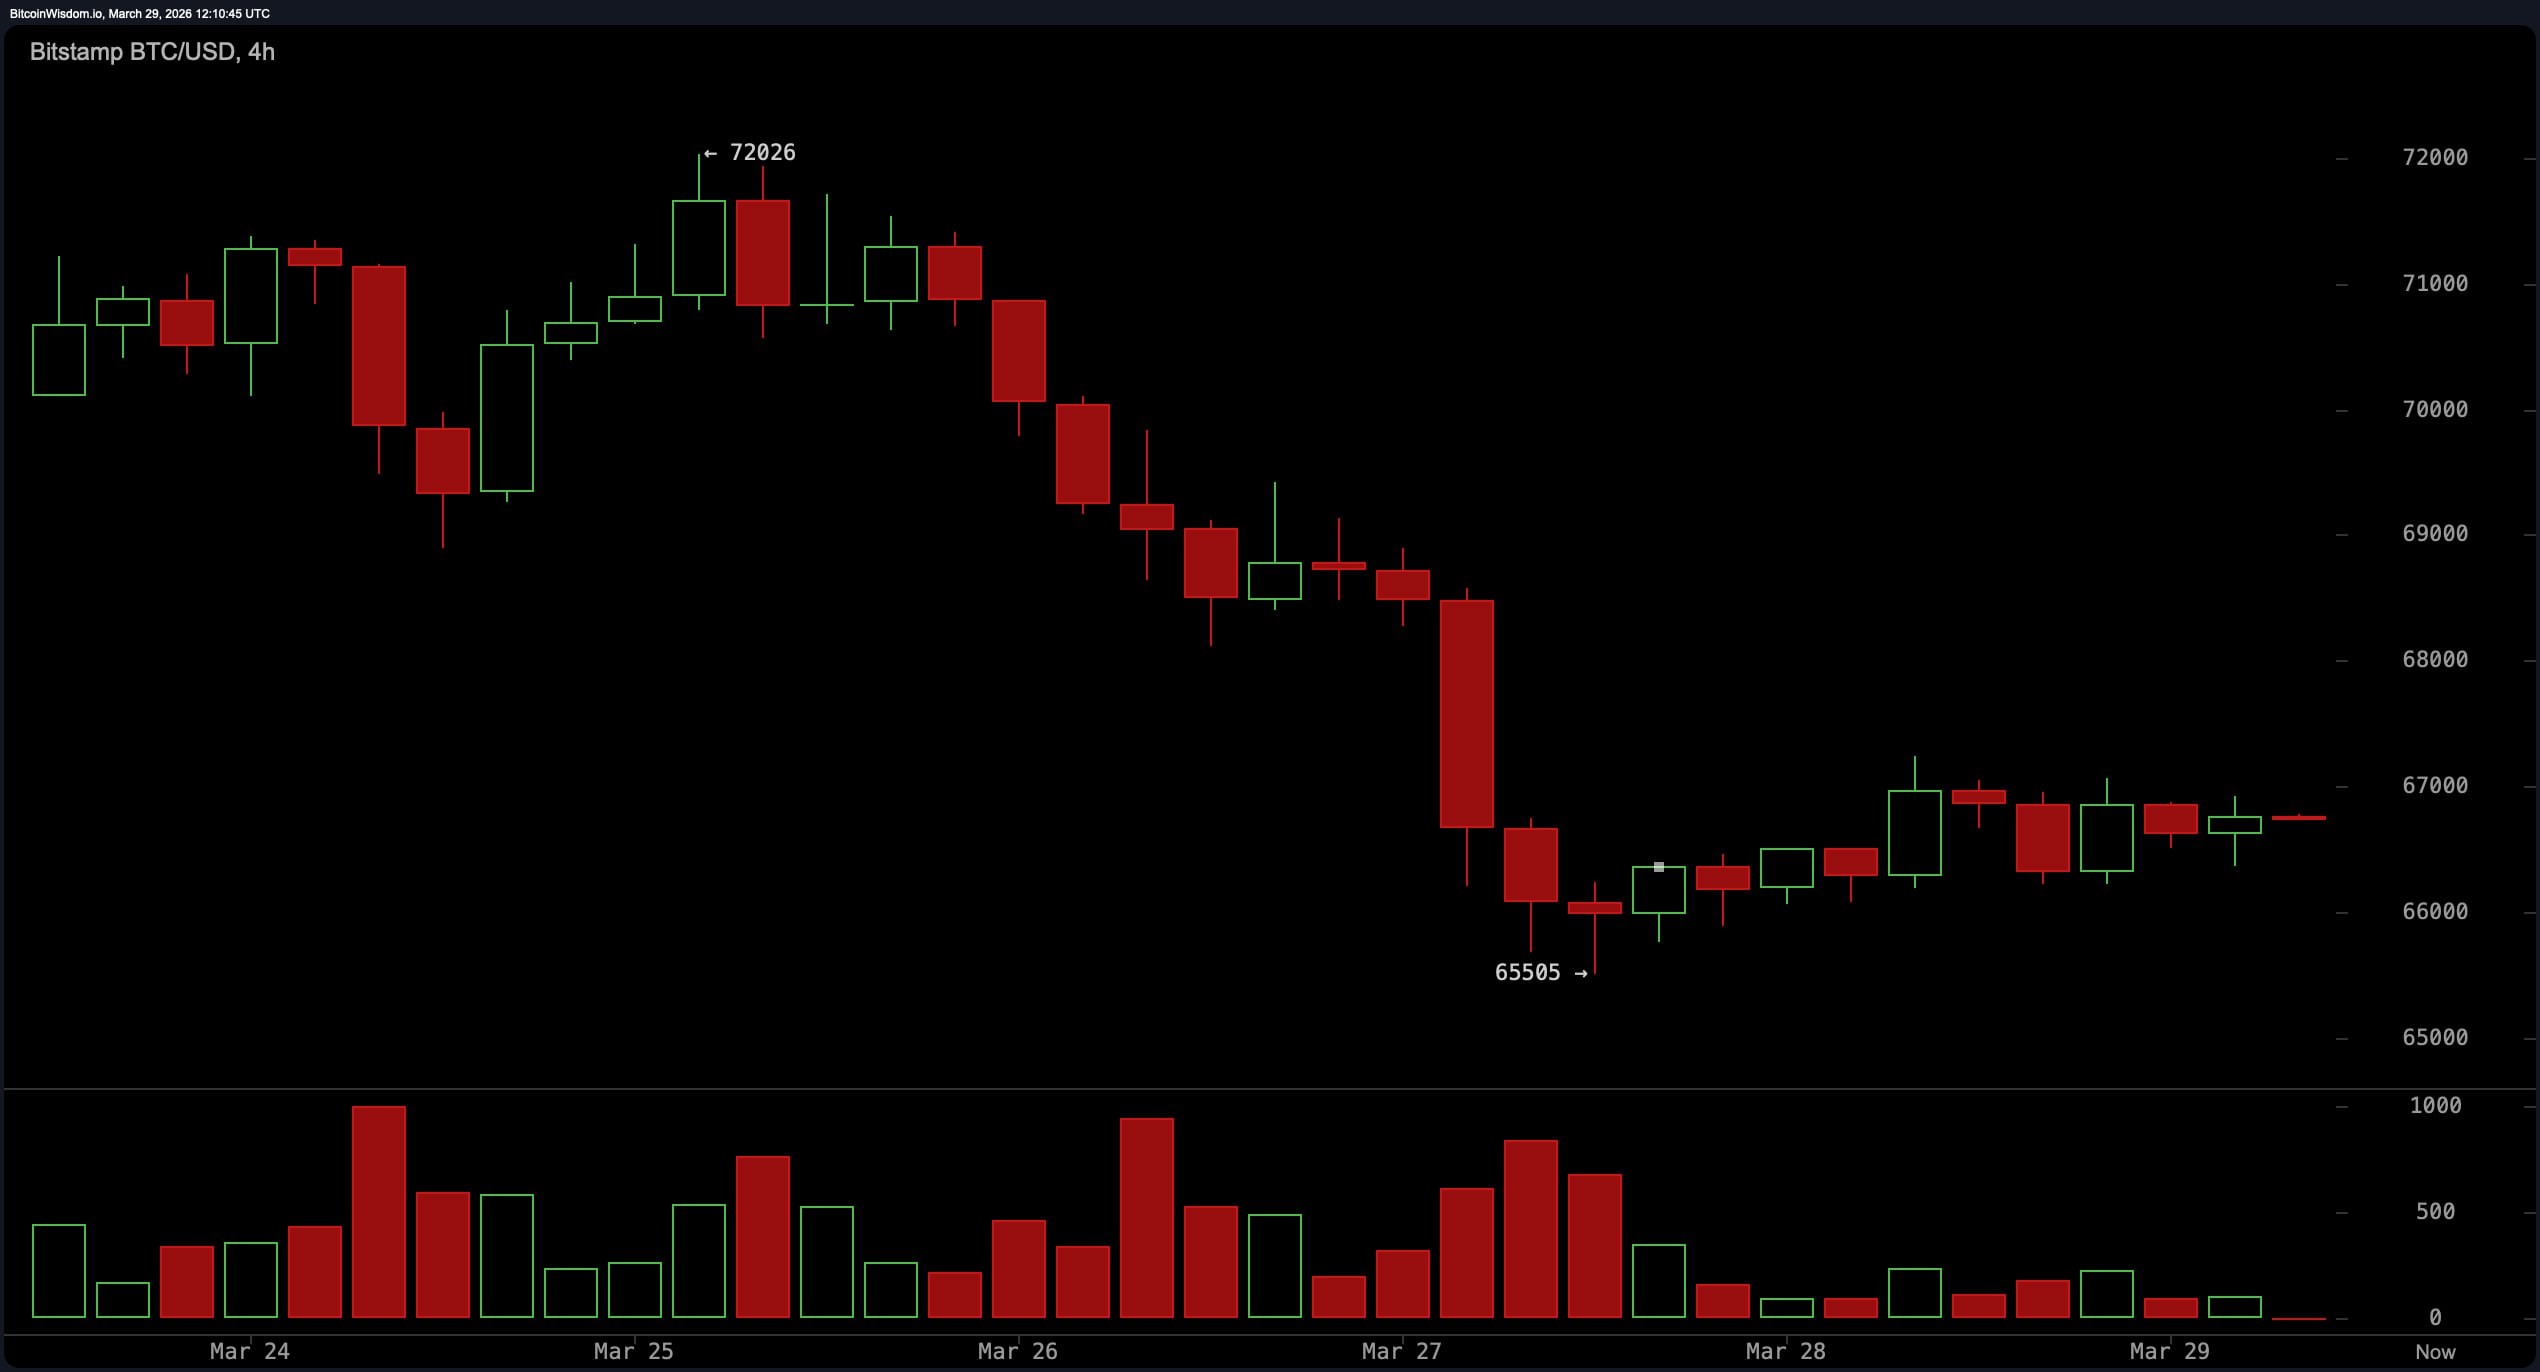
On the 4-hour chart, Bitcoin’s gone from “selloff” to “let’s just sit here and think about our life choices.” It’s bouncing between $65,500 and $67,500-$68,000. Momentum’s stabilizing, but it’s like watching paint dry. Market’s paused, waiting for something-anything-to happen. Exciting.
Oscillators are like a group chat where no one agrees. RSI’s at 42-basically shrugging. Stochastic’s at 9, flirting with oversold but not committing. CCI’s at −158, screaming “downside!” but no one’s listening. Momentum’s at −3,157, which is… something. Meanwhile, ADX is at 16, saying, “Trend? What trend?” and MACD’s at −721, still bearish. It’s a mess.
Moving averages are like that friend who always shows up late-they’re above the price, reminding Bitcoin it’s behind. 10 EMA’s at $68,534, 10 SMA’s at $68,817. Medium-term resistance? $69,230 and $70,192. Long-term? $77,137 and $91,072. Basically, Bitcoin’s got a lot of catching up to do.
Bull Verdict: (Or: Hopium for the Masses)
Bitcoin’s cozy near support, and some oscillators are like, “Hey, maybe a rebound?” If it holds above $65,000-$66,000 and breaks $67,500-$70,000, it could bounce back. ADX says trend strength’s weak, so maybe it’s just tired, not dead.
Bear Verdict: (Or: Reality Check)
Bitcoin’s below all major moving averages, which is like being stuck in a swamp. MACD’s still bearish, and it can’t even reclaim key resistance levels. So, yeah, downside’s still the vibe. $65,000’s in danger, and lower support zones are waiting like a trap.
FAQ 🔎 (Or: Questions You Were Too Afraid to Ask)
- What was Bitcoin’s price on March 29, 2026?
Bitcoin was $66,759.93, in a 24-hour range of $66,266.04 to $67,185.75. Thrilling. - Is Bitcoin in an uptrend or downtrend?
Downtrend. It’s like it forgot how to go up. - What do Bitcoin’s indicators show?
Mixed. Like a salad bar with no dressing. - Key price levels to watch?
Support at $65,000, resistance at $67,500-$70,000. Good luck.
Read More
- All Shadow Armor Locations in Crimson Desert
- Dark Marksman Armor Locations in Crimson Desert
- Jujutsu Kaisen Season 3 Episode 12 Release Date
- How to Get the Sunset Reed Armor Set and Hollow Visage Sword in Crimson Desert
- Keeping AI Agents on Track: A New Approach to Reliable Action
- How to Beat Antumbra’s Sword (Sanctum of Absolution) in Crimson Desert
- Top 5 Militaristic Civs in Civilization 7
- How To Beat Ator Archon of Antumbra In Crimson Desert
- Best Bows in Crimson Desert
- Sakuga: The Hidden Art Driving Anime’s Stunning Visual Revolution!
2026-03-29 16:27