XRP is currently trading around $1.32, and its weekly Relative Strength Index (RSI) is at 32. Traders are keeping an eye on the $1.30 level as potential support and $1.42 as resistance to see if the current trend will continue.
XRP price traded near $1.32 as market watchers focused on a weak weekly RSI reading.
The indicator is currently around 32 on the weekly chart, a level that has historically coincided with the bottom of XRP price cycles. Because of this, traders are interested in seeing if the token is establishing a stable base for future growth.
Read also:
XRP Whale Drops $35M Amid Divided Sentiment
Weekly RSI Sees XRP Tests a Key Area
The weekly RSI has moved into a zone many traders call oversold.
When looking at longer-term charts, these patterns often grab traders’ attention. Historically, XRP has shown similar signals after periods of falling prices, which were then followed by extended periods where the price remained relatively stable.
However, the RSI by itself isn’t enough to signal that a market has hit its lowest point. Prices can continue to fall even when the RSI is already showing low levels.
Because of this, traders are also paying attention to support levels and how the week closes. They’re looking for signs that the recent selling is slowing down.
Weekly RSI on just hit one of its lowest levels in years.
Currently, the weekly Relative Strength Index (RSI) is around 32, which indicates XRP is deeply oversold – meaning it may be undervalued. Historically, when the weekly RSI has reached this low a level, it often signaled that XRP was about to enter a period of significant buying and price increase.
Price…
— Arthur (@XrpArthur)
Currently, XRP is trading around $1.32, which is an important price level to watch. This area acts as a key support level, and if buyers can maintain this price, it could signal the start of a price increase.
If support breaks, the bottom call may lose strength.
Daily Chart Keeps the Broader Structure Under Pressure
The daily chart still shows a bearish medium-term structure.
Following a rise to $2.416, XRP started to show a pattern of decreasing peaks, which often suggests that buyers are losing strength. Since then, the price has decreased and settled into a small trading range.
As an analyst, I’m watching the $1.30 to $1.32 range closely. XRP is currently trading right around that level, and it’s a critical moment – we’re likely to see a breakout or a bounce soon.
If the price falls below this level each day, it could drop further to around $1.24 and then $1.20. The lowest price seen in February, around $1.118, is a key level to watch as a potential low point.
The price is finding some support around $1.42 and $1.43, which also happens to be near a key technical level based on Fibonacci retracement at $1.4247.
Traders are also keeping an eye on price levels of $1.50, $1.614, and $1.767. As long as XRP stays below $1.42, the price is likely to continue facing downward pressure.
Momentum Signals Remain Weak Despite the RSI Setup
The daily chart continues to suggest a lack of strong upward movement. The MACD indicator is still negative, meaning buyers aren’t currently leading the market and price increases are likely to be restricted.
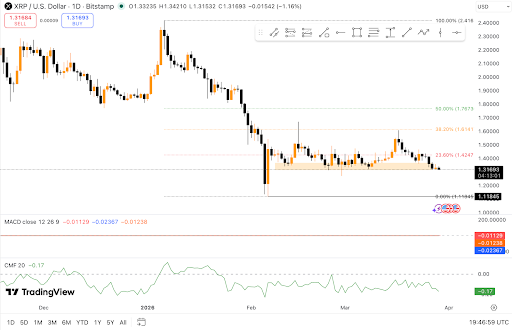
Currently, the Chaikin Money Flow is around -0.17, which suggests that money is flowing out of the market and selling pressure is consistent.
Although the weekly Relative Strength Index suggests the market might be overbought, short-term indicators aren’t showing clear signs of a downturn. This results in an uncertain outlook for the market right now.
The price movement of XRP suggests a need for caution. It’s been trading within a small range, between $1.30 and $1.45. Every time the price has tried to go higher, it’s been pushed back down, indicating that sellers remain strong even during temporary increases.
Related Reading:
XRP Price Prediction: Key $1.30–$1.05 Fib Zone Decides Next Move
Market Watches for Confirmation Above Resistance or Below Support
For now, traders are focused on two near-term paths.
If XRP can maintain its current support level and rise above $1.42, it could potentially reach $1.50 and then $1.61. However, achieving this requires a significant increase in buying activity and stronger overall market movement, which would also strengthen its short-term trend.
If the price falls below $1.30, the outlook could shift. This might lead to a further decline towards $1.20, and potentially even to the $1.118 low. Reaching that level would suggest that the recent low may not be the bottom.
At present, XRP price holds $1.32 while the weekly RSI keeps bottom talk active.
The market hasn’t shown a clear sign of turning around yet. While prices are still supported at their current level, they lack strong upward movement. This leaves things uncertain – the market could either stabilize or continue to fall.
Read More
- All Shadow Armor Locations in Crimson Desert
- Jujutsu Kaisen Season 3 Episode 12 Release Date
- Dark Marksman Armor Locations in Crimson Desert
- How to Get the Sunset Reed Armor Set and Hollow Visage Sword in Crimson Desert
- Best Bows in Crimson Desert
- Wings of Iron Walkthrough in Crimson Desert
- How To Beat Ator Archon of Antumbra In Crimson Desert
- All Golden Greed Armor Locations in Crimson Desert
- Keeping AI Agents on Track: A New Approach to Reliable Action
- Top 5 Militaristic Civs in Civilization 7
2026-03-30 08:05