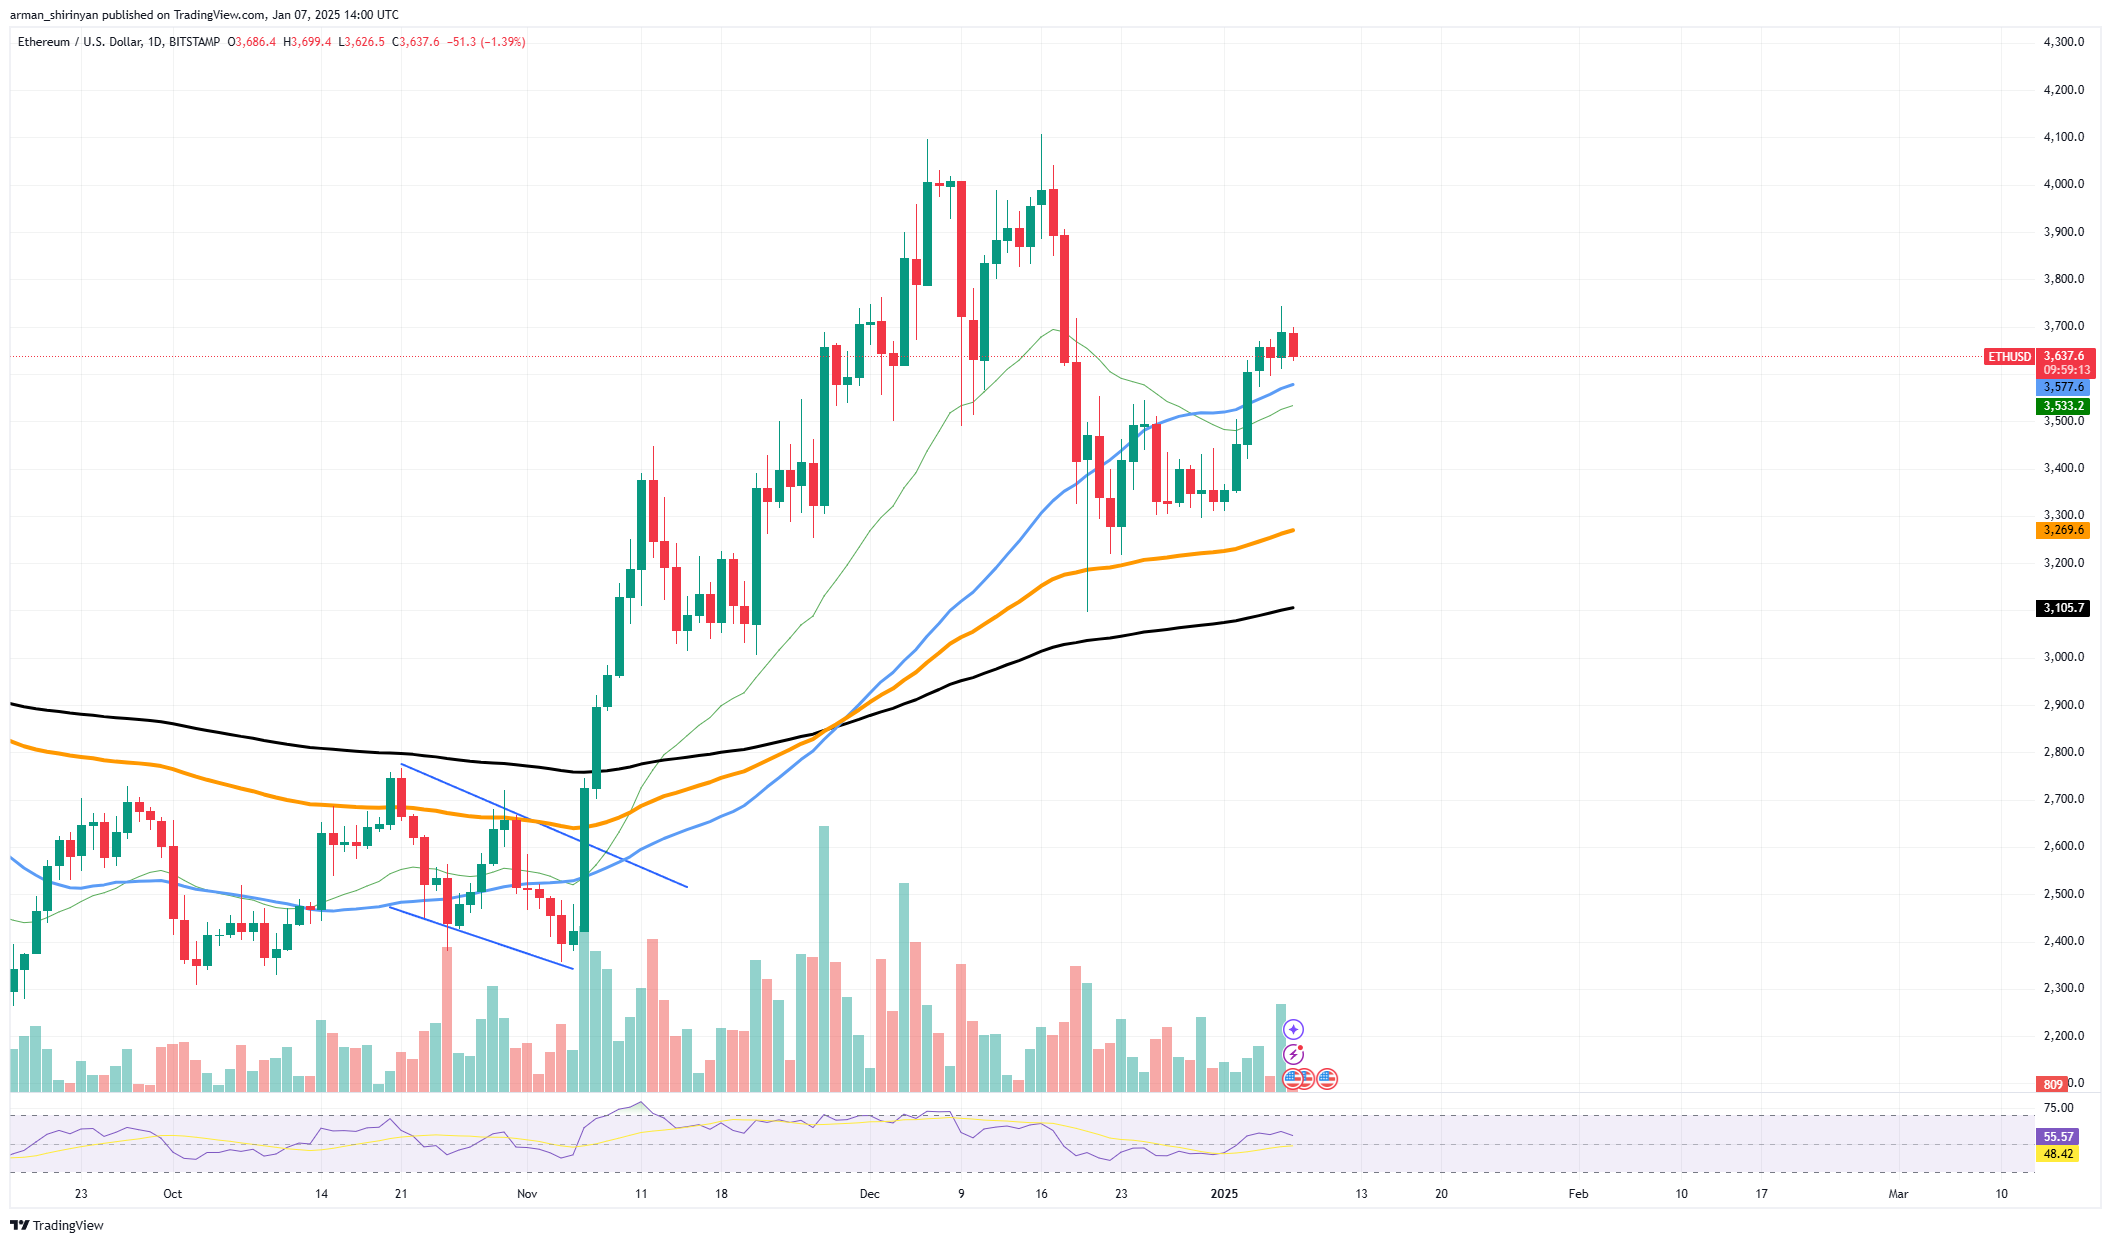
Lately, the trading activity surrounding Ethereum, the second most valuable cryptocurrency, has noticeably escalated. This surge in activity suggests that more traders and investors are becoming actively involved. Despite a recent decrease in ETH‘s price, signs point towards a potential rebound and even another price surge ahead.
Currently priced at approximately $3,632, Ethereum recently surpassed its significant 50-day moving average (EMA), a level often seen as strong resistance. When this barrier is broken, it typically signals a positive outlook for the asset. Moreover, the daily chart of Ethereum has become more bullish due to consistent support above the 26 EMA.

Keeping these technical benchmarks could potentially set the stage for an upward trend aiming at the potential resistance area around $3,800, making them crucial for traders to watch. A surge in investment seems to be directed towards Ethereum, as suggested by the increase in trading activity, a clear sign of heightened market attention.
Regarding the Relative Strength Index (RSI), it currently hovers around the neutral point of 55, even with an increase in volume. This neutral position is noteworthy as it suggests Ethereum may continue to rise without approaching an overly bullish state. At the current price of $3,500, Ethereum has a robust foundation for potential growth below it. This level is fortified by the 26 Exponential Moving Average (EMA) and recent surges in buying activity. If this support level remains strong, it could provide a solid base for further upward momentum.
If Ethereum doesn’t hold onto its current support at around $3,300, it could potentially revert back to this level due to the 100 EMA acting as an extra safety net. The general feeling towards Ethereum in the market remains optimistic but cautious. Many traders are anticipating a bullish trend given the increased trading activity. However, for Ethereum to confirm its upward momentum, it needs to convincingly breach the $3,800 mark first. If successful, Ethereum could encounter the next substantial resistance at around $4,000 and potentially beyond.
Shiba Inu gets pressured
Right now, Shiba Inu is going through a challenging period in the market. It’s finding itself sandwiched between significant support and resistance levels, and as of now, it’s trading at approximately $0.00002375. This digital asset has been stuck in a narrow band of price action that could influence its immediate future, as there have been no substantial price changes in the recent trading sessions.
At approximately $0.000025, Shib is hovering slightly beneath its 50-day exponential moving average (EMA). This level, acting as a cap for Shib’s price fluctuations, has proven tough to surpass. Conversely, the 100-day EMA at $0.00002220 has been an essential cushion preventing any further declines. As a result, Shib currently exhibits a narrow trading range, and investors are closely monitoring its upcoming action.
Without definite directions, it’s evident that investors are uncertain about SHIB‘s short-term potential, as suggested by the current market stagnation. A significant decrease in trading activity is one of the major hurdles SHIB is currently grappling with. This reduction in activity might make it difficult for the asset to break free from its existing price range due to the lack of substantial buying or selling pressure, as indicated by this downtrend. Moreover, the Relative Strength Index (RSI), a tool that gauges market momentum without overt bullish or bearish bias, is hovering around 49, indicating a neutral stance in the market.
Facing a significant decision point, a Shiba Inu now stands at the brink of two critical choices that may shape its path for the near future. The volatile nature of SHIB’s price movement might continue to be uncertain and unforeseeable until it manages to break free from this price range.
Since a breakthrough at either the $0.00002220 support or the $0.000025 resistance could influence SHIB’s next major price movement, it’s crucial for traders to closely monitor these two levels.
Solana needs more
Lately, Solana has managed to break past a substantial downward trendline, implying that its price movement could potentially reverse. However, the asset struggles to surpass the significant resistance of its 50-day exponential moving average (EMA), currently sitting at $218, despite this optimistic technical indication.
As a crypto investor, I’ve noticed that Solana (SOL) has been stuck in a bearish pattern for quite some time now, with the descending trendline acting as a barrier or resistance. Normally, breaking through this line suggests bullish sentiments and could potentially lead to upward momentum. However, the recent break above this line hasn’t been backed by enough buying pressure or trading volume.
If Solana manages to surmount its next challenge, the 50 Exponential Moving Average (EMA), it could pave the way for a rally towards the next resistance level at $240. But until then, I’m keeping a close eye on the market and the trading volume to see if Solana can truly break free from its current pattern.
On the downside, the 26 Exponential Moving Average (EMA) provides a solid foundation for Solana at approximately $200. However, if this support isn’t upheld, the asset might drop to the $178 level where the 100 EMA offers additional support. This could fan bearish sentiments once more. The lack of substantial trading volume during this trendline breakout is a worrying sign. If trading activity doesn’t pick up significantly, the longevity of this move remains uncertain.
Read More
- EUR MYR PREDICTION
- VANRY PREDICTION. VANRY cryptocurrency
- EUR CAD PREDICTION
- GBP RUB PREDICTION
- LUNC PREDICTION. LUNC cryptocurrency
- USD MXN PREDICTION
- BTC PREDICTION. BTC cryptocurrency
- USD DKK PREDICTION
- CTXC PREDICTION. CTXC cryptocurrency
- XRP PREDICTION. XRP cryptocurrency
2025-01-08 03:06