The Best Debut Horror Game Of 2023 Is Getting a Movie Next Year
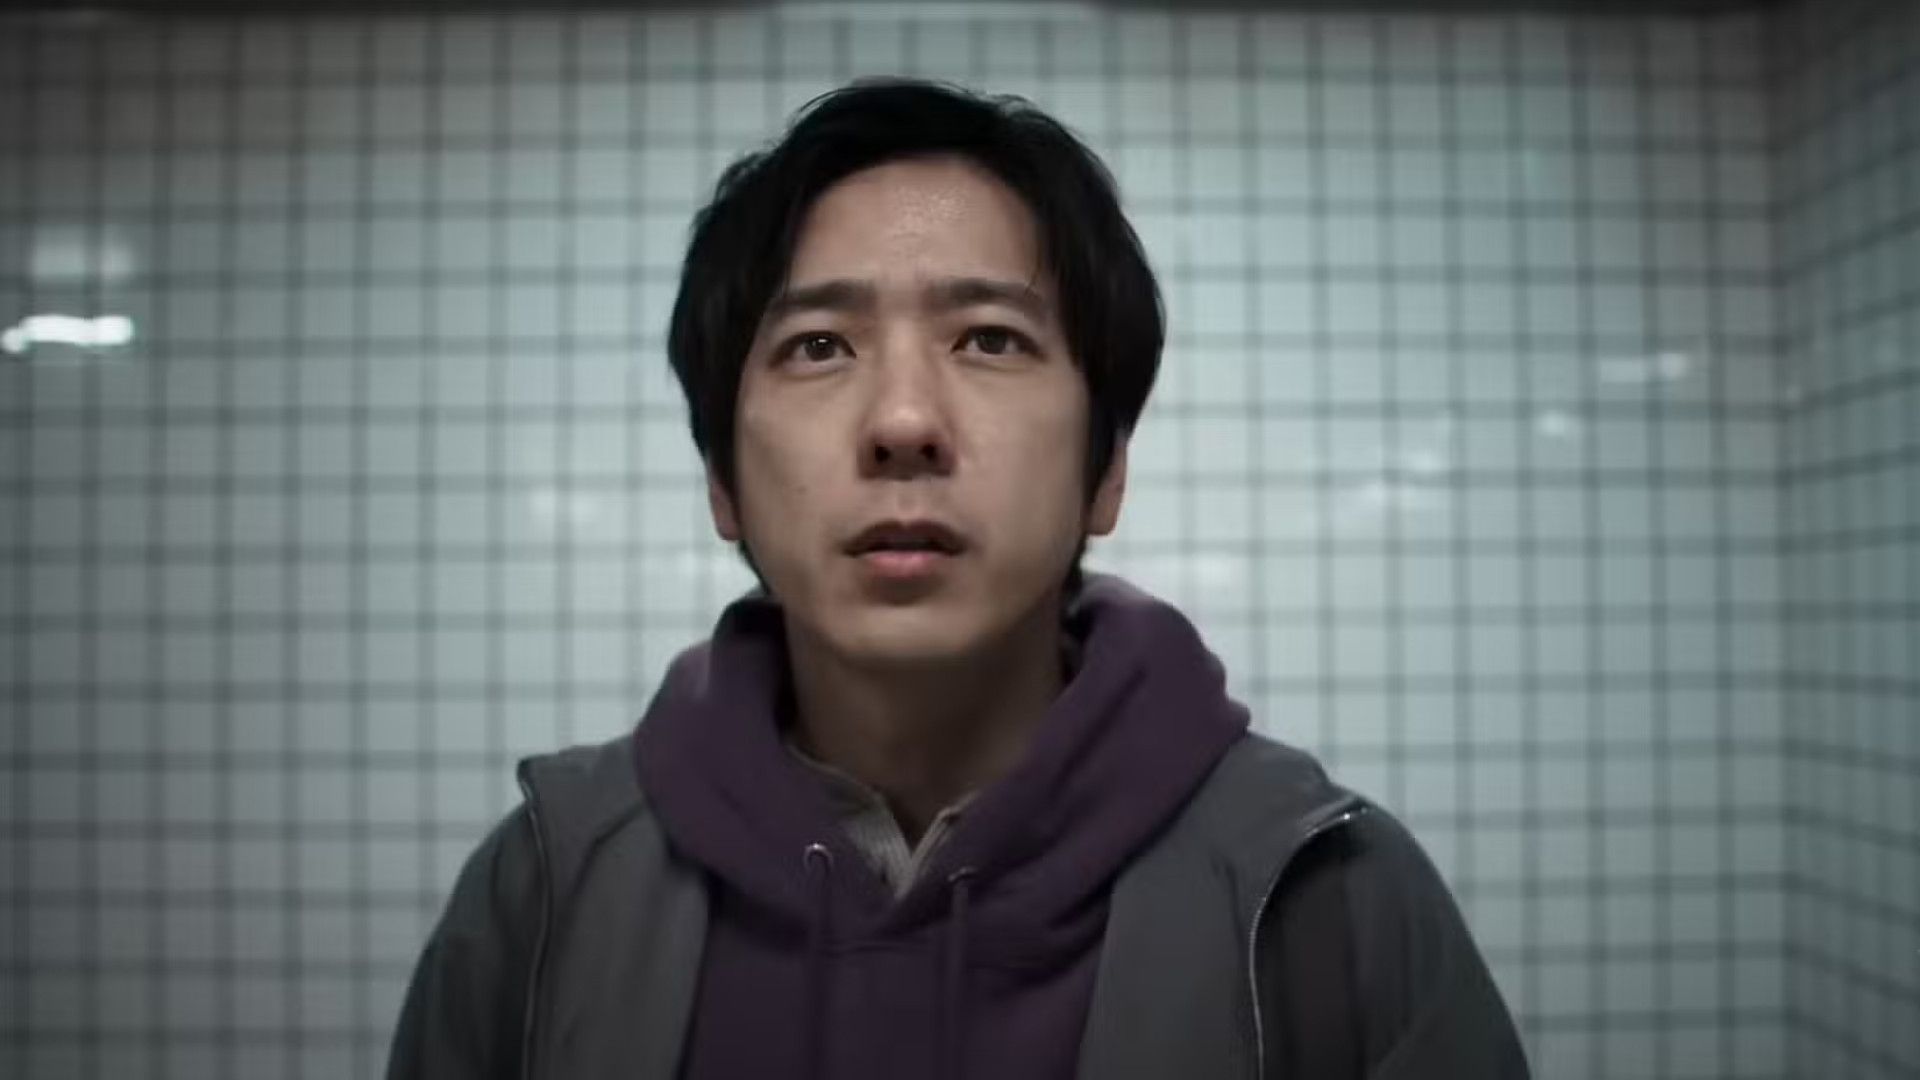
Even though The Exit 8 is a “walking simulator” – a game focused on exploration rather than action – and generally less visually dramatic than something like The Last of Us, it actually lends itself well to a film adaptation. The game is strange and open to interpretation, putting you in the role of a man trying to escape a Tokyo subway station. This simple idea plays out as a repeating series of hallways, similar to P.T., where each loop has a unique change or oddity. These changes can be subtle, like a different poster, or major, like new characters and immediate dangers such as flooding. While there’s a bit of a backstory to the game’s creepy atmosphere, it’s largely left up to the player to figure out.