HBAR Hits the Jackpot: Hedera Price Soars 12% in a Single Day!
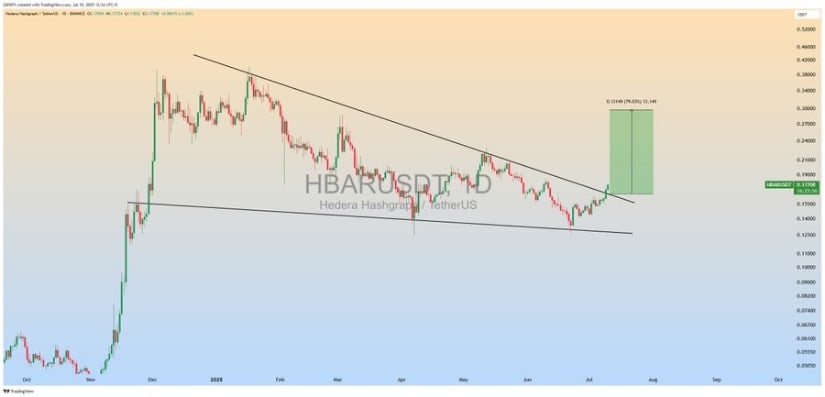
The daily HBAR/USDT chart published by ZAYK Charts (@ZAYKCharts) shows a clear breakout from a descending wedge pattern, which had formed through months of narrowing lower highs and lower lows. 📉 The breakout above the upper trendline indicates that the asset has exited the compression zone with some serious momentum. This technical pattern is often viewed as a bullish reversal, especially when accompanied by volume and market structure shifts. 💸