Berachain (BERA), once the darling of the crypto world, now finds itself in a rather unenviable position, having shed a staggering 50% of its value in just seven days. Technical indicators, those fickle harbingers of doom, are flashing red with the enthusiasm of a traffic light at a busy intersection. The RSI, that ever-reliable momentum oscillator, is languishing in the depths of oversold territory, while the DMI, with its cryptic signals, suggests that sellers are still firmly in the driver’s seat. 🚗💨
The EMA setup, that old friend of traders, is also pointing to continued downside, raising the specter of BERA breaking below the $3.80 mark and setting new all-time lows. But fear not, dear reader, for if the bulls, those eternal optimists, manage to muster some strength, key resistance levels at $4.44 and $4.78 could come into play, offering a glimmer of hope for a potential recovery. 🐂💪
BERA RSI: A Tale of Woe and Despair
Berachain’s RSI (Relative Strength Index) is currently sitting at a pitiful 24.19, having remained below the oversold threshold of 30 since yesterday. This persistent weakness in RSI is a testament to the sustained bearish pressure, with the token struggling to regain even a modicum of bullish momentum. 😢
Notably, BERA’s RSI has been below the neutral 50 mark since April 3, suggesting that the broader trend has been skewed to the downside for several days. It’s as if the token has been caught in a downward spiral, with no end in sight. 📉🌀
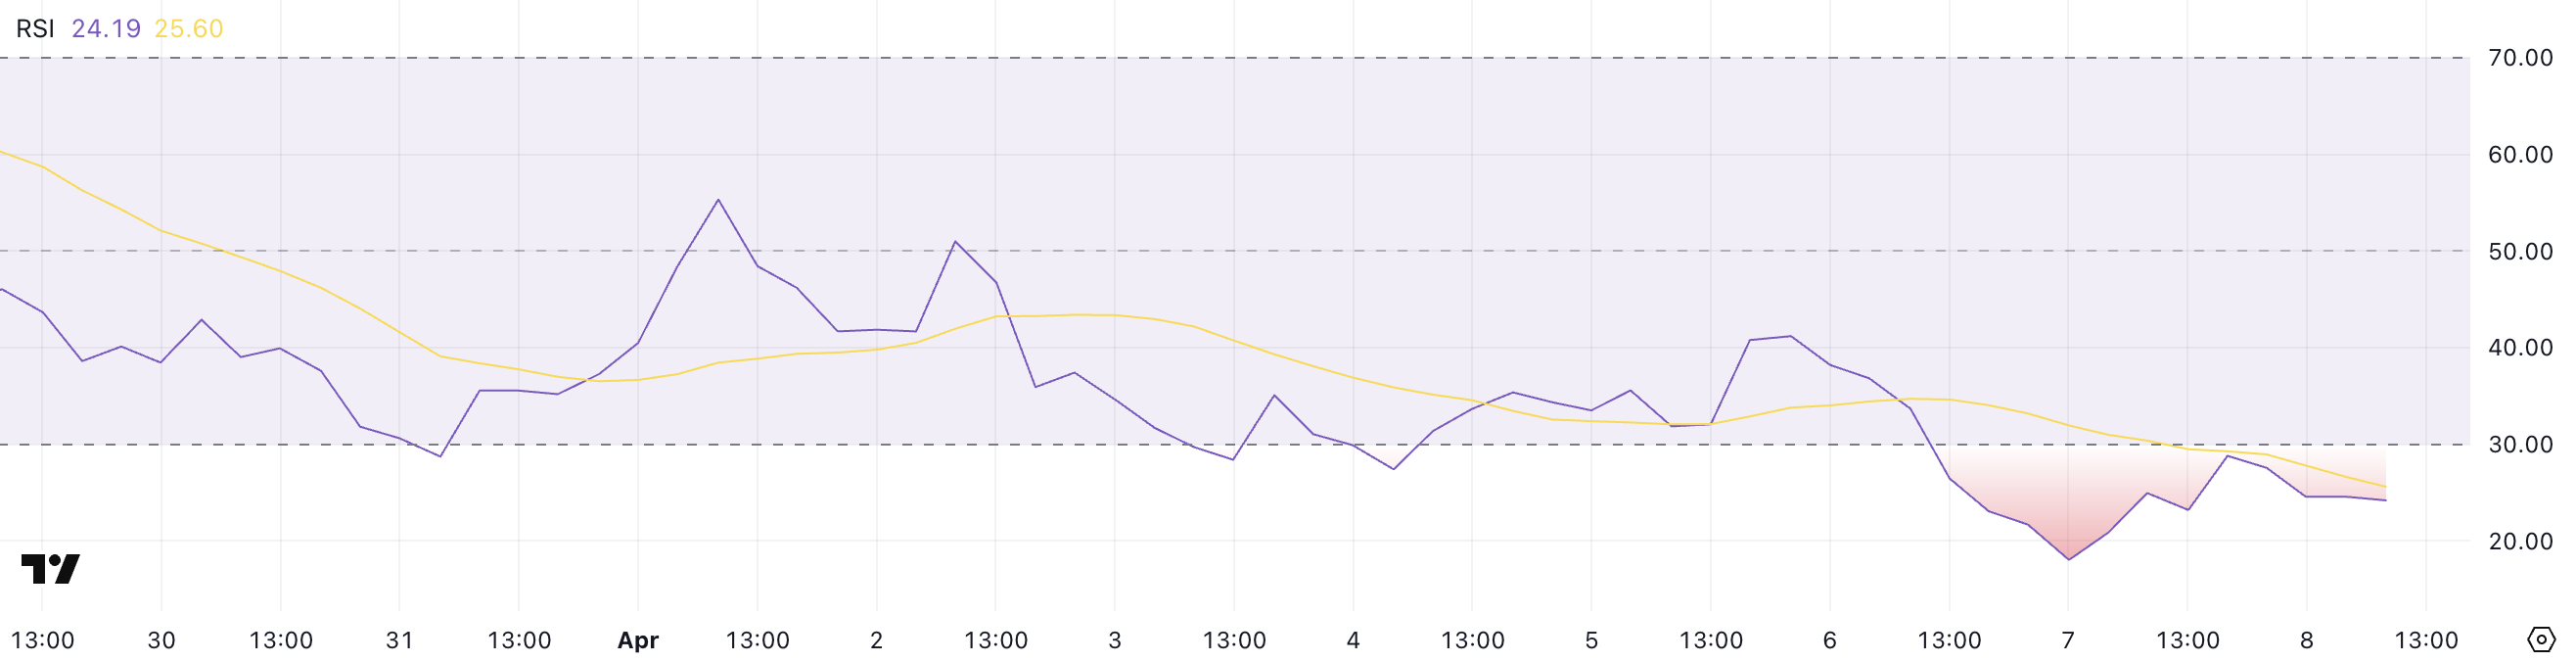
The RSI, that venerable momentum oscillator, measures the speed and change of price movements on a scale from 0 to 100. Readings above 70 typically indicate overbought conditions, while values below 30 suggest that an asset may be oversold and potentially primed for a rebound. With BERA’s RSI deeply oversold at 24.19, a short-term bounce could occur if buyers step in, but unless it can break above the 50 level, the broader downtrend may remain intact. 📊🤷♂️
Berachain DMI: The Bear’s Playground
Berachain’s DMI (Directional Movement Index) chart shows its ADX has climbed to 38.52, up significantly from 27.56 just two days ago. This sharp rise in ADX signals that the strength of the current trend — in this case, a bearish one — is intensifying. An ADX value above 25 typically indicates a strong trend, and with it now approaching 40, market momentum appears to be gaining traction. 🐻📈
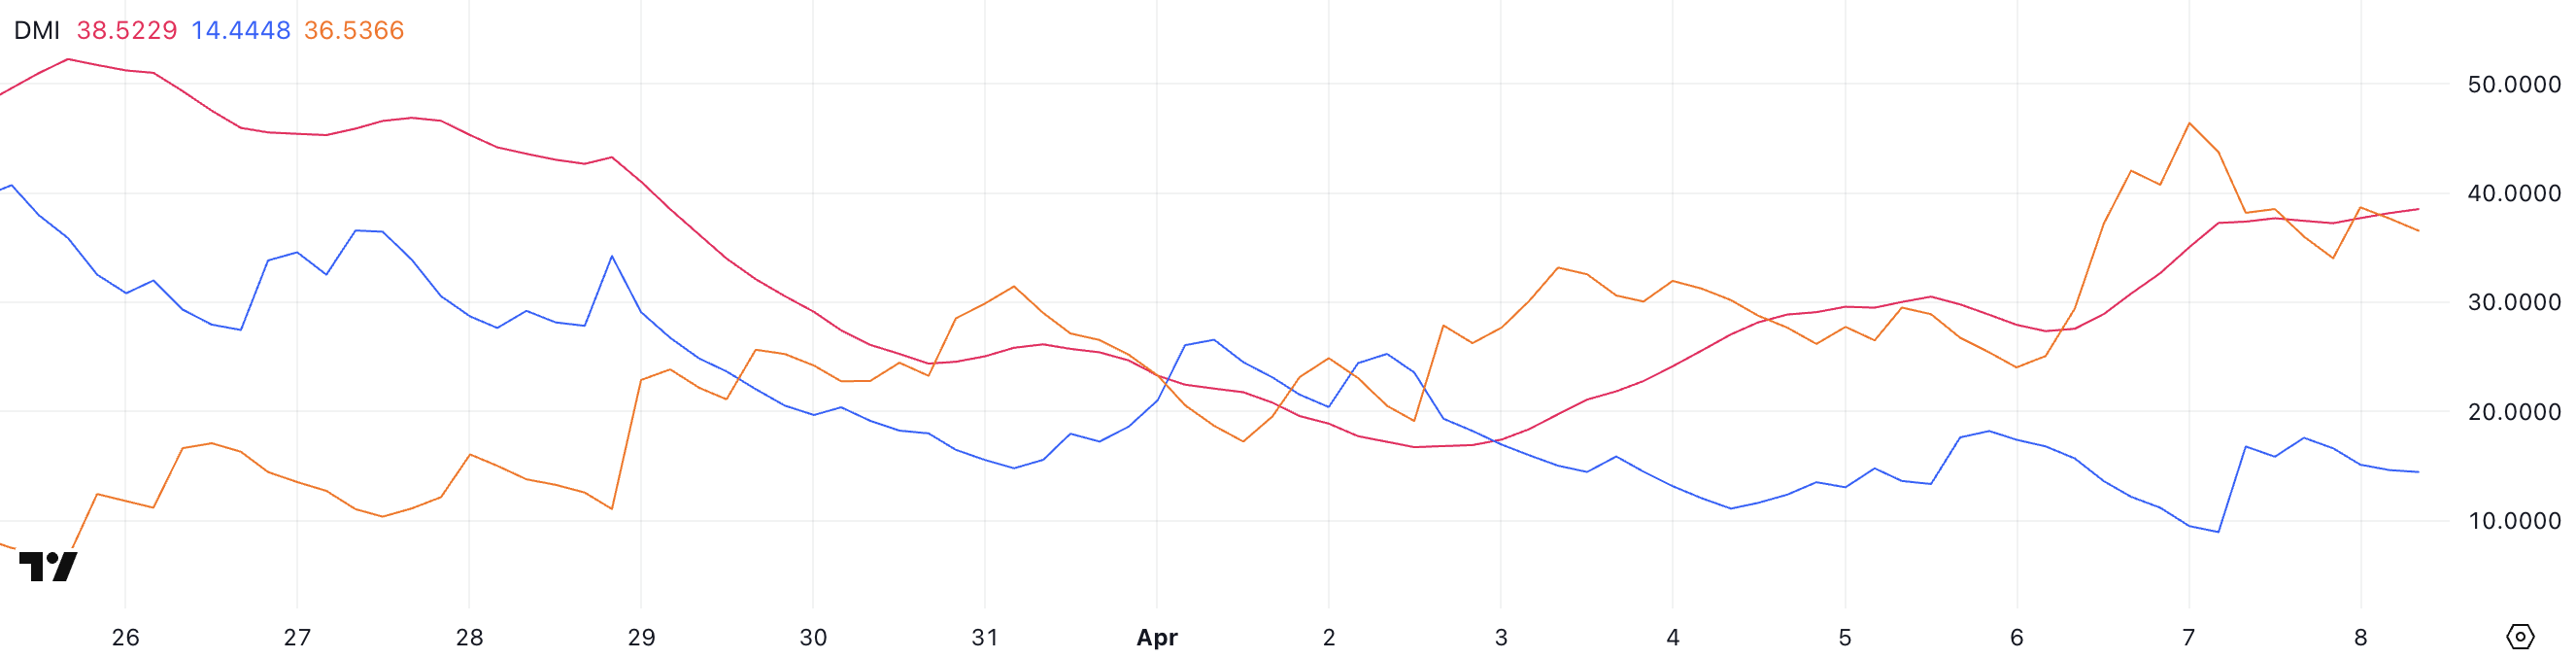
The DMI consists of two directional indicators: +DI, which tracks upward movement, and -DI, which tracks downward movement. BERA’s +DI has risen from 8.94 to 14.44, showing a modest increase in bullish pressure, though it’s remained stable in the last several hours. Meanwhile, the -DI has dropped from 46.4 to 36.53, suggesting that bearish dominance is softening slightly. While the narrowing gap between +DI and -DI points to a potential shift, the fact that -DI is still clearly in the lead, and ADX continues rising implies the downtrend remains in control — though bulls may be starting to push back. 🐂🐻
Will Berachain Make New All-Time Lows Soon? 🤔
Berachain’s price chart currently shows a bearish EMA setup, with short-term moving averages positioned below the long-term ones — a classic signal that downward momentum may persist. If this correction continues, BERA could fall below the $3.80 mark, setting a new all-time low and further shaking investor confidence in the short term. 📉💔
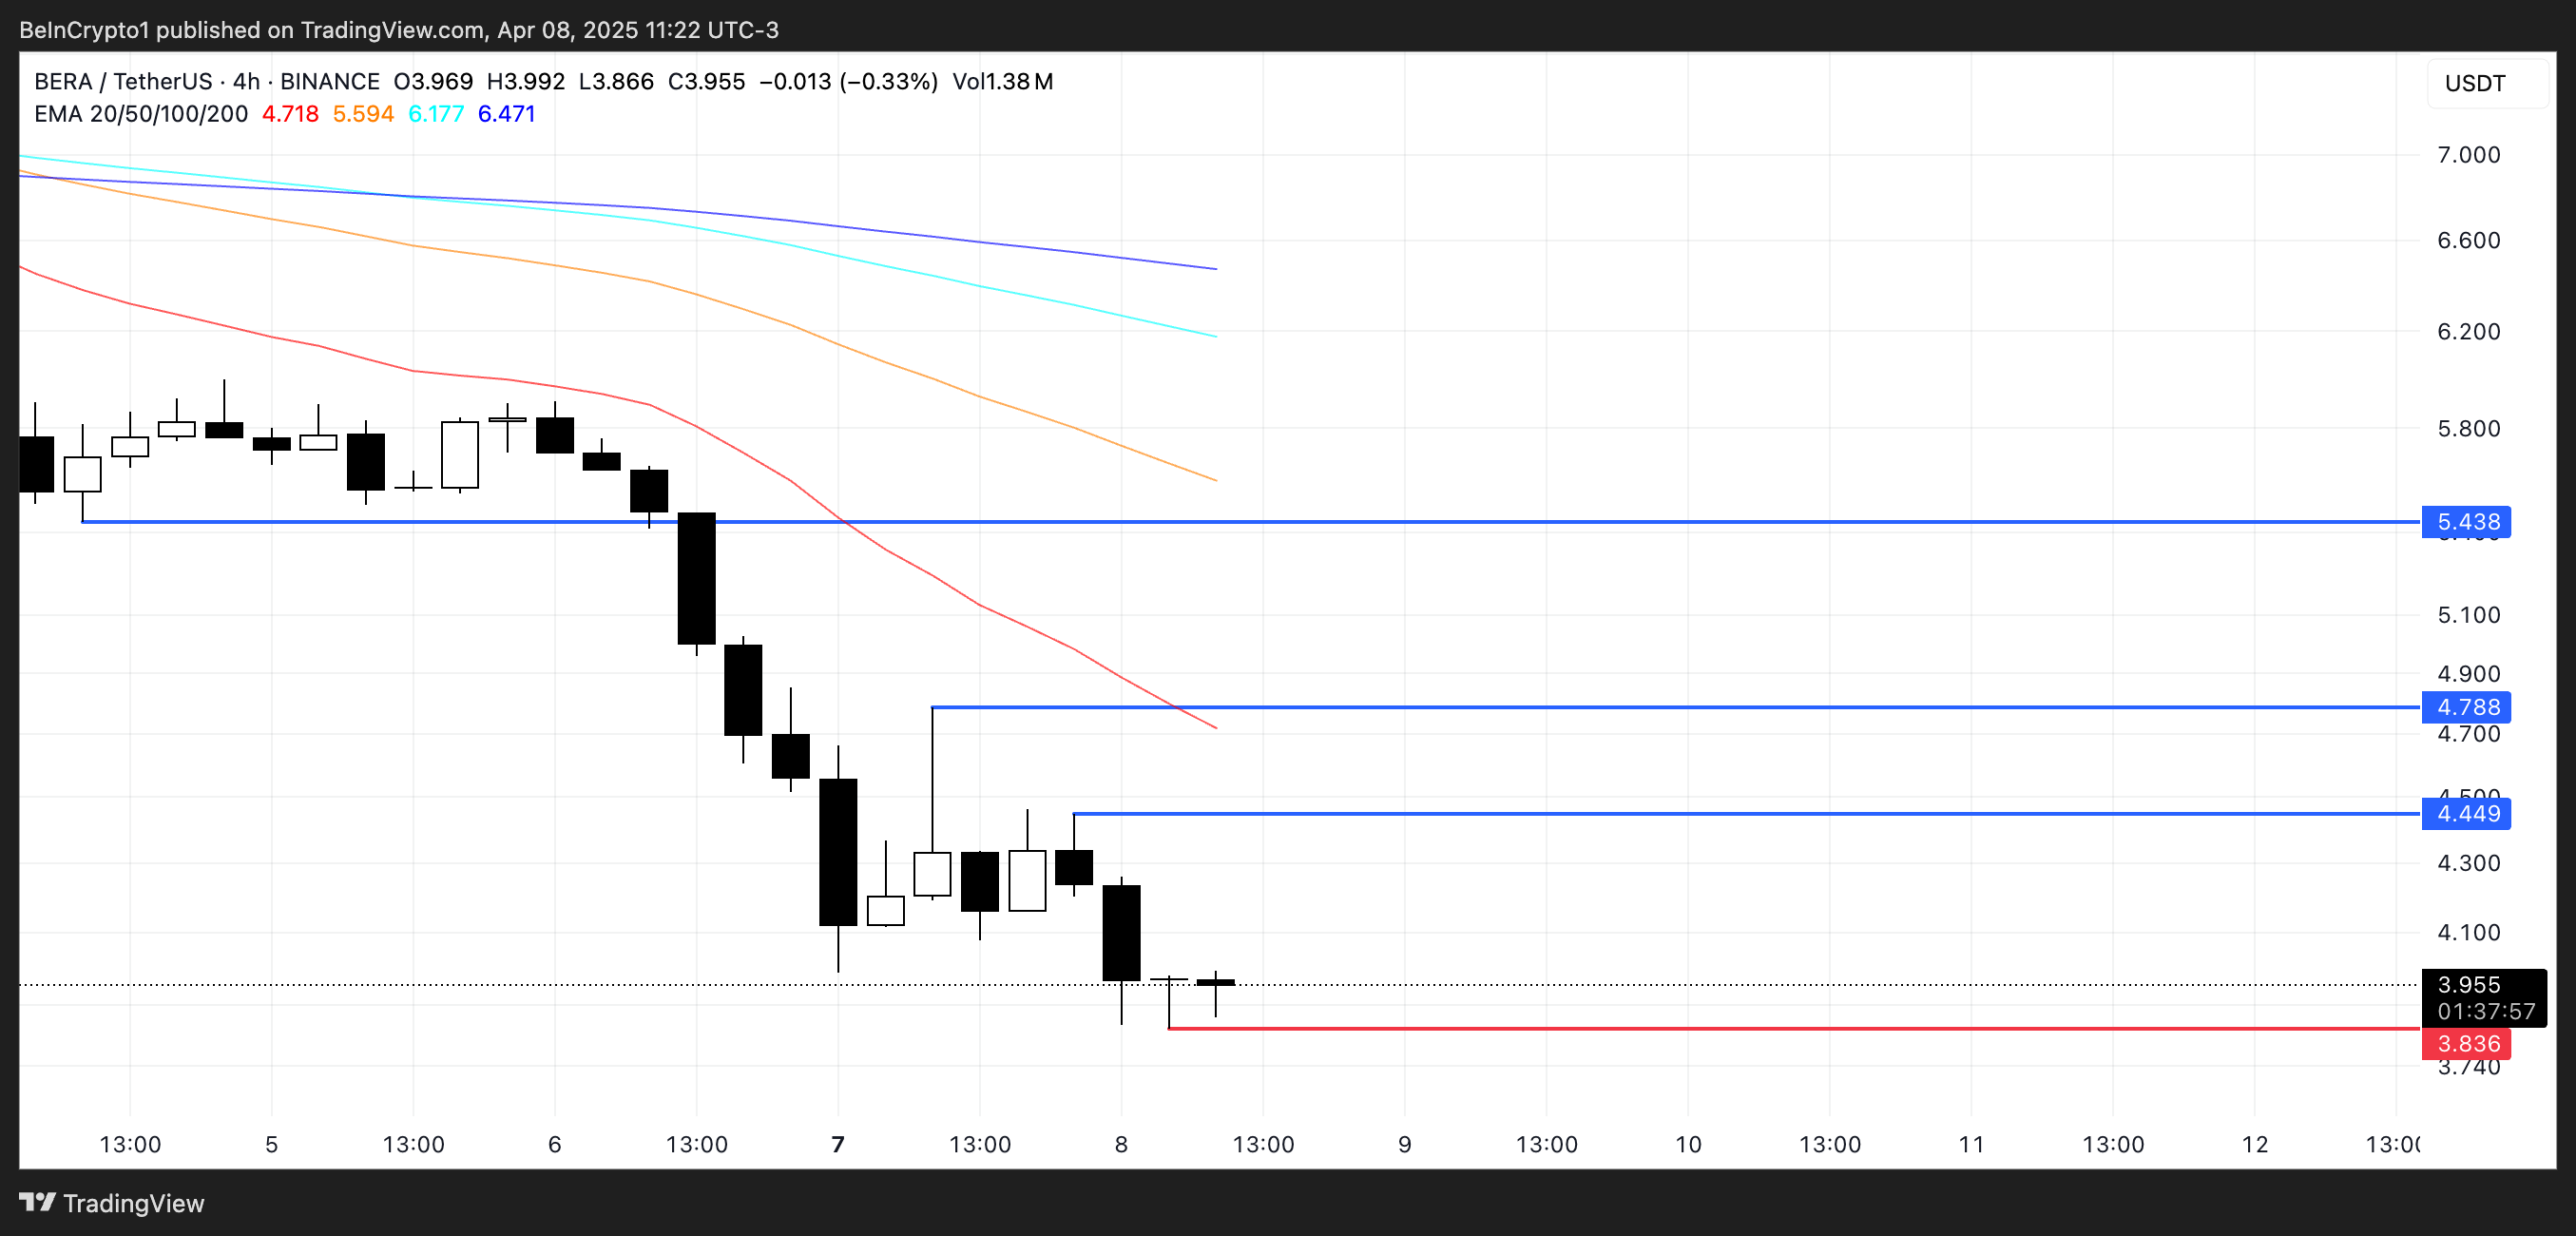
However, if the trend reverses and buyers step in with strength, BERA could begin climbing toward key resistance levels. The first major hurdle is at $4.44, and a breakout above that could open the path to $4.78. Should bullish momentum return in full force, Berachain may even rally to retest the $5.43 level, signaling a potential shift back into an uptrend. 🐂📈
Read More
- AI16Z PREDICTION. AI16Z cryptocurrency
- Best Awakened Hollyberry Build In Cookie Run Kingdom
- Best Mage Skills in Tainted Grail: The Fall of Avalon
- Tainted Grail the Fall of Avalon: Should You Turn in Vidar?
- Top 8 UFC 5 Perks Every Fighter Should Use
- USD ILS PREDICTION
- Tainted Grail: How To Find Robbie’s Grave
- Nintendo Offers Higher Margins to Japanese Retailers in Switch 2 Push
- Nintendo Switch 2 Confirms Important Child Safety Feature
- LUNC PREDICTION. LUNC cryptocurrency
2025-04-09 03:07