Bitcoin‘s Price Surge: A House of Cards Built on Leverage? 🤔
Bitcoin’s recent recovery above $99,000 has been a welcome respite for enthusiasts, but beneath the surface, a more nuanced tale is unfolding. The Open Interest, a metric that tracks the total amount of positions related to BTC on derivatives exchanges, has seen a precipitous rise alongside the latest price rally.
Bitcoin Open Interest Has Spiked Alongside The Latest Rally
In a post on X, CryptoQuant community analyst Maartunn noted that the trend in the Bitcoin Open Interest is a cause for concern. When the Open Interest rises, it’s a sign that derivatives users are opening fresh positions, leading to an increase in leverage and, subsequently, higher volatility for the asset’s price.
On the other hand, a decline in the Open Interest indicator suggests that holders are either closing positions voluntarily or getting liquidated by their platform. This can lead to a more stable market environment.
Now, behold the chart shared by the analyst, which shows the trend in the Bitcoin Open Interest, as well as its 24-hour percentage change, over the last week:
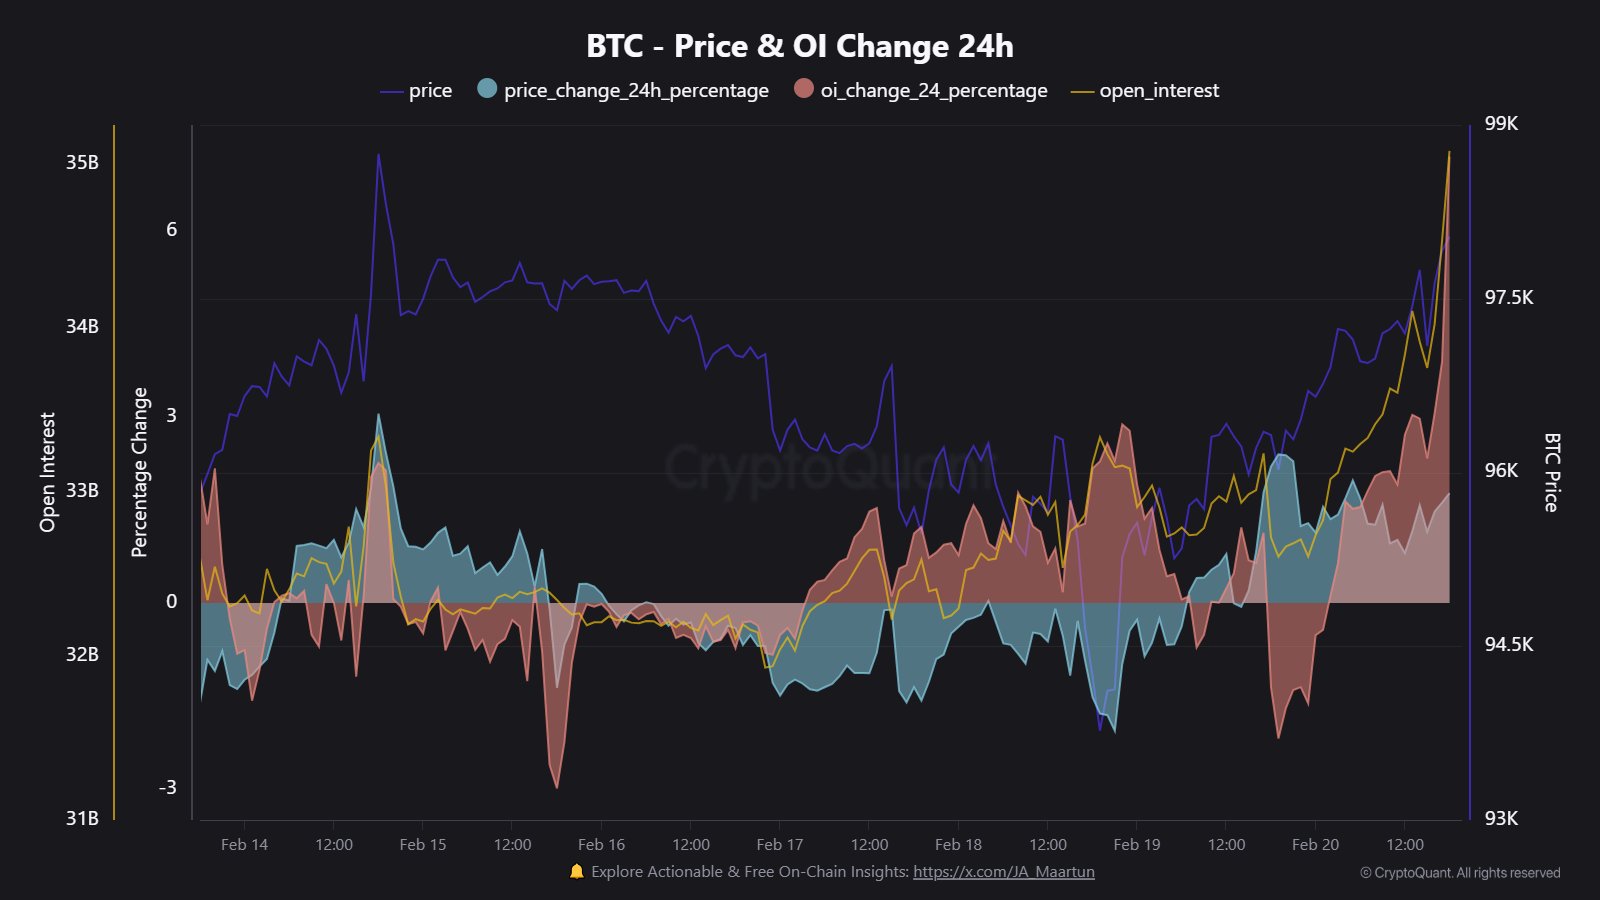
As you can see, the Bitcoin Open Interest has seen a rapid increase alongside the latest recovery rally in the coin’s price. The 24-hour percentage change hit a whopping 7.2% at its peak – a significant spike, to say the least.
While it’s natural for speculative activity to follow a sharp move in the cryptocurrency, an excess of it can still be an alarming sign. In a high-leverage environment, the chances of a mass liquidation event can become notable. And, as we all know, volatility emerging out of such derivatives market chaos can take the cryptocurrency in either direction – but usually, Open Interest spikes that accompany rallies end up acting as an impedance for it.
Thus, it’s possible that the latest Bitcoin rally may also unwind in a volatile manner. But don’t just take our word for it – the analytics firm Glassnode has also pointed out that the trend in the Open Interest isn’t the only one that suggests volatility could be coming for the asset.
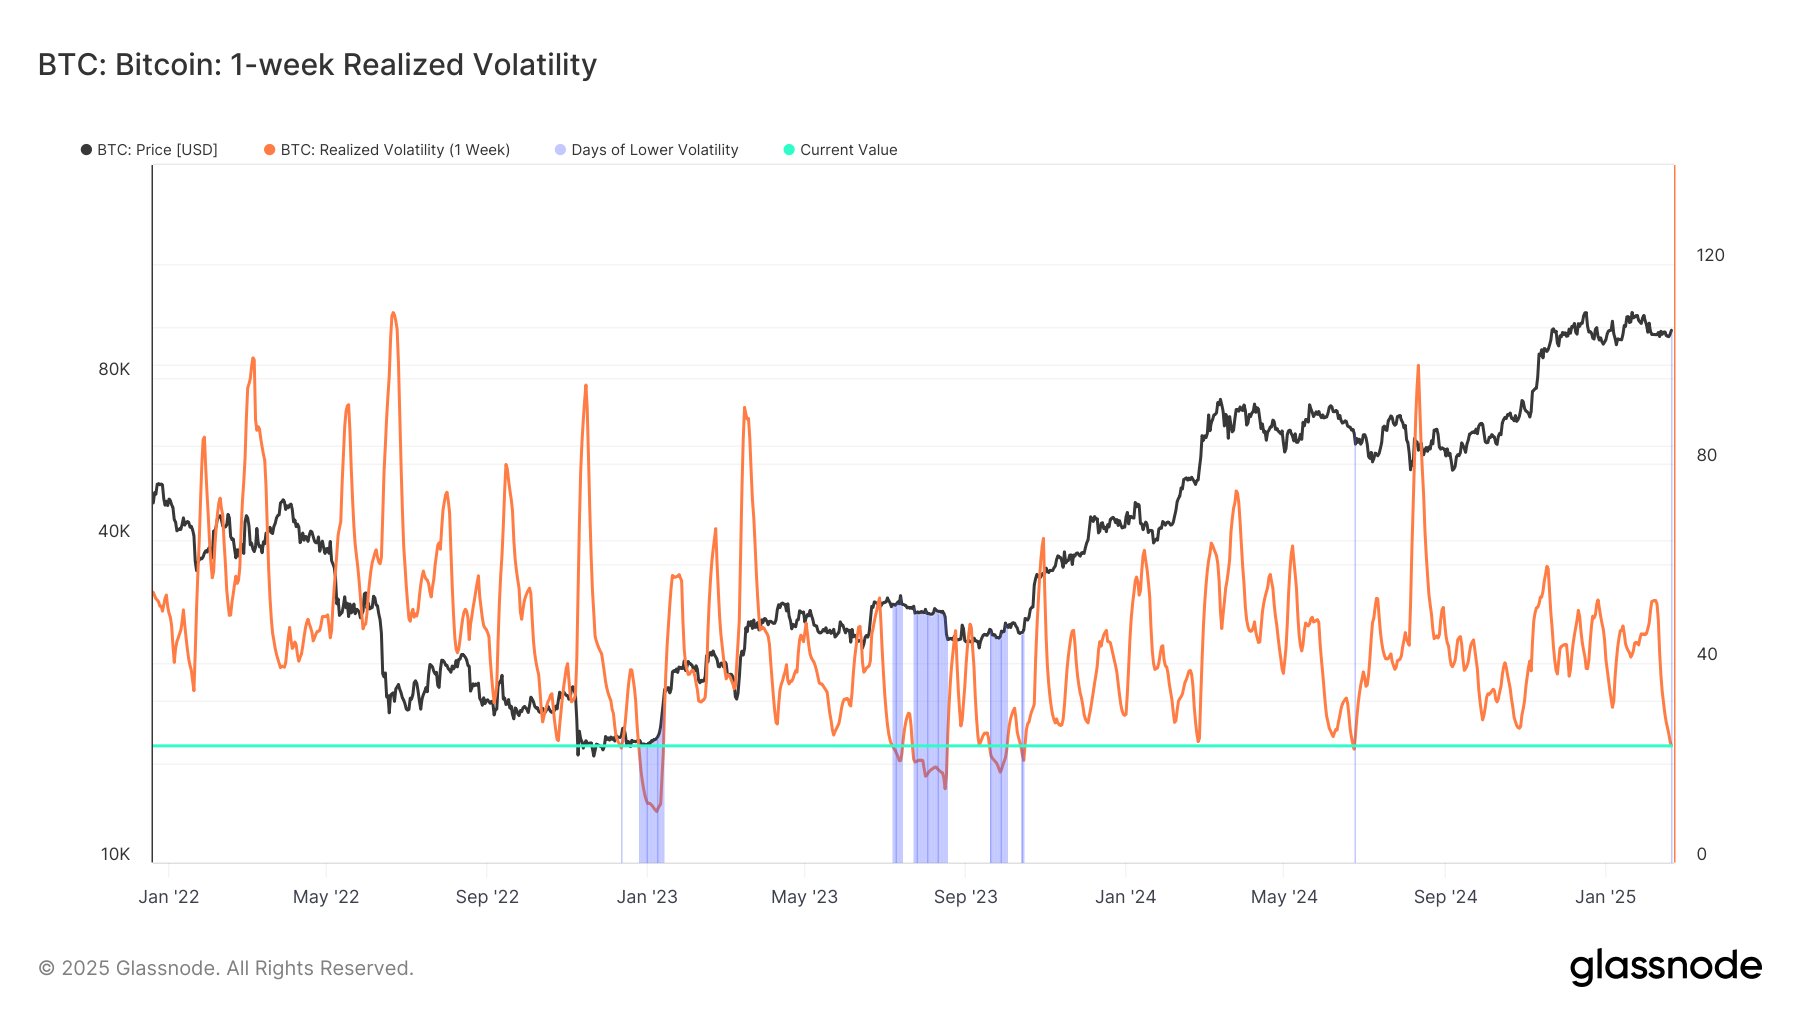
The chart shared by Glassnode is for the 1-week Realized Volatility, an indicator that tracks the percentage change between the highest and lowest points in the Bitcoin price recorded during the last seven days.
As displayed in the graph, the metric’s value has plunged recently, implying the asset has been trading inside a very narrow range. “In the past four years, it has dipped lower only a few times – e.g., Oct 2024 (22.88%) & Nov 2023 (21.35%),” explains Glassnode. “Similar compressions in the past led to major market moves.”
BTC Price
Following a jump of around 2% in the last 24 hours, Bitcoin has recovered back above the $99,300 level.

Read More
- Devil May Cry Netflix: Season 1 Episodes Ranked
- Mr. Ring-a-Ding: Doctor Who’s Most Memorable Villain in Years
- You’re Going to Lose It When You See the Next Love and Deepspace Banner!
- Luffy DESTROYS Kizaru? One Piece Episode 1127 Release Date Revealed!
- Nine Sols: 6 Best Jin Farming Methods
- How to Get the Cataclysm Armor & Weapons in Oblivion Remastered Deluxe Edition
- Top 8 UFC 5 Perks Every Fighter Should Use
- Prestige Perks in Space Marine 2: A Grind That Could Backfire
- Unlock Roslit Bay’s Bestiary: Fisch Fishing Guide
- Get Ready for ‘Displacement’: The Brutal New Horror Game That Will Haunt Your Dreams!
2025-02-22 16:43