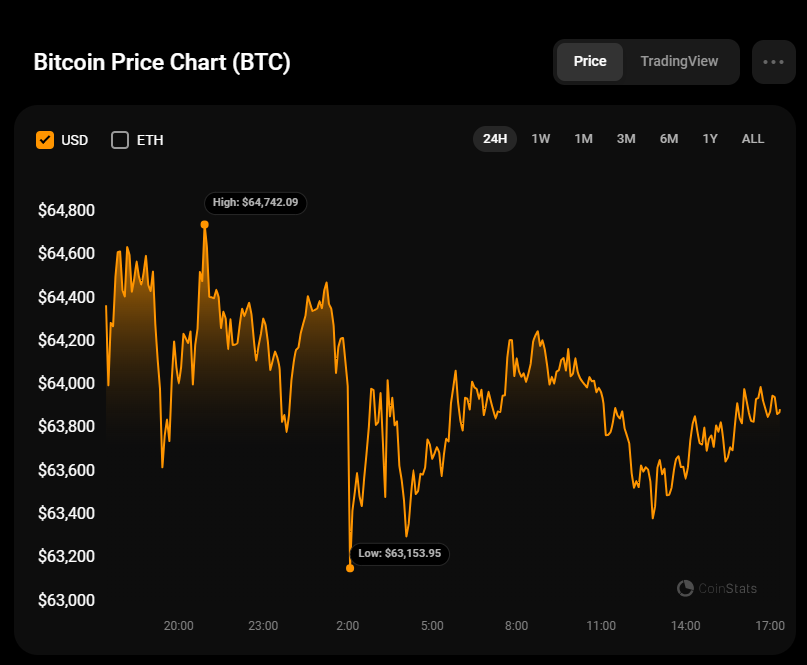
Neither bulls nor bears are dominating at the beginning of the weekend, according to CoinStats.

BTC/USD
The price of Bitcoin (BTC) has dropped by 1% since yesterday.

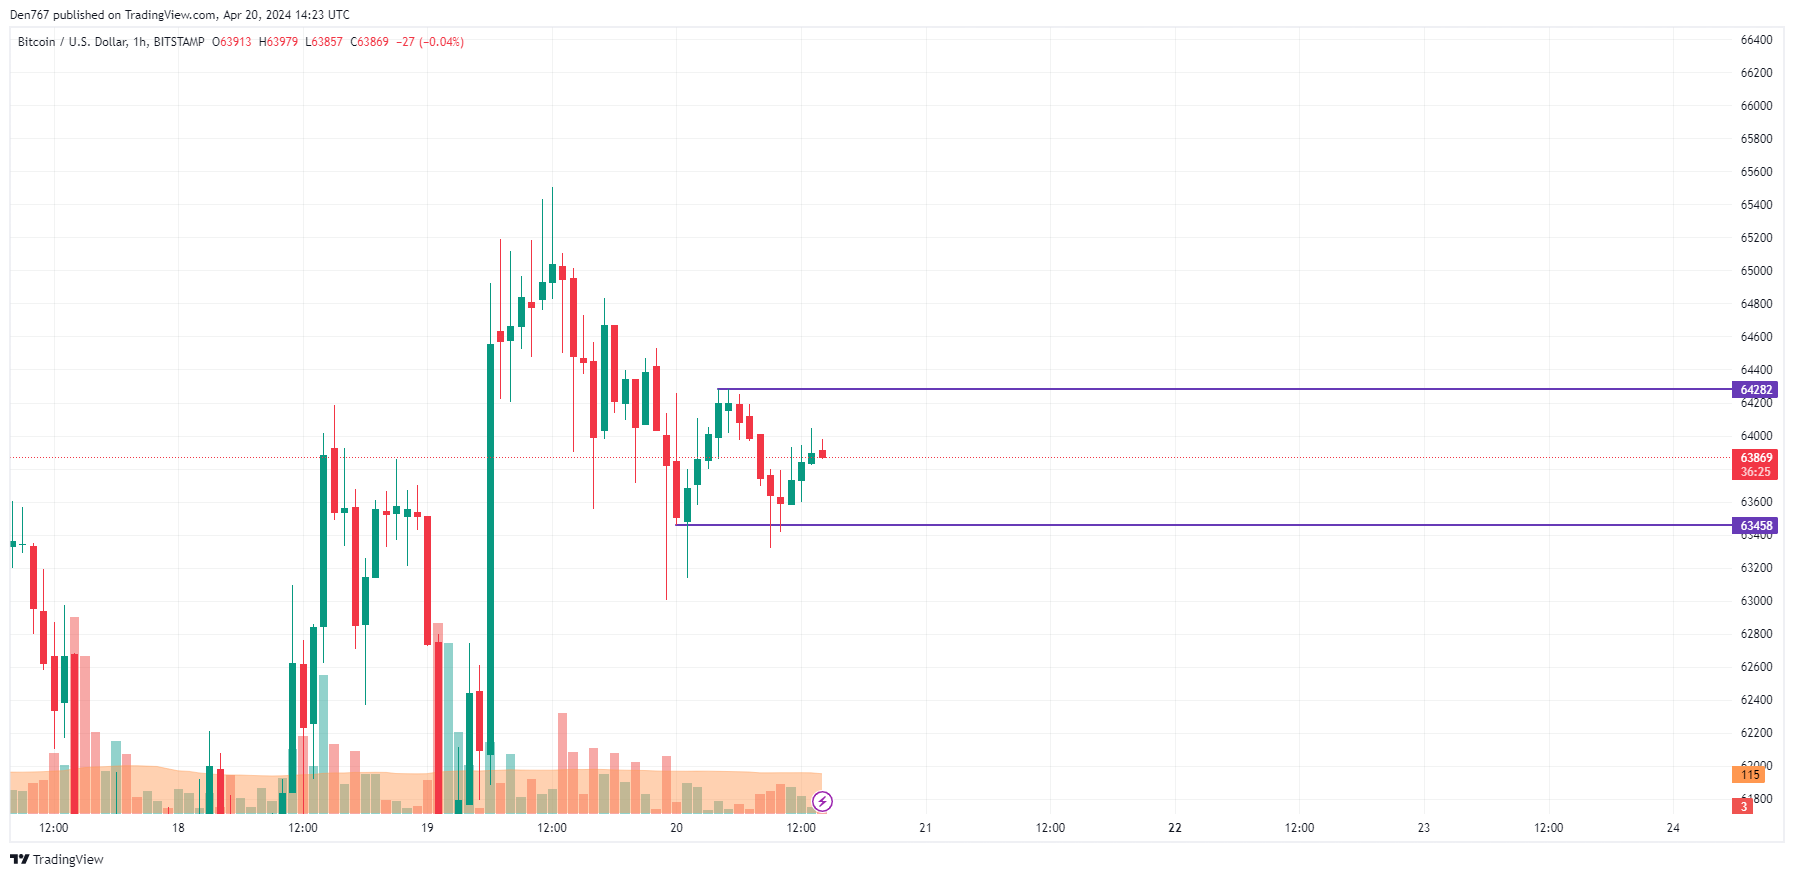
Every hour on the clock, Bitcoin’s price hovers around the mark between its support at $63,458 and its resistance at $64,282 on the chart.
By now, the majority of the daily price range set by the Average True Range (ATR) has been covered. Therefore, significant price swings are less likely to occur before the end of the trading day.

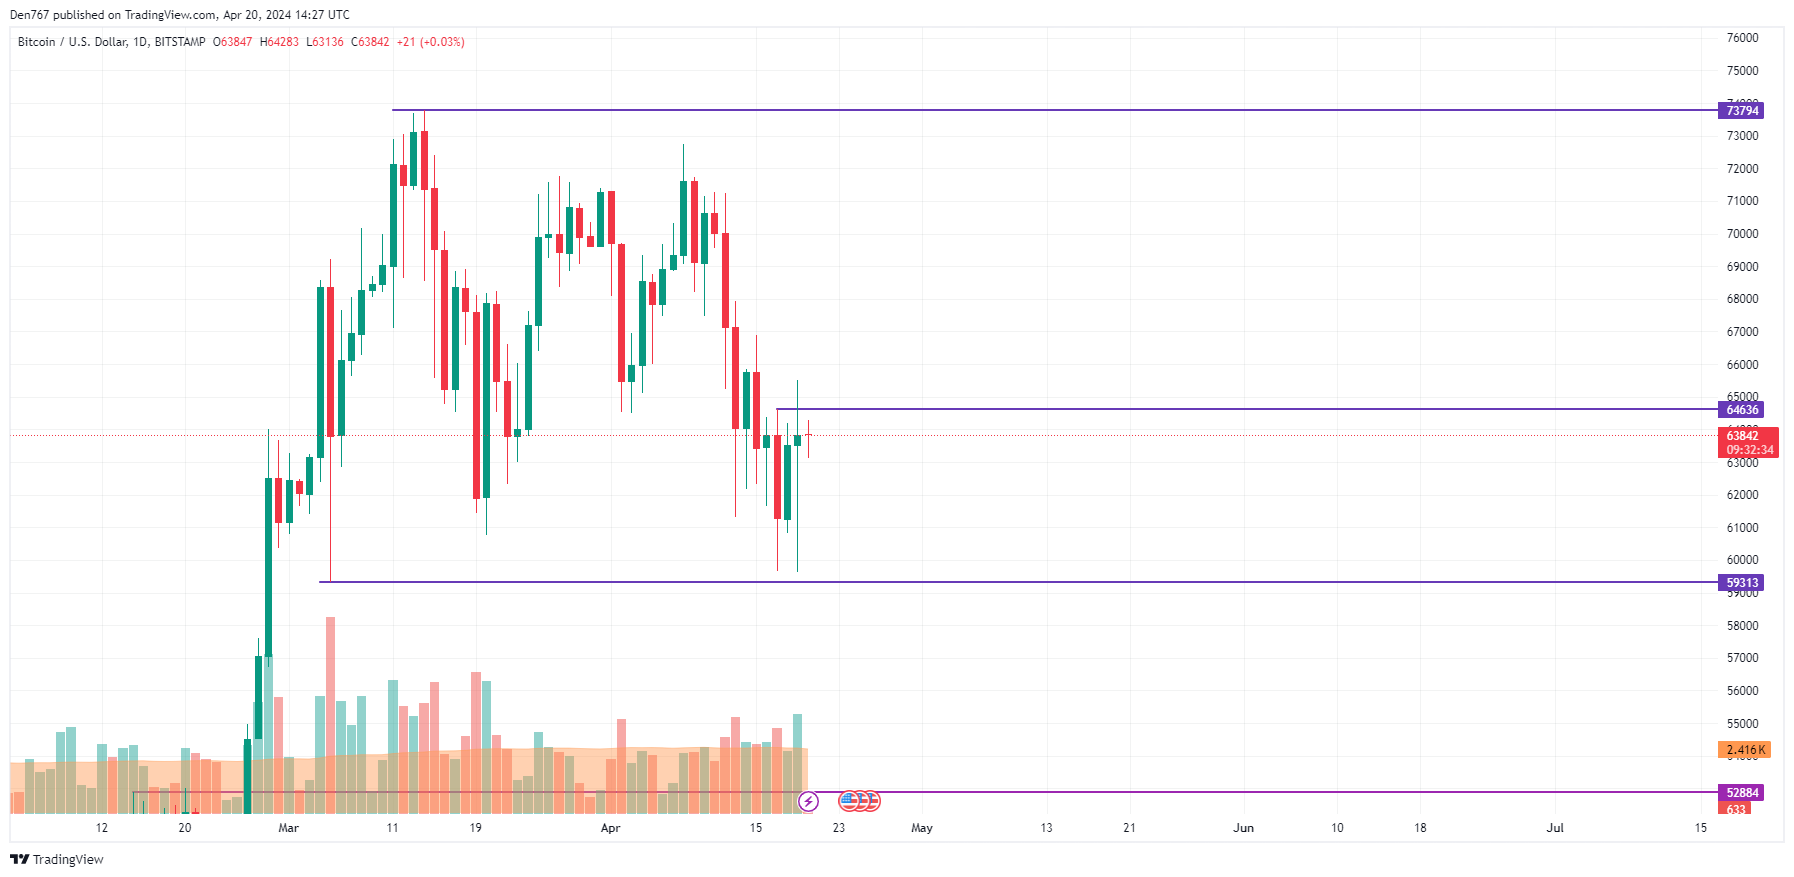
For traders referring to the larger Bitcoin chart, it’s essential to keep an eye on the nearby resistance level at $64,636. A price surge beyond this mark is unlikely without first surpassing it. If this condition isn’t met, a correction towards the $63,000 zone may ensue.

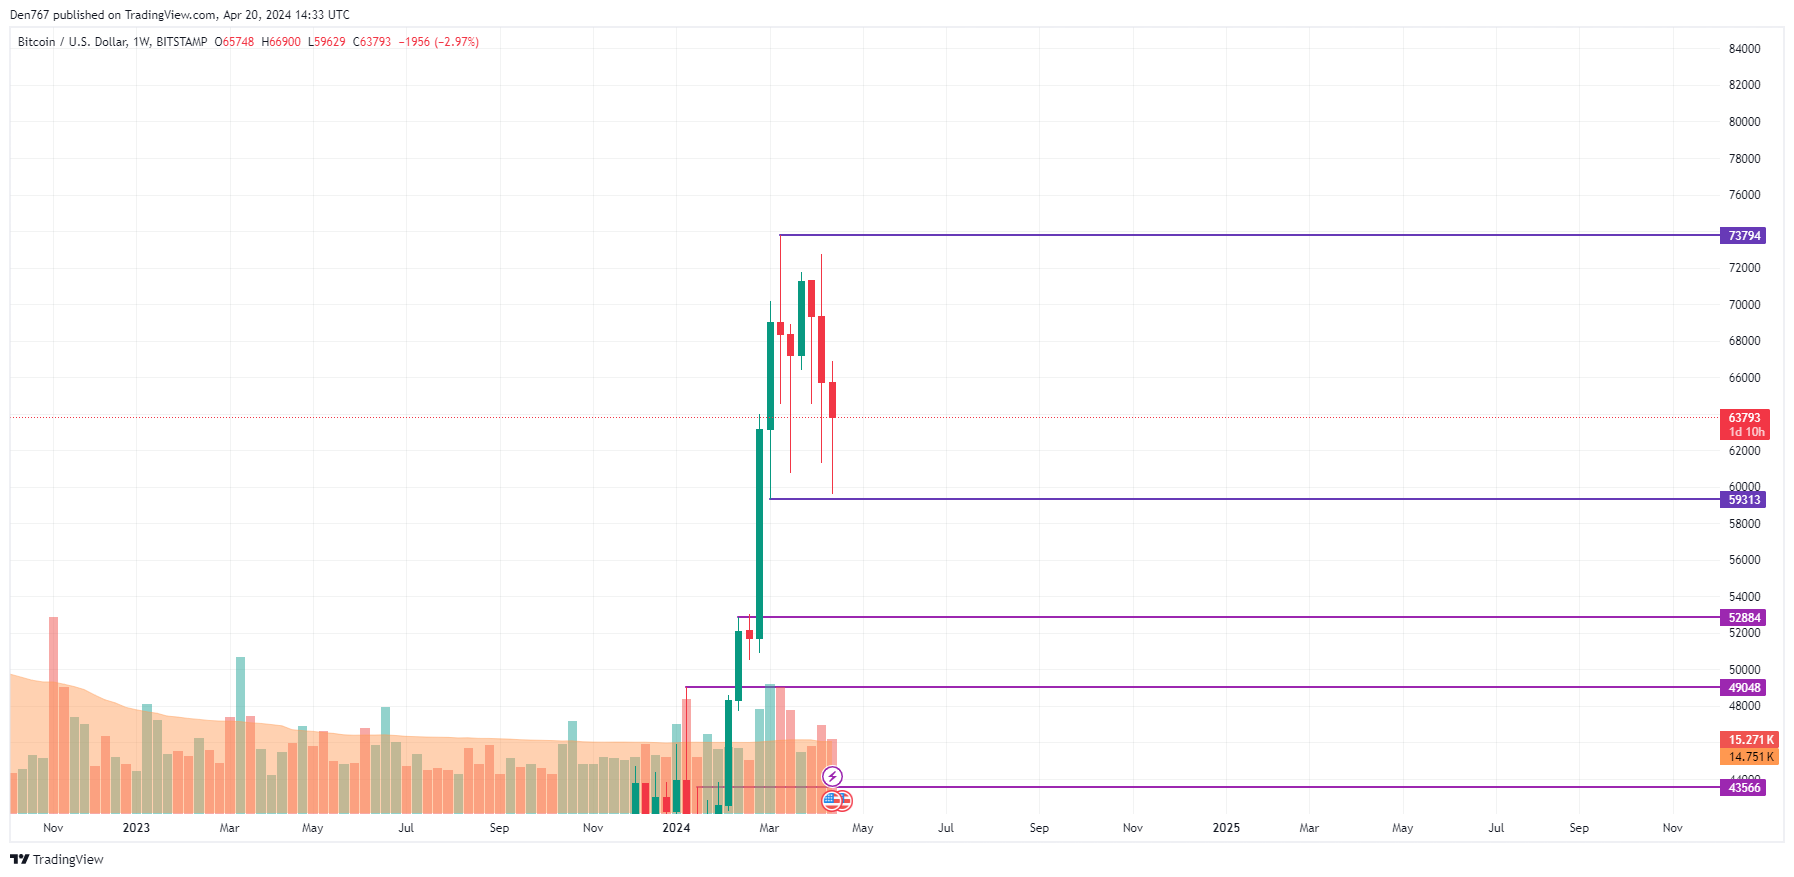
Looking at the midterm perspective, the rate is currently quite a distance from its previous support and resistance levels. If the weekly bar finishes near its current price point, it’s more probable that the market will continue moving sideways within the $62,000 to $66,000 range for the upcoming week.
Bitcoin is trading at $63,790 at press time.
Read More
- LUNC PREDICTION. LUNC cryptocurrency
- BTC PREDICTION. BTC cryptocurrency
- BICO PREDICTION. BICO cryptocurrency
- SOL PREDICTION. SOL cryptocurrency
- USD COP PREDICTION
- USD CLP PREDICTION
- VANRY PREDICTION. VANRY cryptocurrency
- USD ZAR PREDICTION
- USD PHP PREDICTION
- Kaspa Price Analysis: Navigating The Roadmap To $0.2
2024-04-20 20:17