Bitcoin, the diva of the financial world, continues to steal the spotlight, strutting at a price of $92,454, and sporting a market cap of $1.83 trillion like it’s the latest fashion trend. A 24-hour trading volume of $37.01 billion proves it’s still the talk of the town. Within the last 24 hours, its price has waltzed between $91,809 and $94,700—truly keeping traders on their toes, with all the thrills and chills one could hope for in this high-stakes drama.
Bitcoin: The Drama Continues
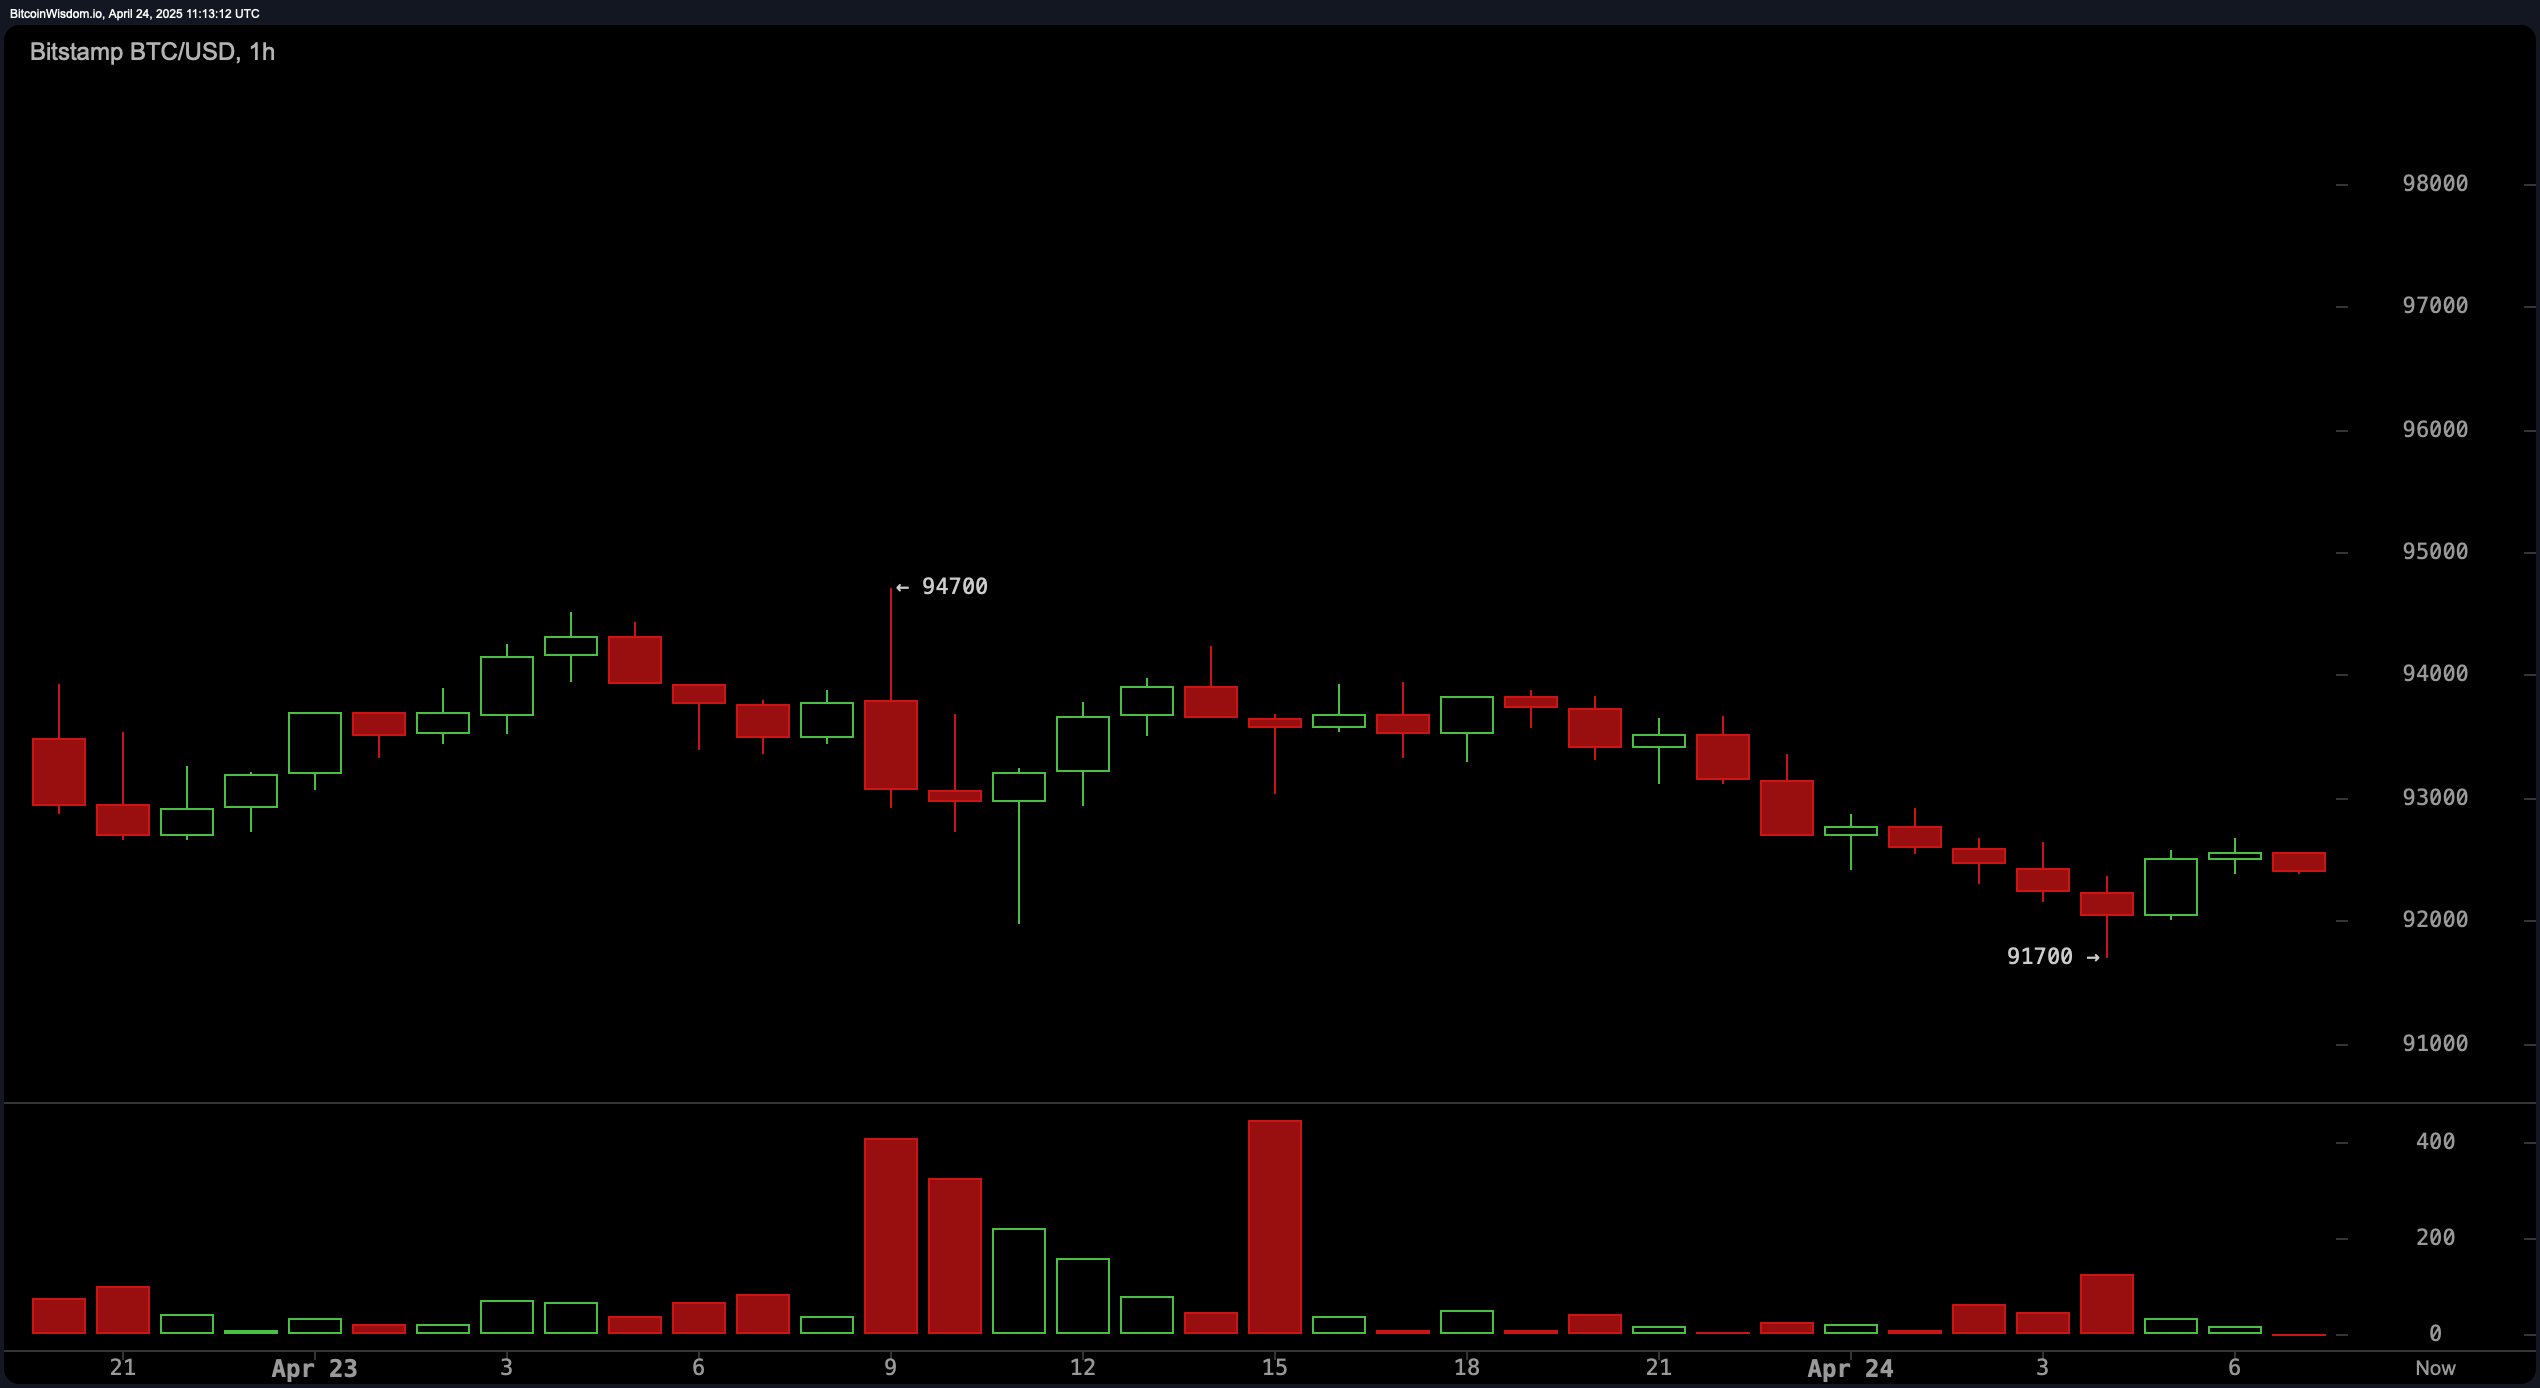
As we peek into the one-hour chart, Bitcoin appears to be having a minor tantrum after being rejected at the $94,700 mark. This setback caused a little dip to around $91,700, but it’s not over yet. A small recovery suggests some buyers might be sneaking in, like secret agents on a covert mission. However, the chart is showing lower highs and lower lows, accompanied by red volume surges that scream “bearish!” So, if you’re one of those looking for quick profits, be careful. A test of $91,700 with a higher low might offer a fleeting opportunity to scalp a few bucks before the bears come back in full force and drag it to $93,000.
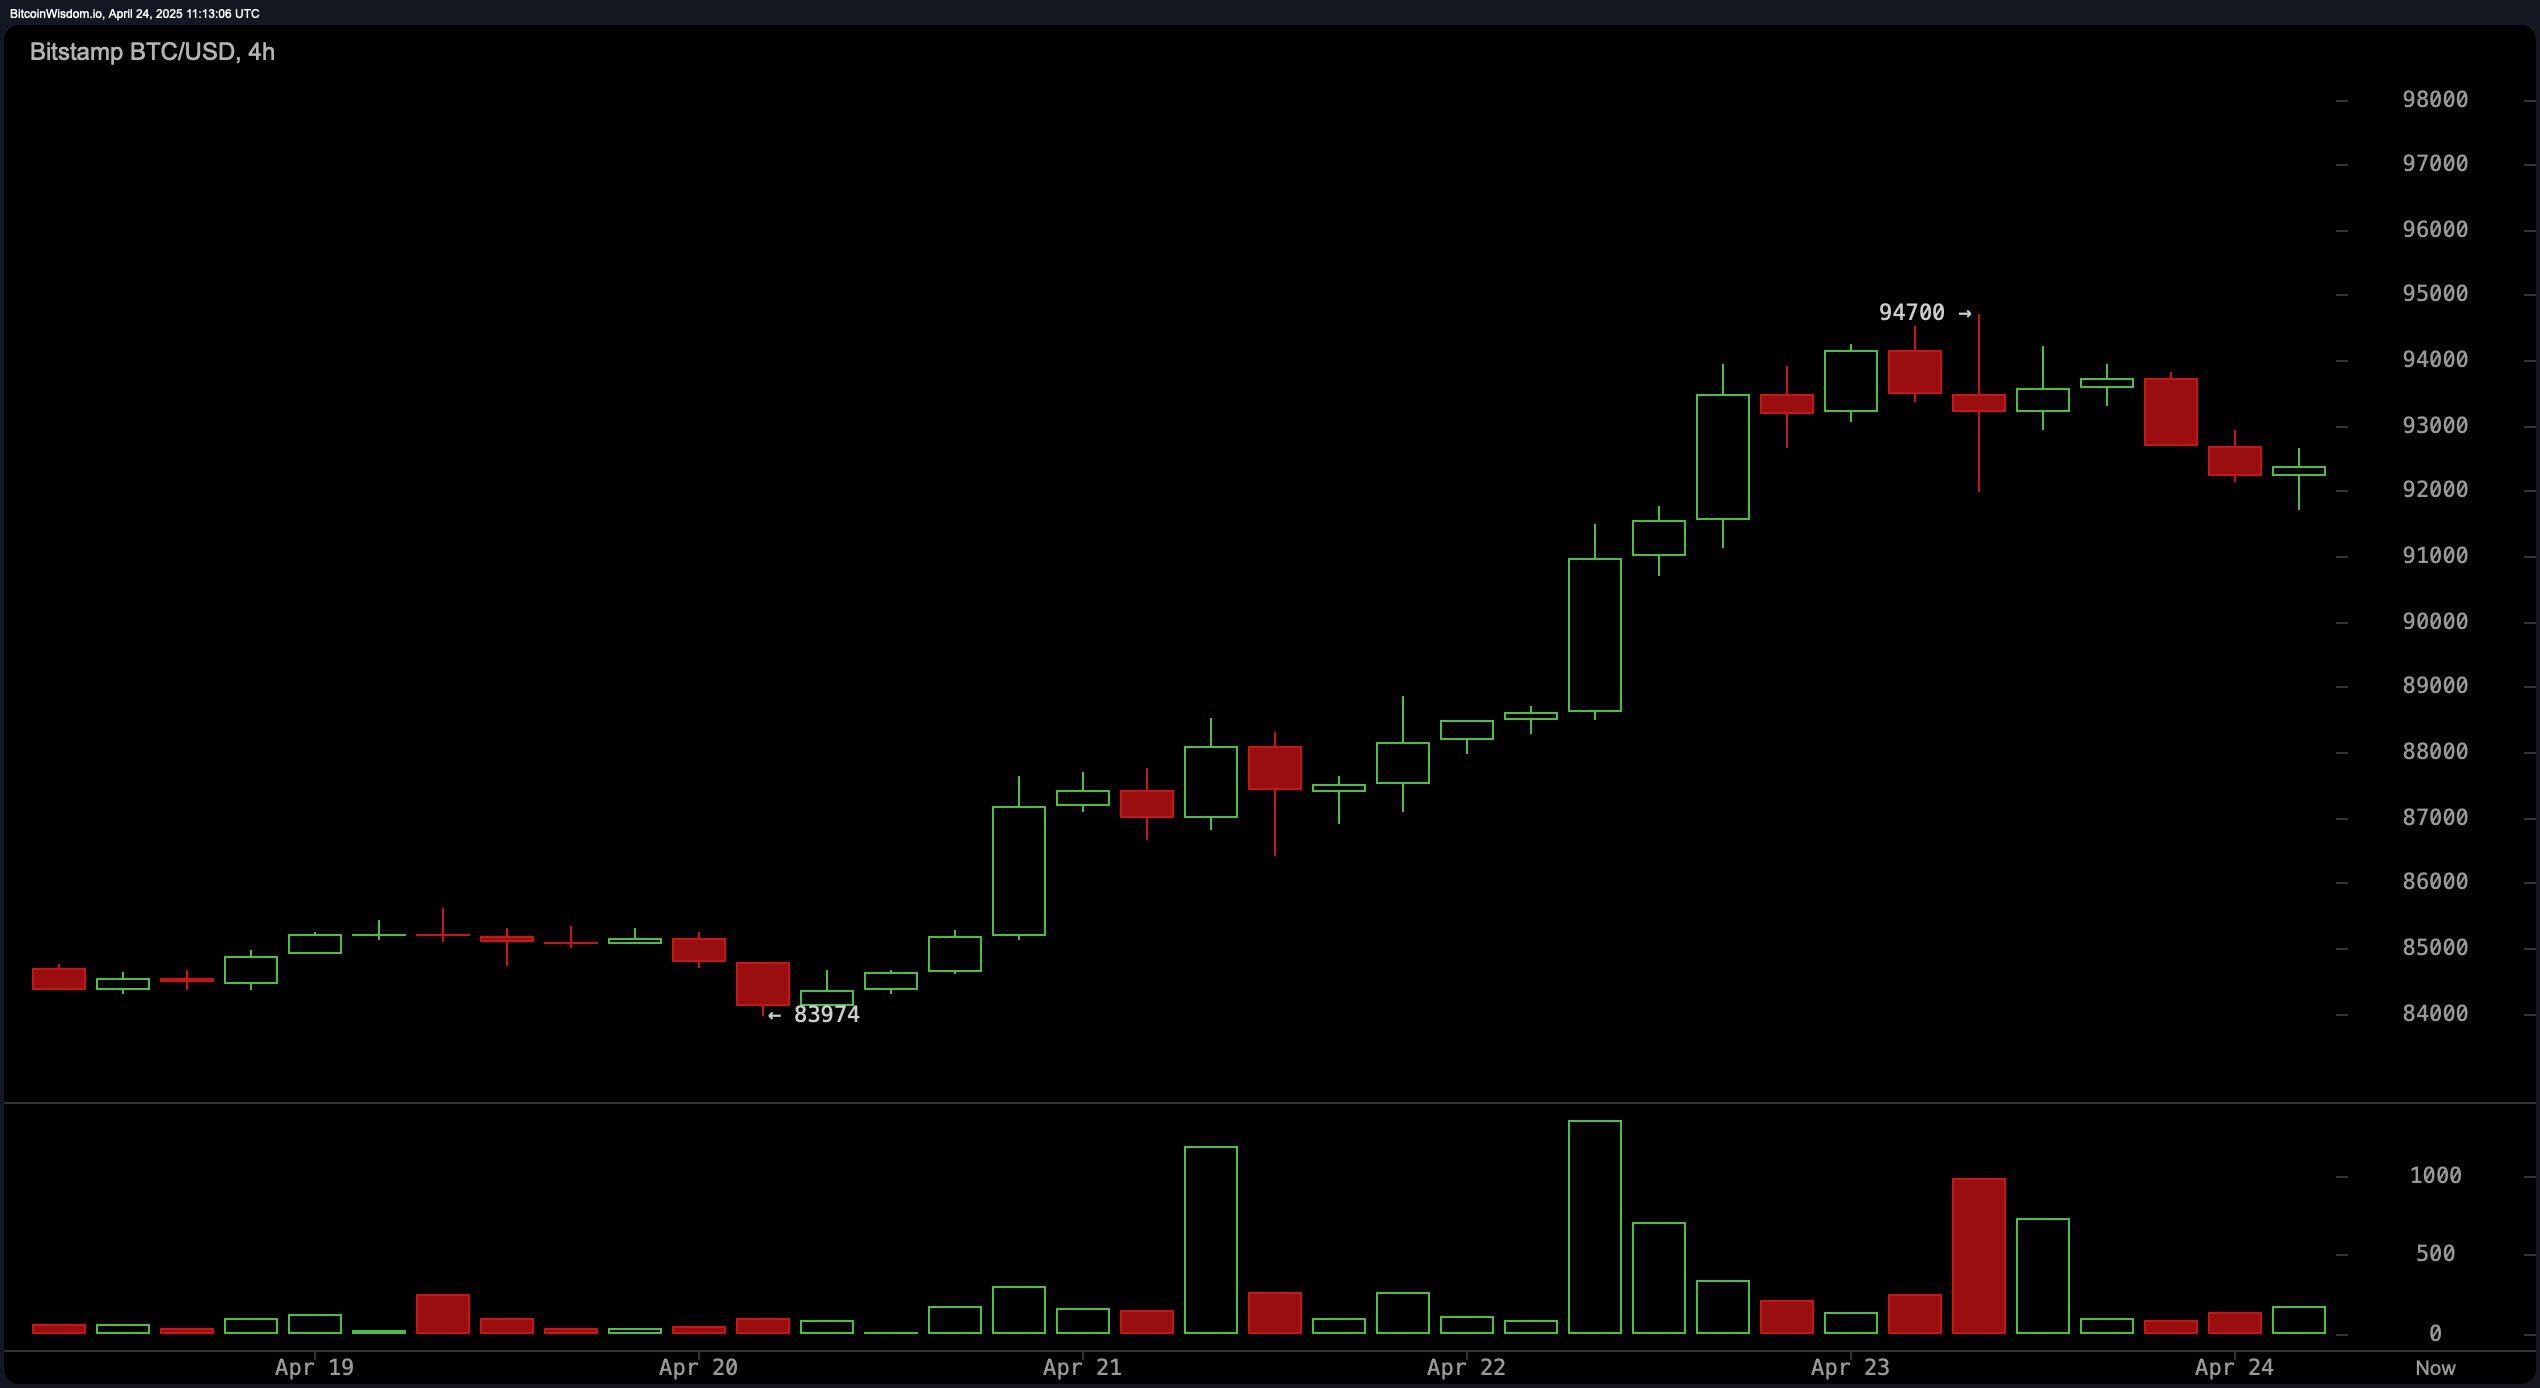
Moving to the four-hour chart, Bitcoin seems to be cooling down after its latest drama-filled peak. With descending highs and a slight price retreat, it’s like the market is whispering “Maybe… we need a break.” The increasing selling volume at the highs adds weight to this argument, giving the bulls a long stare before they can reenter the stage. But don’t give up hope just yet; a fresh consolidation between $92,000 and $92,500 could be the perfect setup for a rebound. If volatility slows down and support strengthens, you might just want to take a chance, with a protective stop, aiming for a bullish encore to challenge the $94,000 resistance.
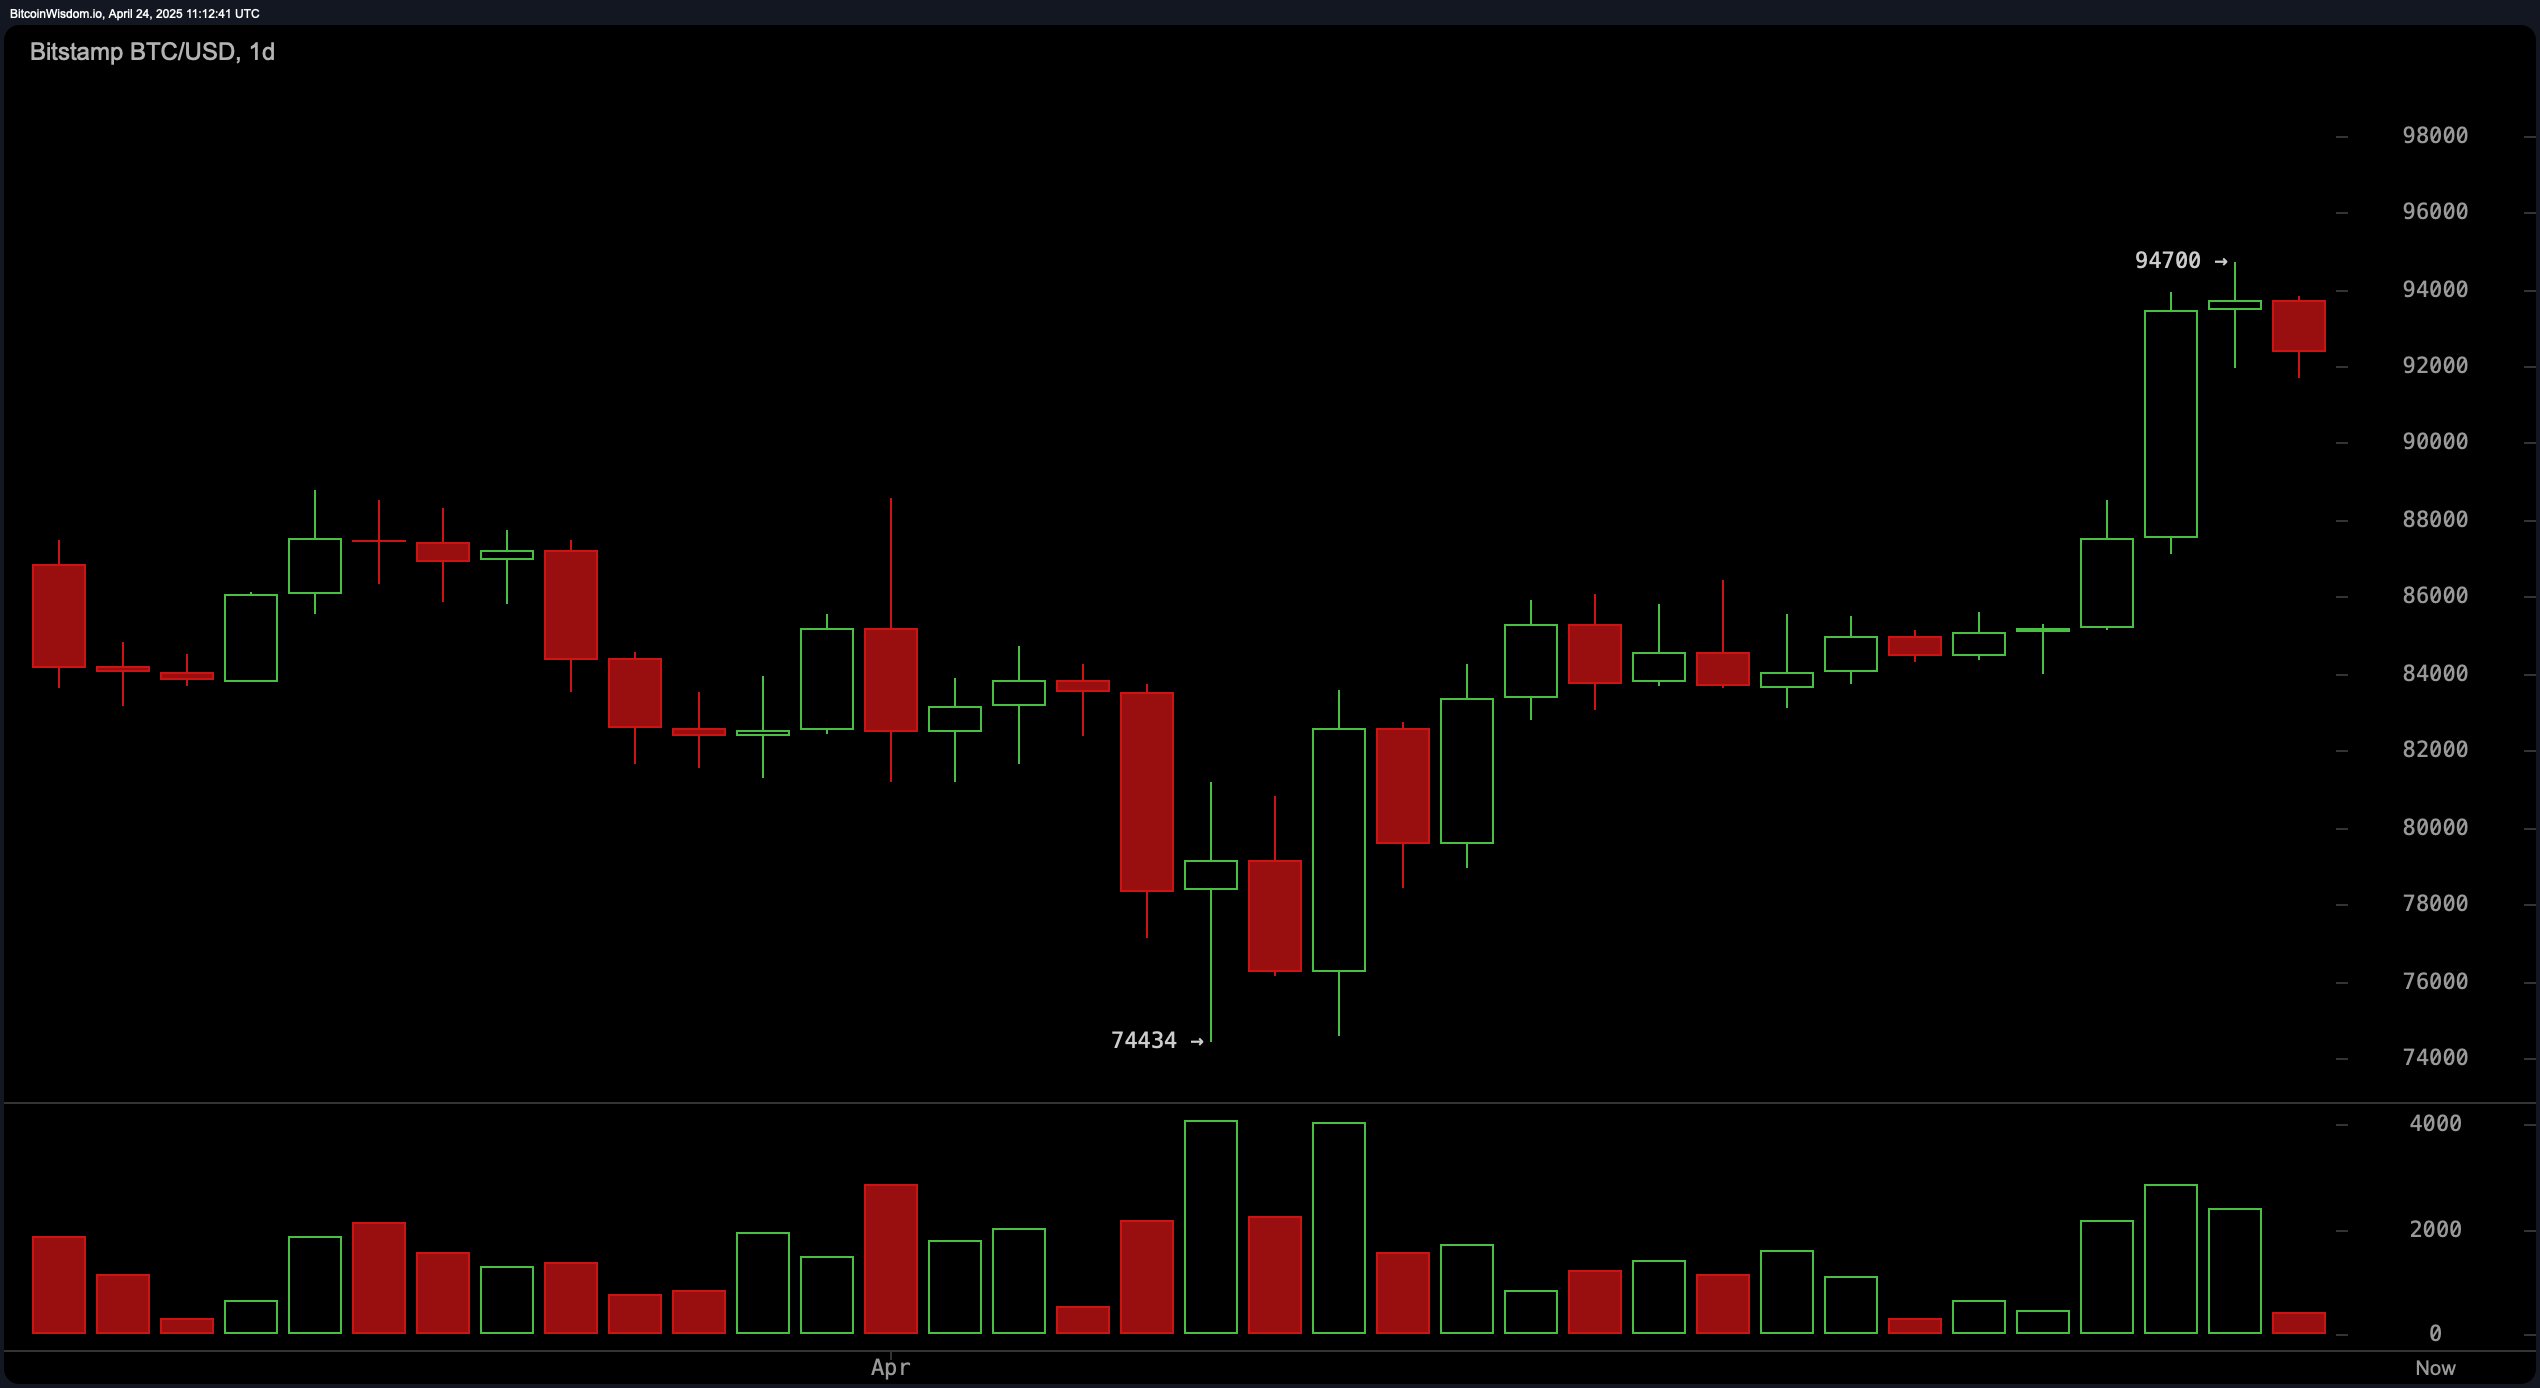
Let’s zoom out and look at the daily chart. Ah, now we see the grand spectacle of Bitcoin’s meteoric rise, from a pitiful low of $74,434 to a dazzling high of $94,700. The audience—aka, the traders—are cheering on the recovery, especially as volumes pick up and green candles light the way. But, just as the applause reaches its peak, Bitcoin hits a resistance wall at $94,700 and pulls back. If you’ve been holding on tight, it might be time to consider cashing out between $94,000 and $96,000, unless the breakout comes with volume, of course. For those waiting for the next entry point, consider buying around the $88,000 to $90,000 range, assuming a retracement takes shape with weak selling volume.
Now, let’s bring in the oscillators, the mysterious behind-the-scenes cast of the Bitcoin show. The Relative Strength Index (RSI) is just chilling at 64, meaning Bitcoin isn’t overly hot or cold—just… comfortable. Meanwhile, the Stochastic oscillator at 92 and the Commodity Channel Index (CCI) at 187 are practically waving the “overbought” flag. They’ve seen enough action for one day. On the other hand, the Momentum Oscillator at 7,842 is sending out signals that say, “Hold your horses, there’s more bullish juice to squeeze.” But wait—plot twist! The Moving Average Convergence Divergence (MACD) is still leaning bullish, so we can’t totally dismiss the idea that the bulls might be lurking in the background.
As for the moving averages—oh, they’re practically screaming “uptrend!” Every time frame from the 10-period to the 200-period EMAs and SMAs are giving thumbs up to the bullish party. The 10-period EMAs and SMAs are holding the line near $88,552 and $87,455, reinforcing immediate support. For those in it for the long haul, the 200-period EMA at $85,274 and SMA at $88,689 are keeping the bullish foundation solid, like the well-fortified walls of a castle.
Now, let’s talk Fibonacci retracements. They’ve got a penchant for spotting support levels during pullbacks. The daily chart highlights the 0.500 level at $84,567 and the 0.618 level at $82,176—if Bitcoin drops, these are the spots where you might want to check for a recovery. The four-hour chart adds drama with a cluster between $89,000 and $90,500, which could be a turning point. But wait for it—on the one-hour chart, the 0.618 level at $92,846 is the big scene-stealer. If Bitcoin can stay above $92,800, it might just give us the short-term bullish move we’ve all been waiting for.
The Bull Verdict:
Bitcoin is still riding high on a solid bullish trend. With moving averages across all periods giving the green light, and a nice bounce off lower supports, the uptrend seems to be in full force. If Bitcoin stabilizes above key Fibonacci levels like $92,800 and buying volume picks up, we might just see another attempt to break through the $96,000 resistance. Don’t say we didn’t warn you when it happens.
The Bear Verdict:
But hold on a second—let’s not forget about the bears. Despite the bullish crowd cheering, the oscillators and some short-term charts are showing signs of exhaustion. The high stochastic readings and the distribution patterns on lower timeframes indicate that a pullback could be in the cards. If Bitcoin can’t keep its support above $91,700 and the selling pressure grows, we might be revisiting the $88,000 zone or even lower. Let’s hope the bulls can hold their ground!
Final Take:
Bitcoin’s current situation is like a rollercoaster ride. While it’s holding up well overall, with solid moving averages and key support levels, the oscillators are throwing a bit of a wrench into the smooth sailing. Traders, keep your wits about you—stay bullish but be ready for some volatility. Bitcoin’s fate might hinge on that crucial $92,800 pivot point.
Read More
- Best Awakened Hollyberry Build In Cookie Run Kingdom
- AI16Z PREDICTION. AI16Z cryptocurrency
- Tainted Grail the Fall of Avalon: Should You Turn in Vidar?
- Nintendo Offers Higher Margins to Japanese Retailers in Switch 2 Push
- Best Mage Skills in Tainted Grail: The Fall of Avalon
- Nintendo Switch 2 Confirms Important Child Safety Feature
- Nintendo May Be Struggling to Meet Switch 2 Demand in Japan
- Top 8 UFC 5 Perks Every Fighter Should Use
- Nintendo Dismisses Report On Switch 2 Retailer Profit Margins
- Nvidia Reports Record Q1 Revenue
2025-04-24 16:04