Well, here we are, folks. Bitcoin‘s 4-hour chart is about to change in a way that doesn’t come around all that often. The little 23-period moving average, that green line creeping up, has been making its way toward the big red 200-period line. And now? The gap between them is so small, you’d be hard-pressed to find a slip of paper between them. It’s almost certain that they’re about to meet. A true rendezvous of technical destiny.
Now, if you’re into charts and numbers (and who isn’t?), this is what the experts call a golden cross. Sounds fancy, doesn’t it? It’s like the chart version of a light bulb going off, signaling that the market is probably ready to head “north.” Not like, “north” north, but you know-up. Into the sky. 🚀
But wait, there’s more. Just yesterday, Bitcoin had itself a nice little jump. It went from about $116,600 to almost $118,600, in one fell swoop. It broke through a ceiling the market had been banging its head against for days. A ceiling, folks! Isn’t that adorable? The market just couldn’t take it anymore and broke free. 🏃♂️💨
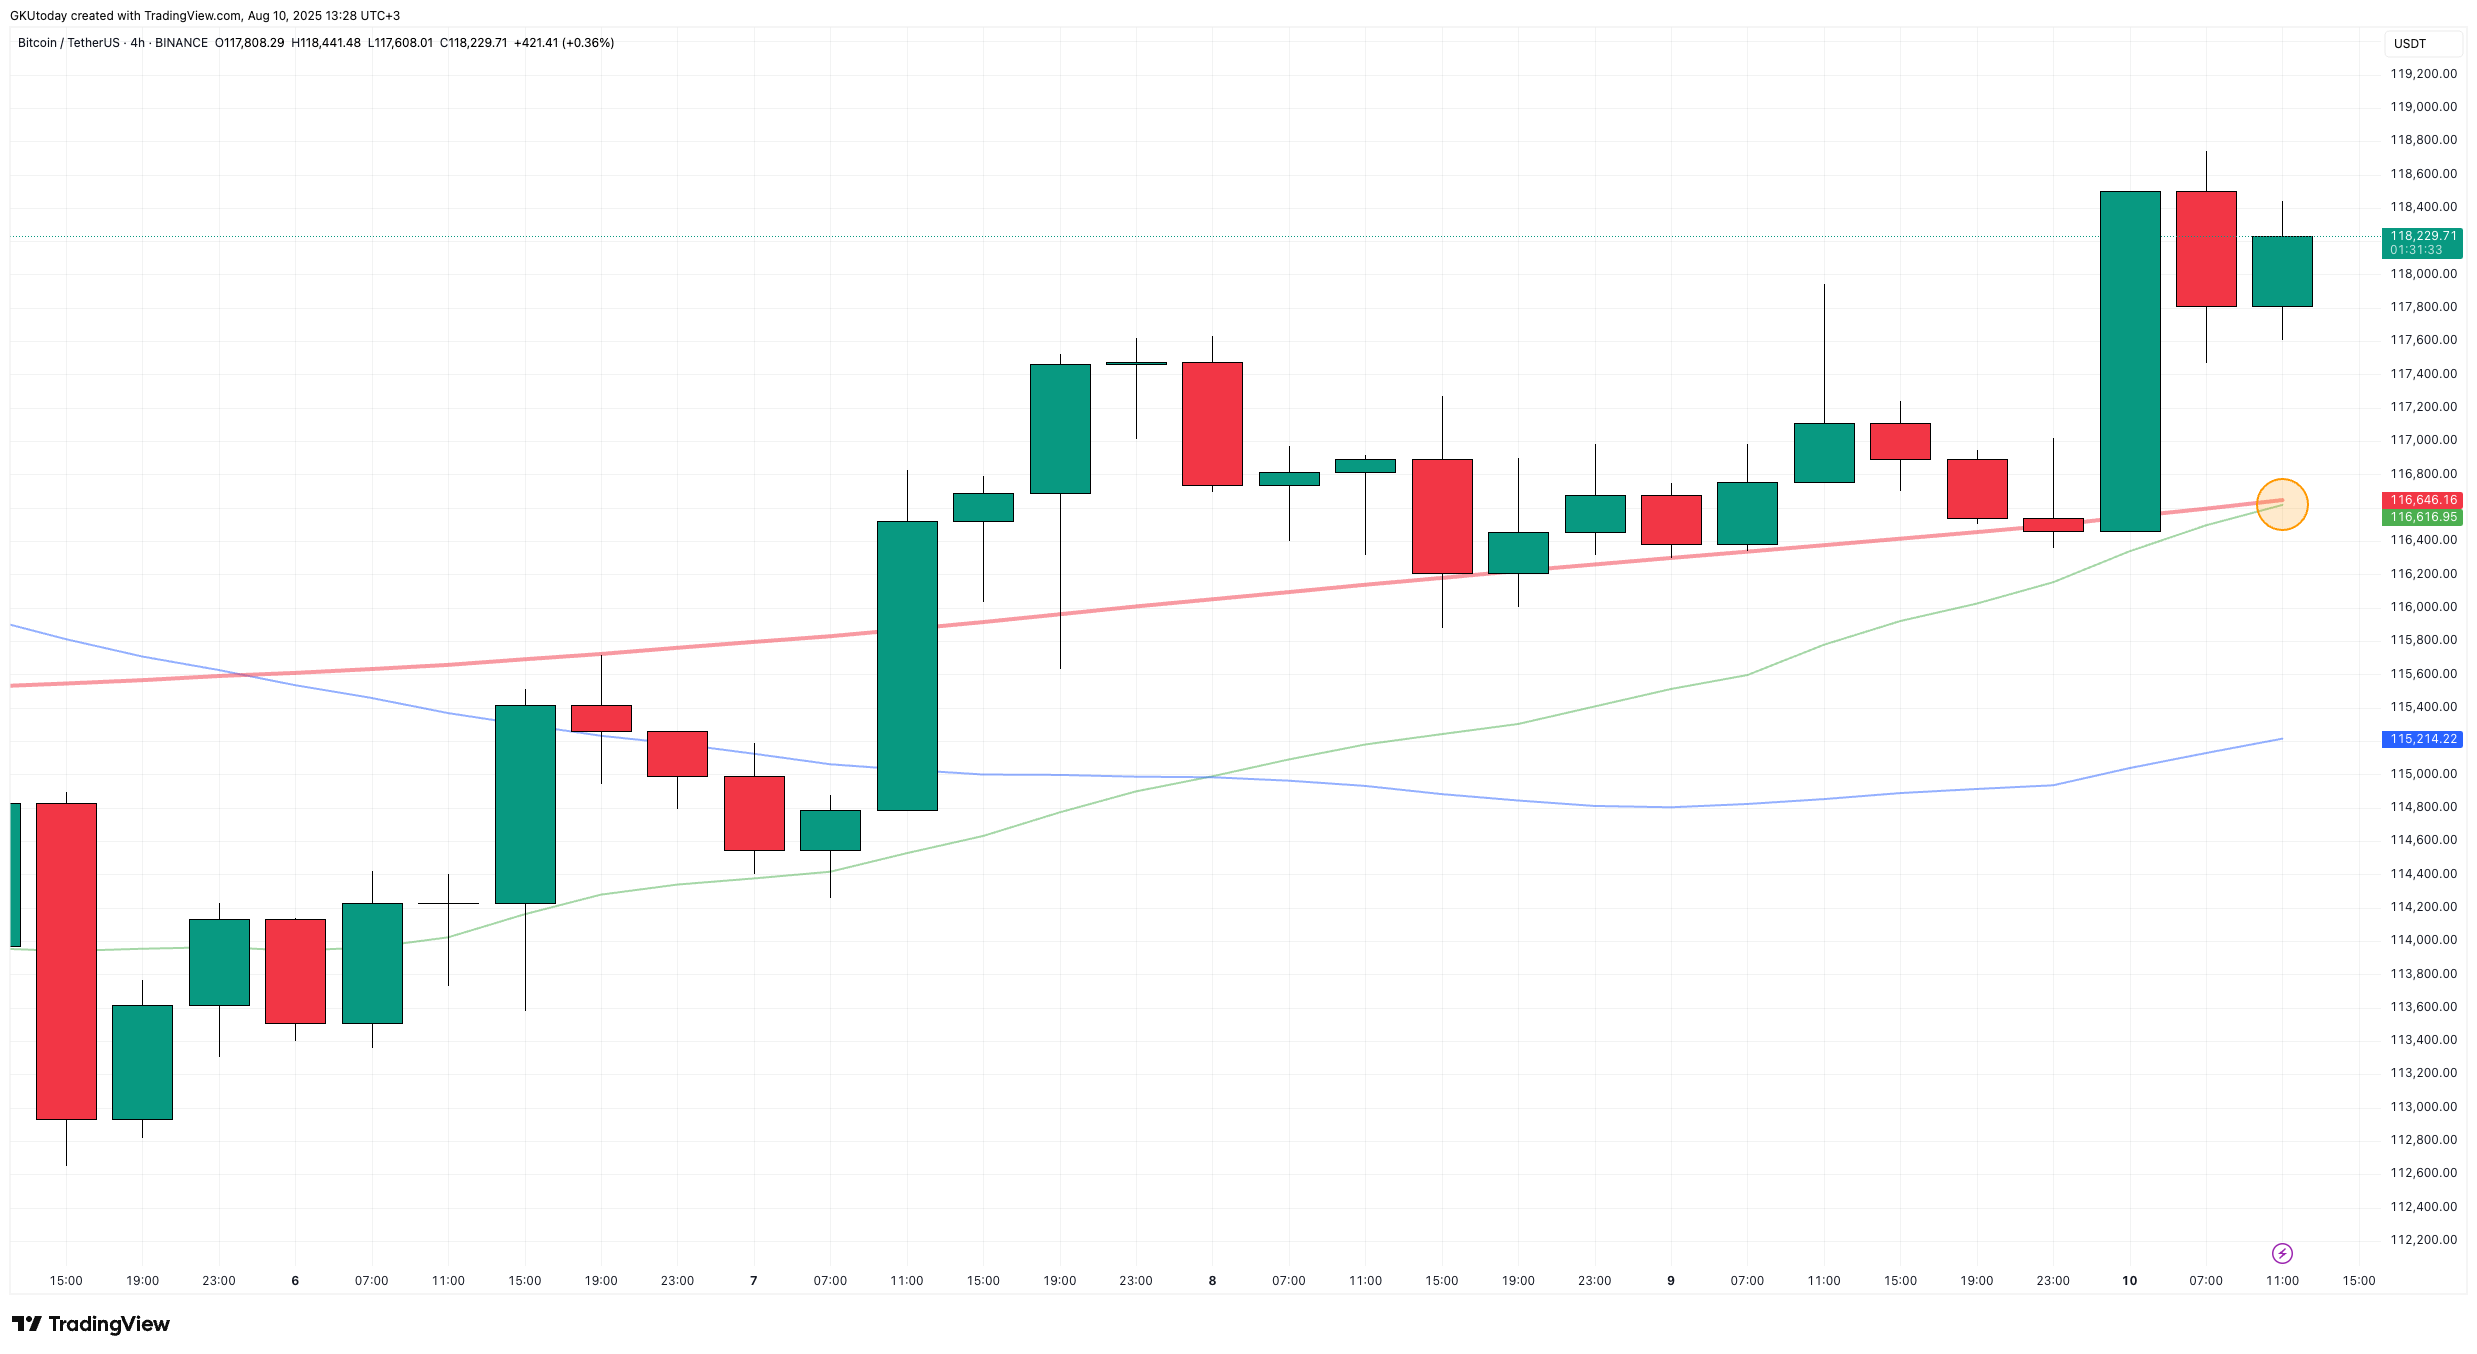
Now, in the world of 4-hour charts, these little crossovers aren’t always the crystal ball you’d hope for, but it’s definitely a sign that buyers might be starting to outmuscle the sellers. What does that mean? It means we might just be seeing the calm before the big storm. Or the exciting part. Or maybe it’s just another Tuesday, who knows. 🤷♂️
What’s next for BTC price?
Alright, so what’s on the horizon for Bitcoin? If it can stay above the $117,500-$118,000 mark through the weekend, we might see this golden cross thing happen by Monday. What happens after that? Well, we could be looking at a test of $119,000 and $120,000. Those are the final hurdles before the big, shiny all-time high. Imagine it-Bitcoin, living its best life at a price that makes everyone else jealous. 💰
But here’s the kicker-there’s a nice little cushion forming right where the moving averages meet, around $116,400. If the market dips (and let’s face it, it will), this spot might just be the perfect place for another attempt at climbing higher. It’s like the market’s version of a safety net, except it’s made of numbers and graphs and hopes. And since it’s the weekend, there might be fewer traders around, which means sharp moves can get even sharper. Exciting, right? 😬
So, the next 48 hours? It’s all about the wait and see. Can the market turn this chart crossover into something bigger when the new week rolls around? Or will we just end up watching Bitcoin play hopscotch on the same prices? Stay tuned, folks. We’re in for a wild ride.
Read More
- All Skyblazer Armor Locations in Crimson Desert
- One Piece Chapter 1180 Release Date And Where To Read
- How to Get the Sunset Reed Armor Set and Hollow Visage Sword in Crimson Desert
- All Shadow Armor Locations in Crimson Desert
- All Golden Greed Armor Locations in Crimson Desert
- How to Beat Stonewalker Antiquum at the Gate of Truth in Crimson Desert
- Cassius Morten Armor Set Locations in Crimson Desert
- Grime 2 Map Unlock Guide: Find Seals & Fast Travel
- USD RUB PREDICTION
- Marni Laser Helm Location & Upgrade in Crimson Desert
2025-08-10 15:34