Ah, Bitcoin, darling! Currently sashaying at $102,848, with a market capitalization of $2.05 trillion and a 24-hour trading volume of $59.85 billion. The intraday price range, my dear, is a mere $102,349 to $104,412-a narrow band of volatility, as if the market is sipping tea and pondering its next move. 🍵✨
Bitcoin Chart Outlook
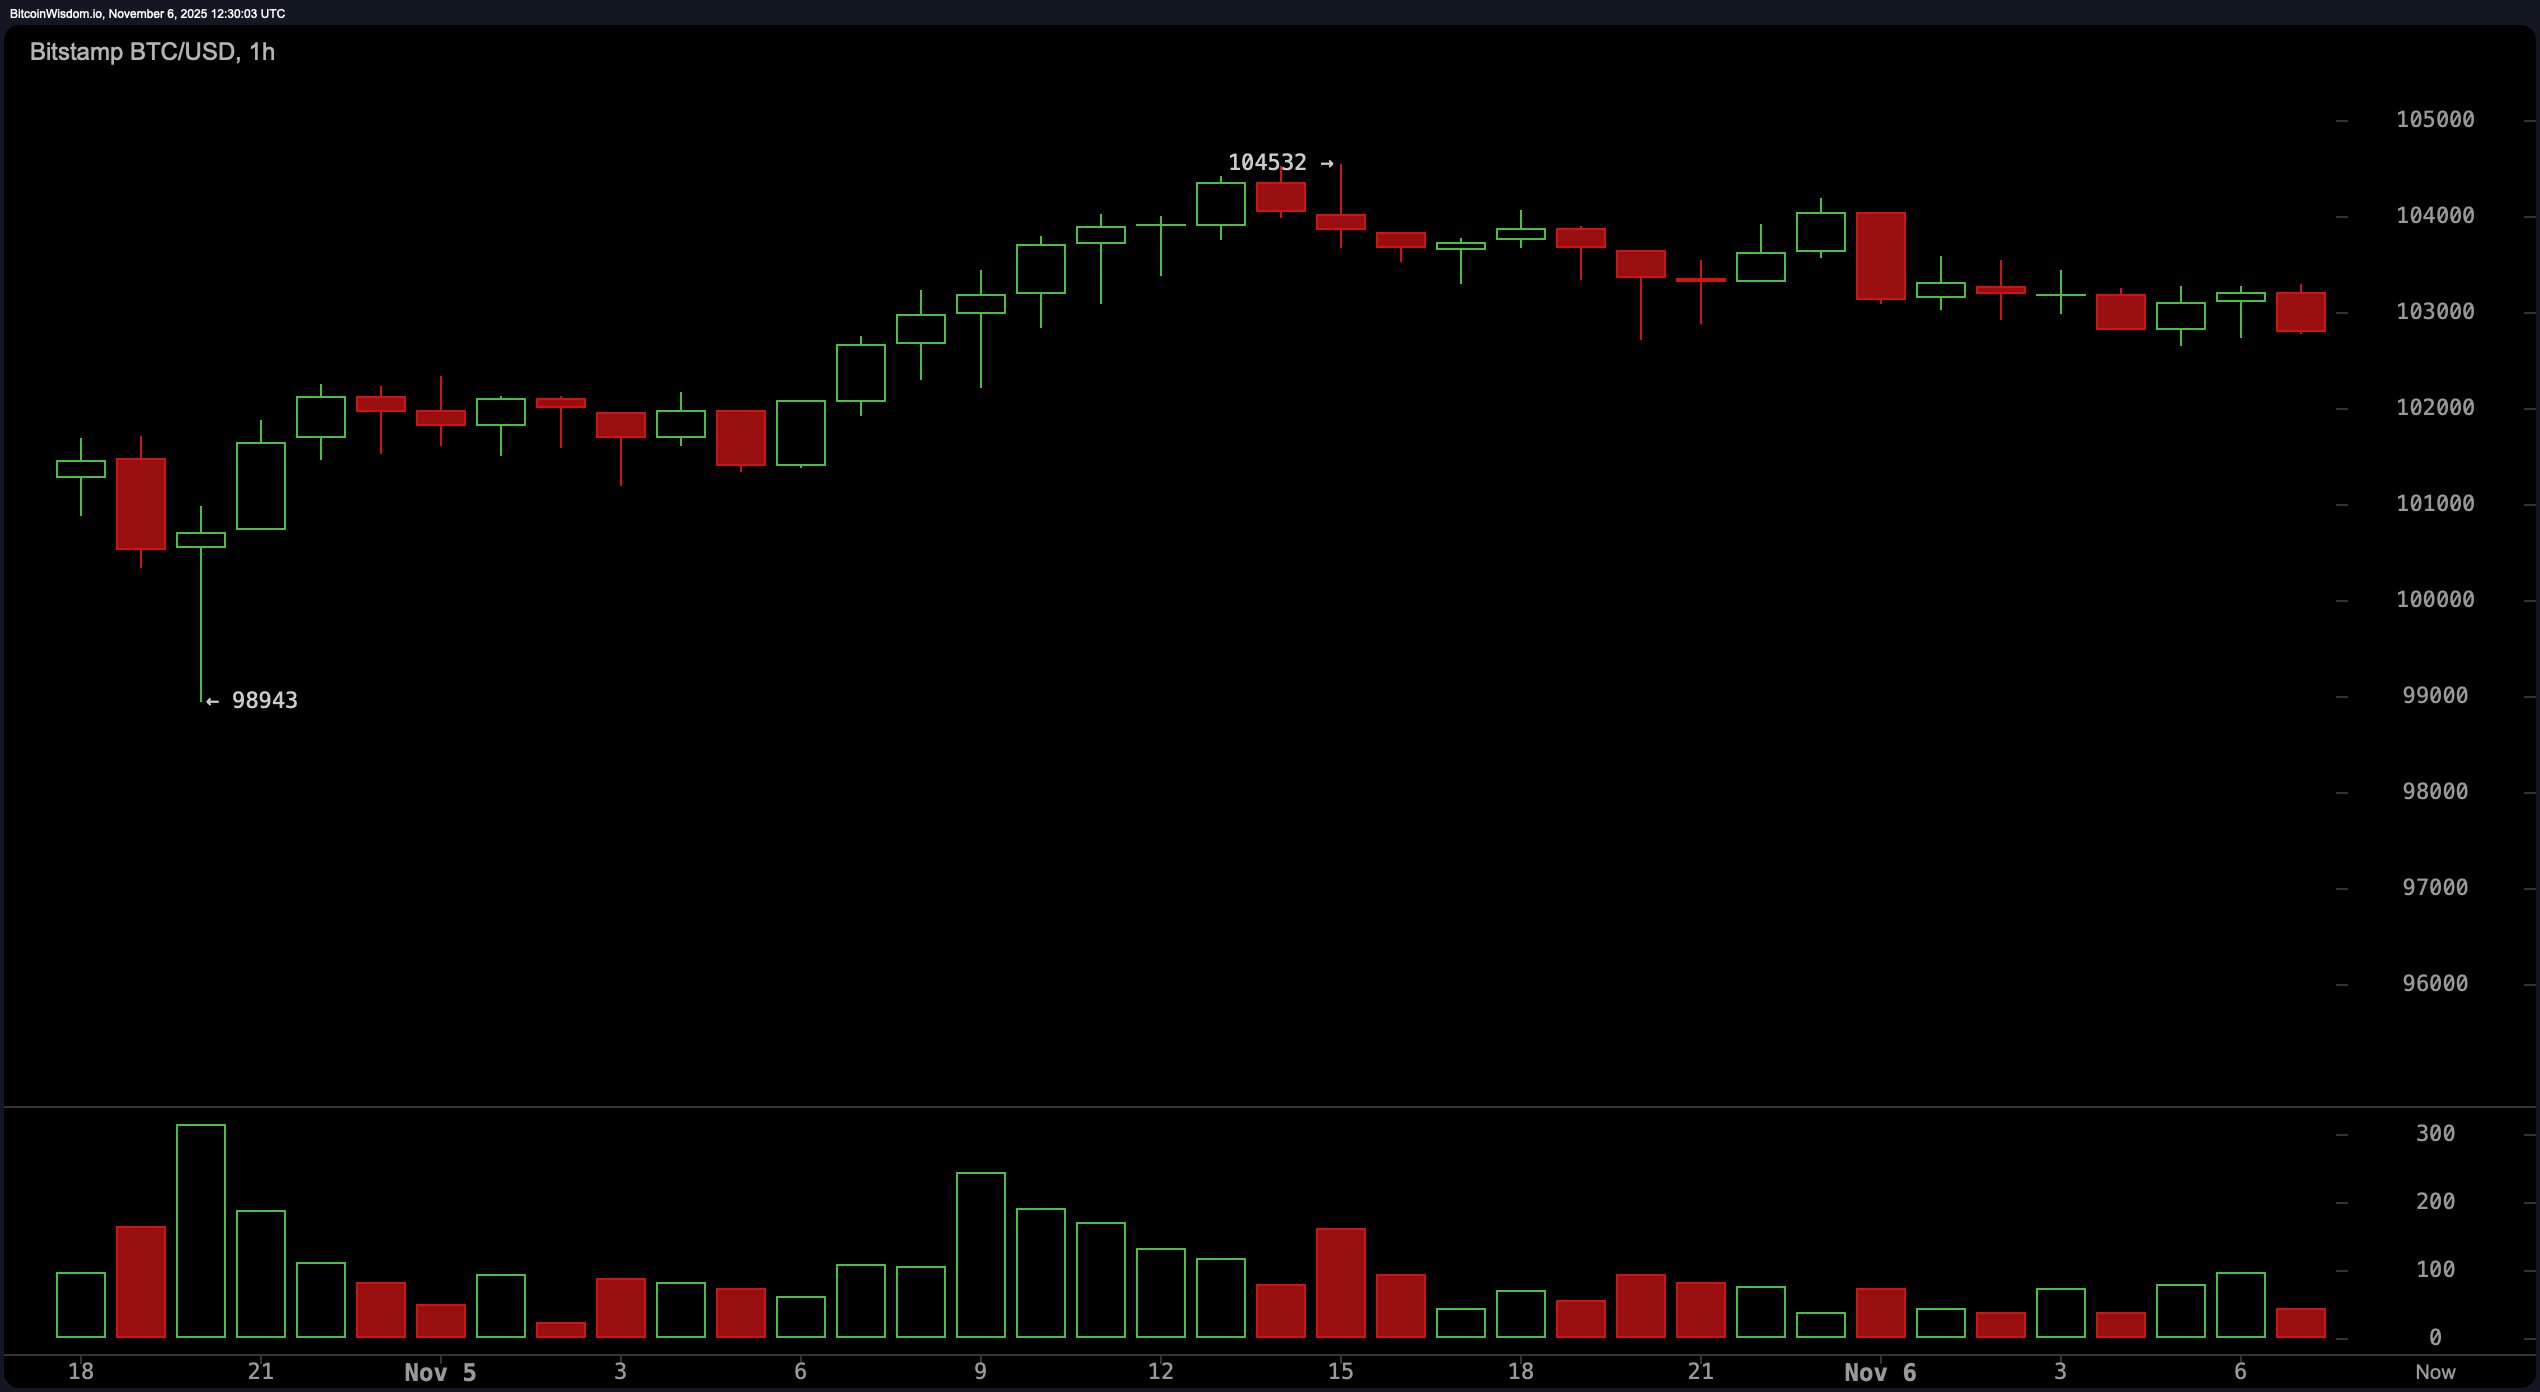
The 1-hour chart, my loves, reveals a microstructure as dramatic as a Coward play-a V-shaped recovery following a sharp downward flush below $99,000. The rebound, while swift, has since slowed into a sideways range, defined by lower highs and weakening volume. Buyer fatigue, darlings? It’s as clear as a martini at midnight. 🍸
Support, my dears, lingers near $98,900, where the last dip attracted buyers like moths to a flame. Resistance, meanwhile, is forming near $104,500. Without a substantial uptick in volume, further upward movement seems as likely as a snowstorm in Sahara. Traders, of course, are watching the $100,000 to $101,000 zone with bated breath-or is it boredom? 😴
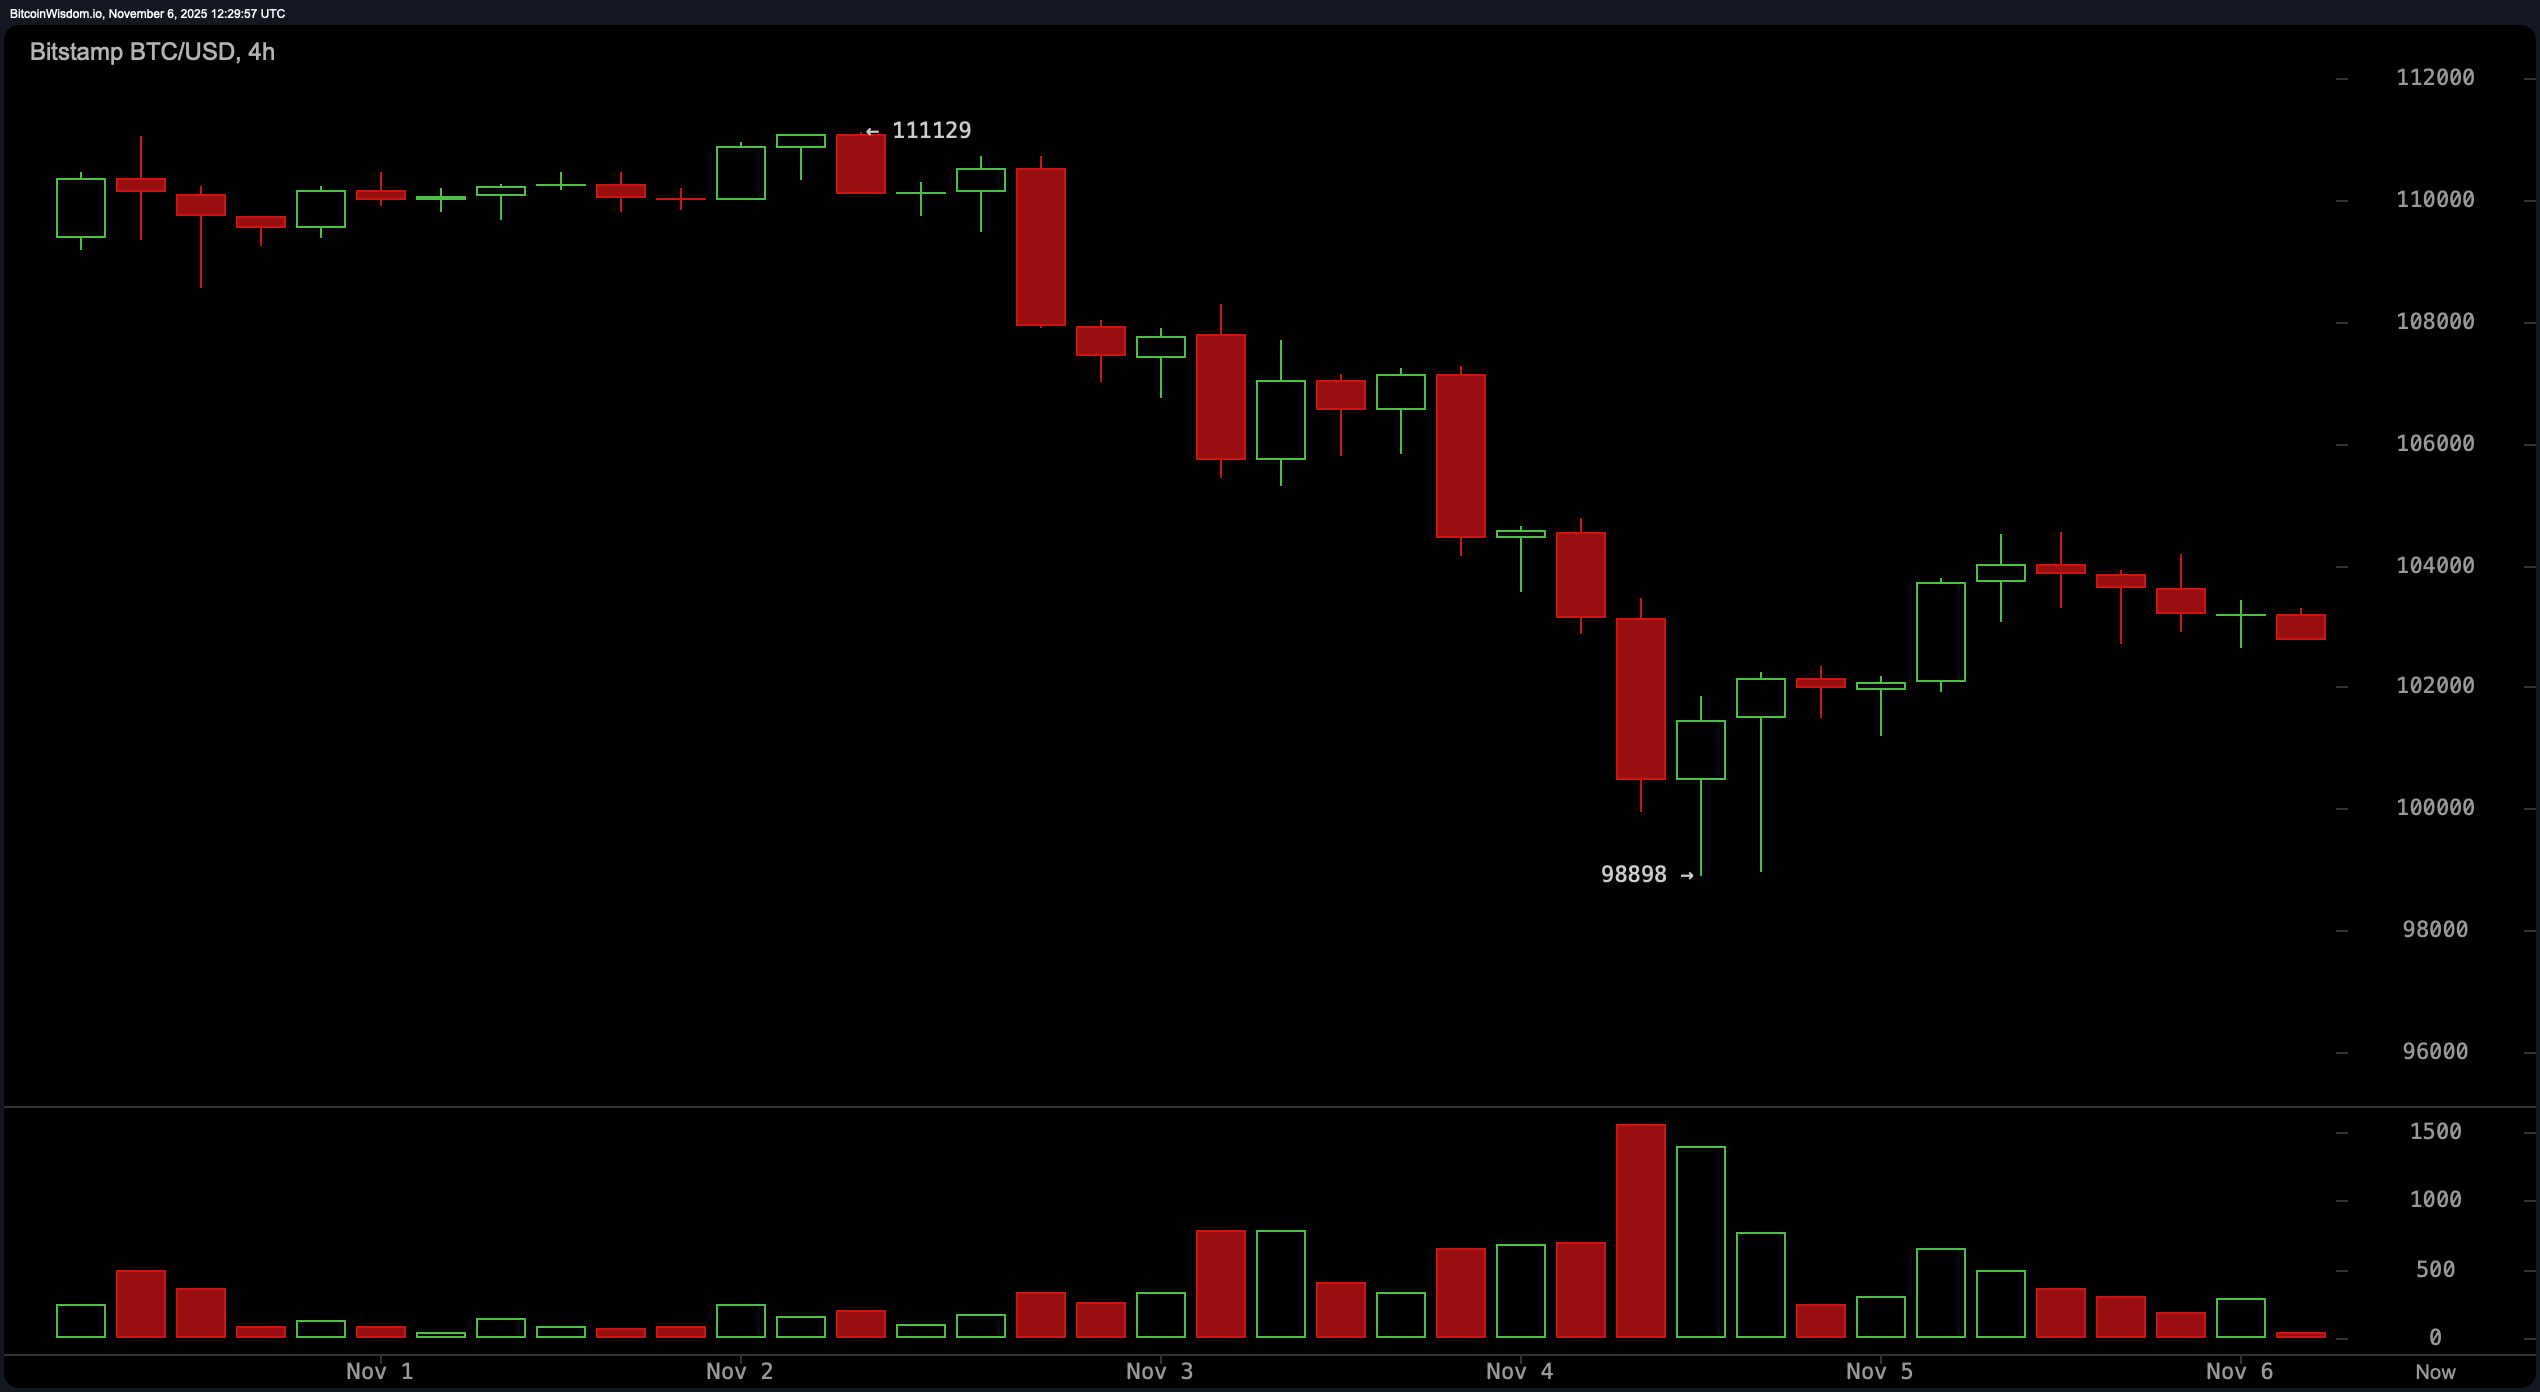
On the 4-hour chart, Bitcoin continues its descent within a channel as bearish as a Coward wit. The top, near $111,129, was rejected with all the grace of a spurned lover, while the bottom at $98,898 is reinforced by buying activity. Despite a relief rally, the lack of follow-through suggests a distribution phase. Holding above $101,000 is critical-fail, and we’re probing below $99,000 again. Reclaim $106,000 with volume, though, and we might just have a short-term upside. 🌟
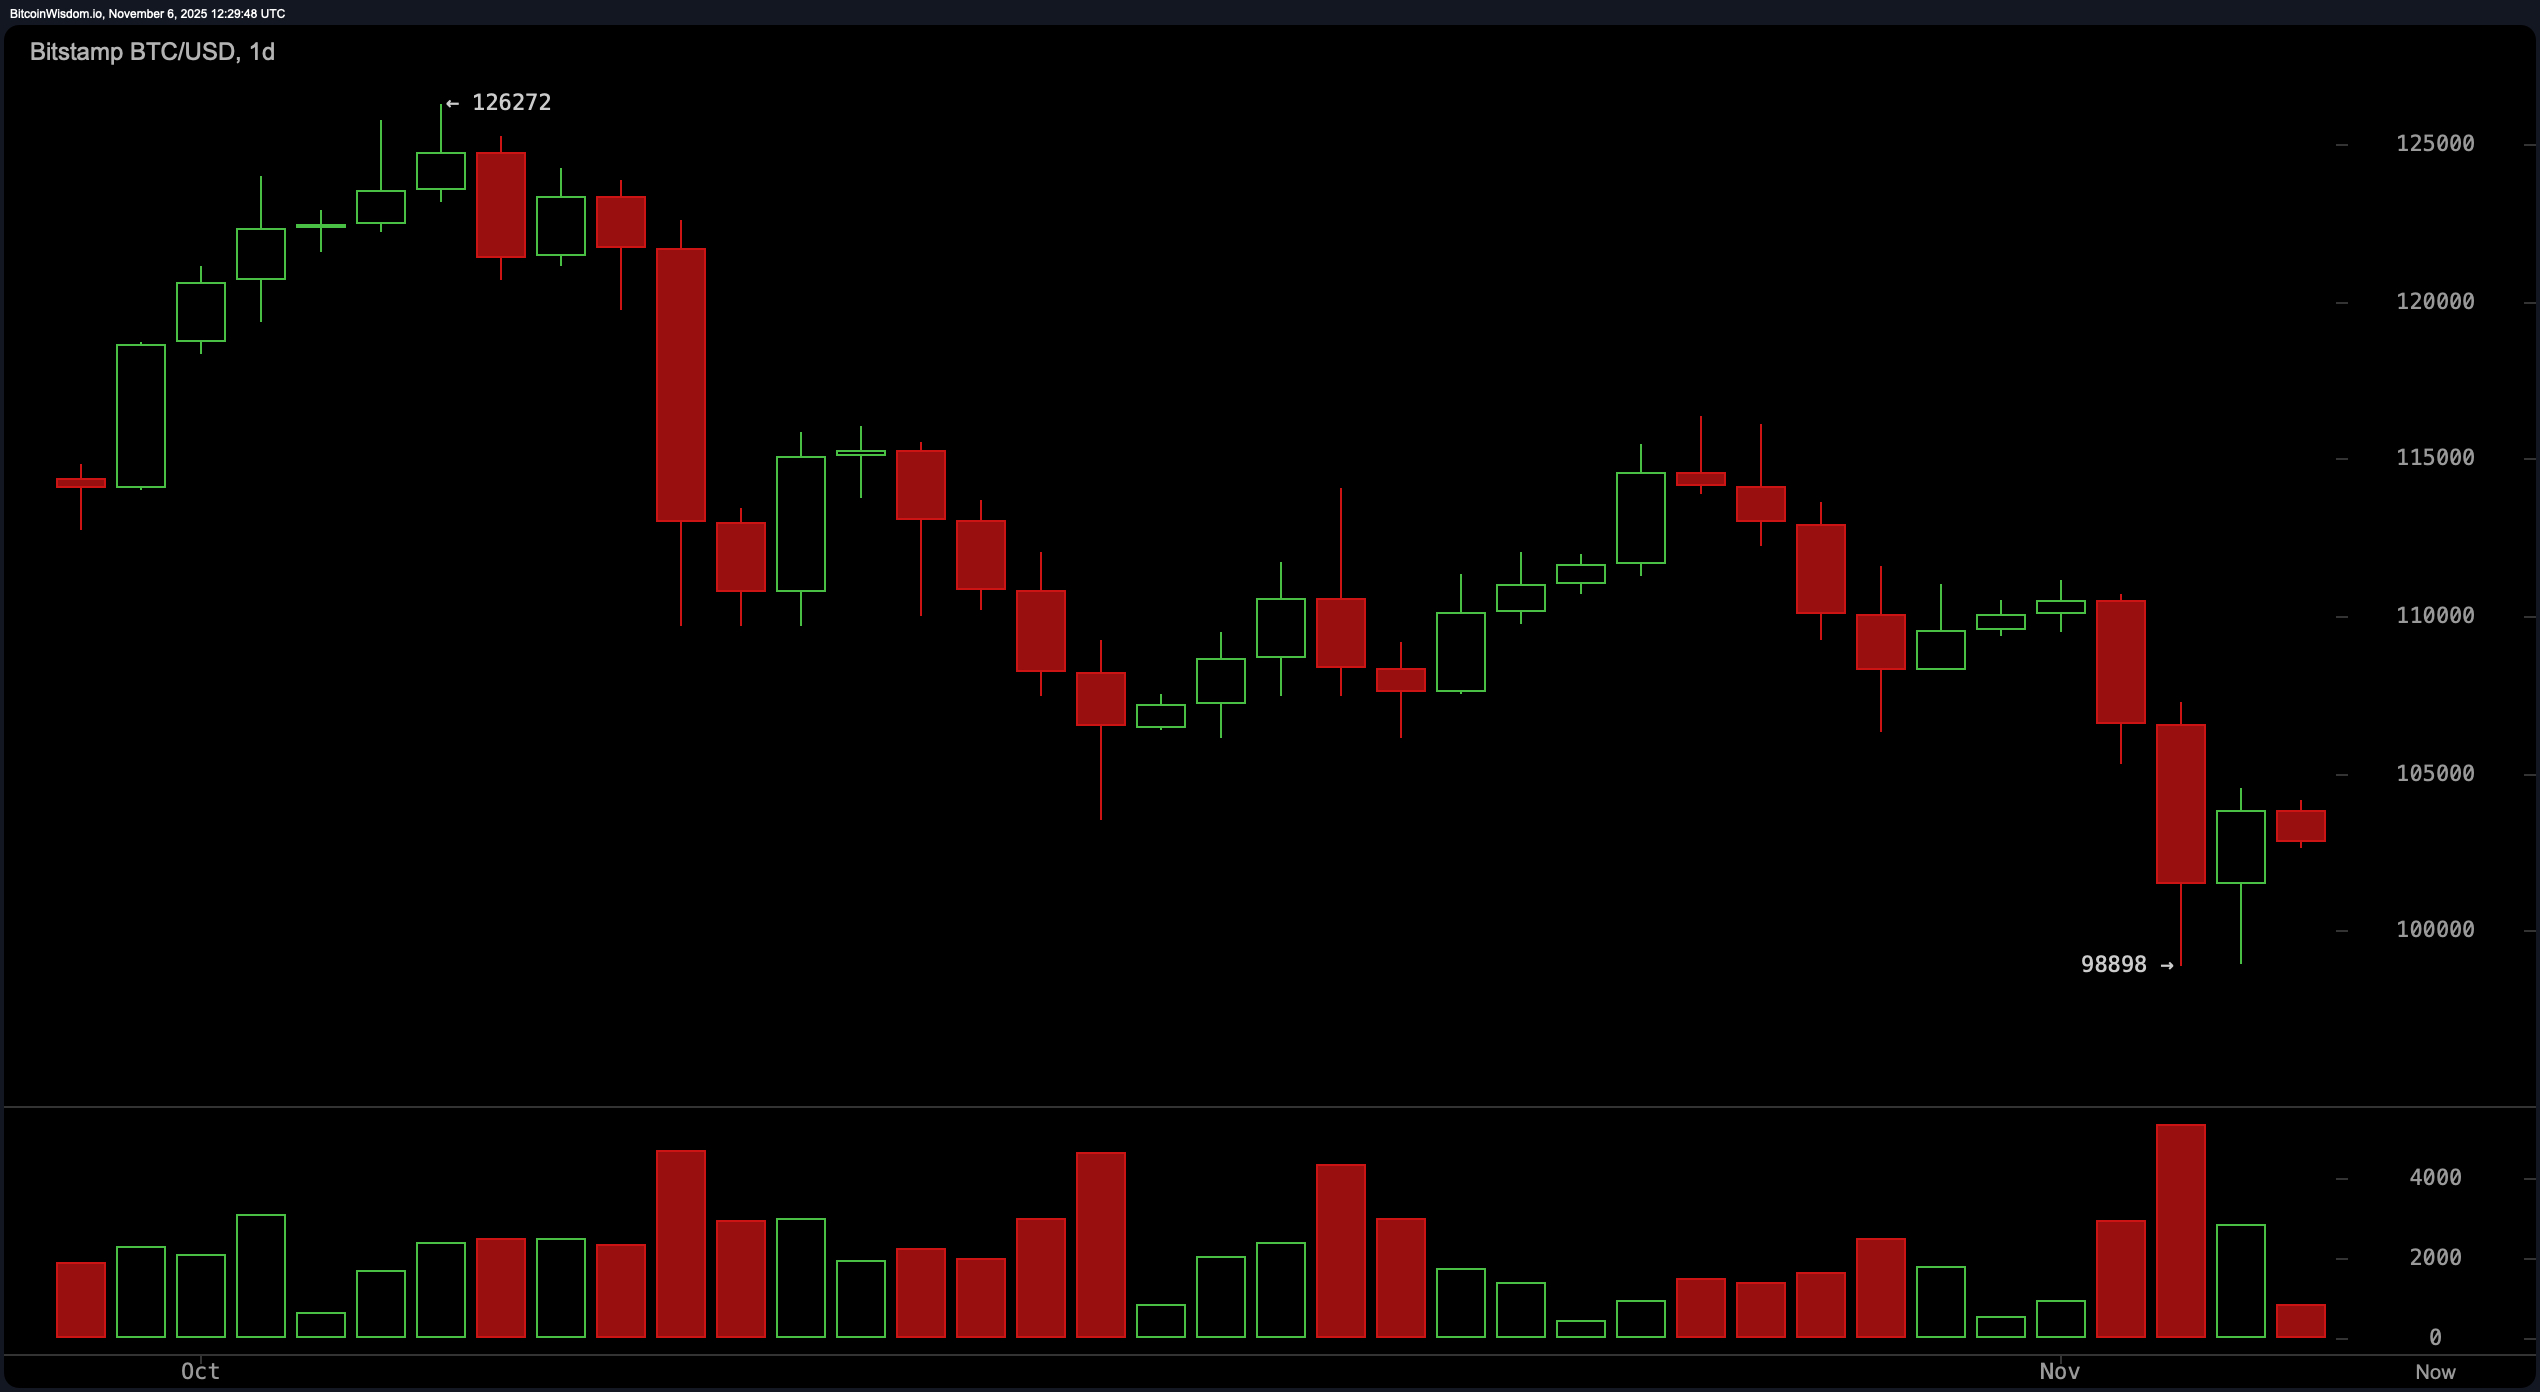
The daily chart, my darlings, paints a macro bearish narrative as pronounced as a Coward quip. Lower highs, lower lows-it’s a consistent series, like a bad habit. The rejection from $126,272 has cascaded into downward pressure, with $98,898 acting as a vital support floor. Consolidation near $103,000 lacks bullish volume, suggesting indecision. A daily close above $108,000 to $110,000 is needed to break the pattern. Until then, it’s all just a waiting game. ⏳
Technically speaking, oscillators are as indecisive as a Coward protagonist. RSI at 36? Neutral. Stochastic at 22? Neutral. CCI at −153? A lone voice crying for upside. Momentum at −11,314 and MACD at −2,375? Downward bias, darlings. The Awesome oscillator reads −6,986, and ADX at 22 suggests weak trend strength. It’s all rather meh. 😑
Moving averages, my loves, are as bearish as a Coward monologue. All major EMAs and SMAs from 10-period to 200-period are above the spot price, indicating downside pressure. Bitcoin must overcome these layers of resistance-$106,667, $108,228, $107,611, $110,136-to shift sentiment. Good luck, darling! 🍀
If Bitcoin maintains above $98,000 and breaks $110,000 on rising volume, the technical landscape could shift in favor of a recovery. A close above this level would disrupt the downtrend and signal renewed accumulation, potentially targeting $120,000. 🌈
Bear Verdict:
Should Bitcoin lose $98,000, the downtrend will accelerate, targeting $92,000 to $94,000. With moving averages and momentum indicators bearish, the path of least resistance remains lower-unless a clear reversal develops. 🐻
FAQ
- Where is Bitcoin trading now?
Bitcoin is trading around $102,848 as of Nov. 6, 2025. 📉 - What’s the current support level?
Key support is near $98,000, tested multiple times recently. 🛡️ - What price zone signals a trend reversal?
A move above $110,000 with volume may indicate a reversal. 🚀 - Do indicators suggest further downside?
Most moving averages and momentum indicators point to continued bearish pressure. ⚠️
Read More
- All Skyblazer Armor Locations in Crimson Desert
- All Shadow Armor Locations in Crimson Desert
- How to Get the Sunset Reed Armor Set and Hollow Visage Sword in Crimson Desert
- Marni Laser Helm Location & Upgrade in Crimson Desert
- All Golden Greed Armor Locations in Crimson Desert
- All Helfryn Armor Locations in Crimson Desert
- Best Bows in Crimson Desert
- Keeping Large AI Models Connected Through Network Chaos
- All Icewing Armor Locations in Crimson Desert
- How to Craft the Elegant Carmine Armor in Crimson Desert
2025-11-06 16:33