Ah, Bitcoin, the digital gold that’s currently doing the financial equivalent of tripping over its own feet while trying to look cool. There it sits, perched just above the $66,900 mark like a wizard balancing on a broomstick that’s seen better days. And what’s this? A bear flag forming on the 4H chart? Oh, the humanity! Or should I say, the bearity? Meanwhile, the daily MACD is sulking in the corner with its deepest frown in months, muttering something about “$63,000” and “Good Friday liquidity” like a soothsayer predicting the end of the world.
- Bitcoin, currently at $66,891, is clinging to a broken support level like a drunkard to a lamppost after a night out. Its March peak of $76,000 feels like a distant memory, probably because it is.
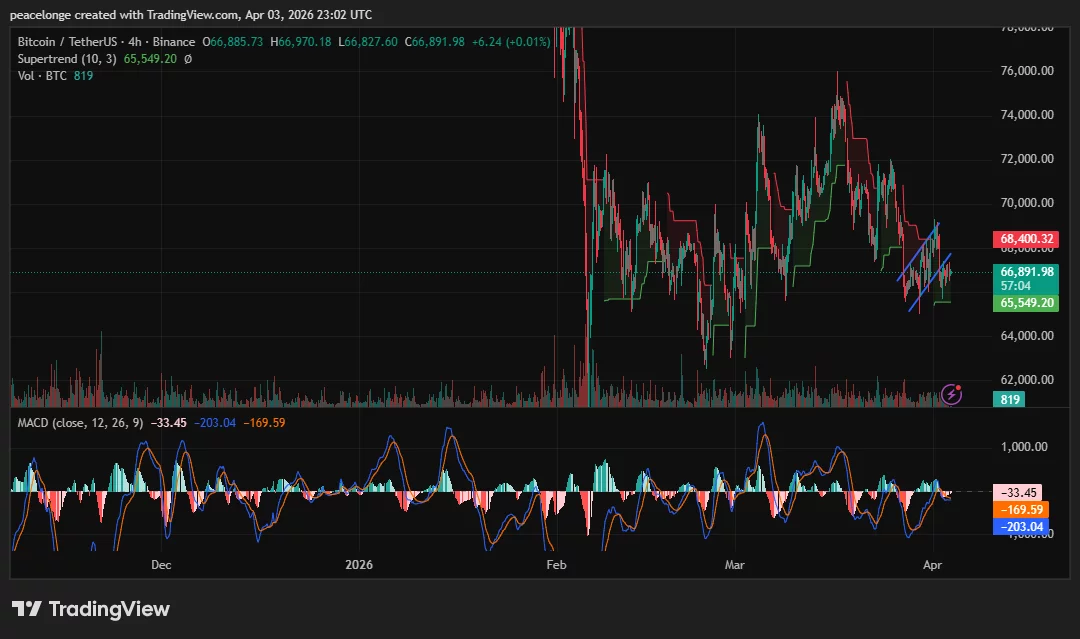
- The 4H chart has decided to throw a party with a small ascending channel, but everyone’s whispering it’s just a bear flag in disguise. The daily MACD histogram is at -639, which is about as cheerful as a tax audit on a Monday morning.
- If $65,549 doesn’t hold, $63,000 is the next stop on this wild rollercoaster. But hey, a daily close above $68,400 might just save the day-or at least delay the inevitable.
On April 3, 2026, Bitcoin is trading at $66,891, just above the $66,188 support level it broke faster than a promise from a used-broom salesman. The daily Supertrend indicator is at $74,093, glowing red like a embarrassed troll under a sunlamp. Volume spiked during the recent sell-off, which is about as surprising as finding a dragon in a dungeon-it’s practically expected.
The 4H chart has a tiny ascending channel, which looks constructive if you squint and ignore the fact it’s sitting in a downtrend like a fish out of water. The 4H Supertrend support is at $65,549, but let’s be honest, it’s probably just biding its time before it crumbles like a poorly baked pie.
Bear Flag Shenanigans and Indicator Hijinks
A bear flag, for those not in the know, is a brief recovery that’s about as genuine as a smile from a tax collector. Bitcoin’s 4H ascending channel fits this bill perfectly: a modest recovery with a MACD histogram at -169, which is basically the financial equivalent of a raincloud at a picnic. No bullish crossover in sight, just more red than a dwarf’s wardrobe.
The daily chart is even more dramatic, with the MACD line at -862 and the signal at -223, producing a histogram of -639. Investtech’s assessment is about as cheerful as a dwarf with a hangover: “Broken trend channel, broken support, broken dreams.” The 50-day SMA and 200-day SMA are both above the current price, acting as resistance like a pair of bouncers at an exclusive club.
Key Levels, Price Targets, and Financial Folly
Immediate support is at $65,549, which is about as reliable as a weather forecast in Ankh-Morpork. A break below that and $63,000 is the next stop, with $54,000 lurking in the shadows like a loan shark. Resistance? Oh, you mean the $66,188 level that’s now as sturdy as a wet paper bag. The 4H ascending channel’s upper boundary at $68,400 is the first hurdle, but let’s not hold our breath.
A daily close above $68,400 might just save the day, but that’s about as likely as a dragon deciding to become a vegetarian.
Options Expiry and Market Madness
Around 27,600 Bitcoin options contracts expired on April 3, worth a cool $1.8 billion. Max pain is at $68,000, but with a put/call ratio of 0.55, it’s like trying to push a boulder uphill in a storm. U.S.-Iran tensions pushed oil above $100, triggering $420 million in liquidations-because nothing says “financial stability” like geopolitical chaos.
CME futures are closed for Good Friday, which is about as helpful as a chocolate teapot. CoinDCX’s research team says a daily close above $67,500 is needed for a recovery, but with the MACD looking like it’s attended too many funerals, $63,000 seems the more likely destination.
Read More
- All Shadow Armor Locations in Crimson Desert
- How to Get the Sunset Reed Armor Set and Hollow Visage Sword in Crimson Desert
- All Skyblazer Armor Locations in Crimson Desert
- Best Bows in Crimson Desert
- Marni Laser Helm Location & Upgrade in Crimson Desert
- All Helfryn Armor Locations in Crimson Desert
- All Golden Greed Armor Locations in Crimson Desert
- Wings of Iron Walkthrough in Crimson Desert
- How to Craft the Elegant Carmine Armor in Crimson Desert
- Keeping Large AI Models Connected Through Network Chaos
2026-04-04 03:08