As of this morning, March 7, 2026, Bitcoin’s trading around $68,094, but it’s been a bit of a down day – I’m seeing about a 3.3% drop over the last 24 hours. The market cap is still huge, around $1.36 trillion, and we’re seeing about $39.07 billion changing hands daily. Price action today has been between $67,495 and $70,423. Honestly, looking at the charts, things are pointing towards a bit of a longer-term downward trend right now.
Bitcoin Chart Outlook
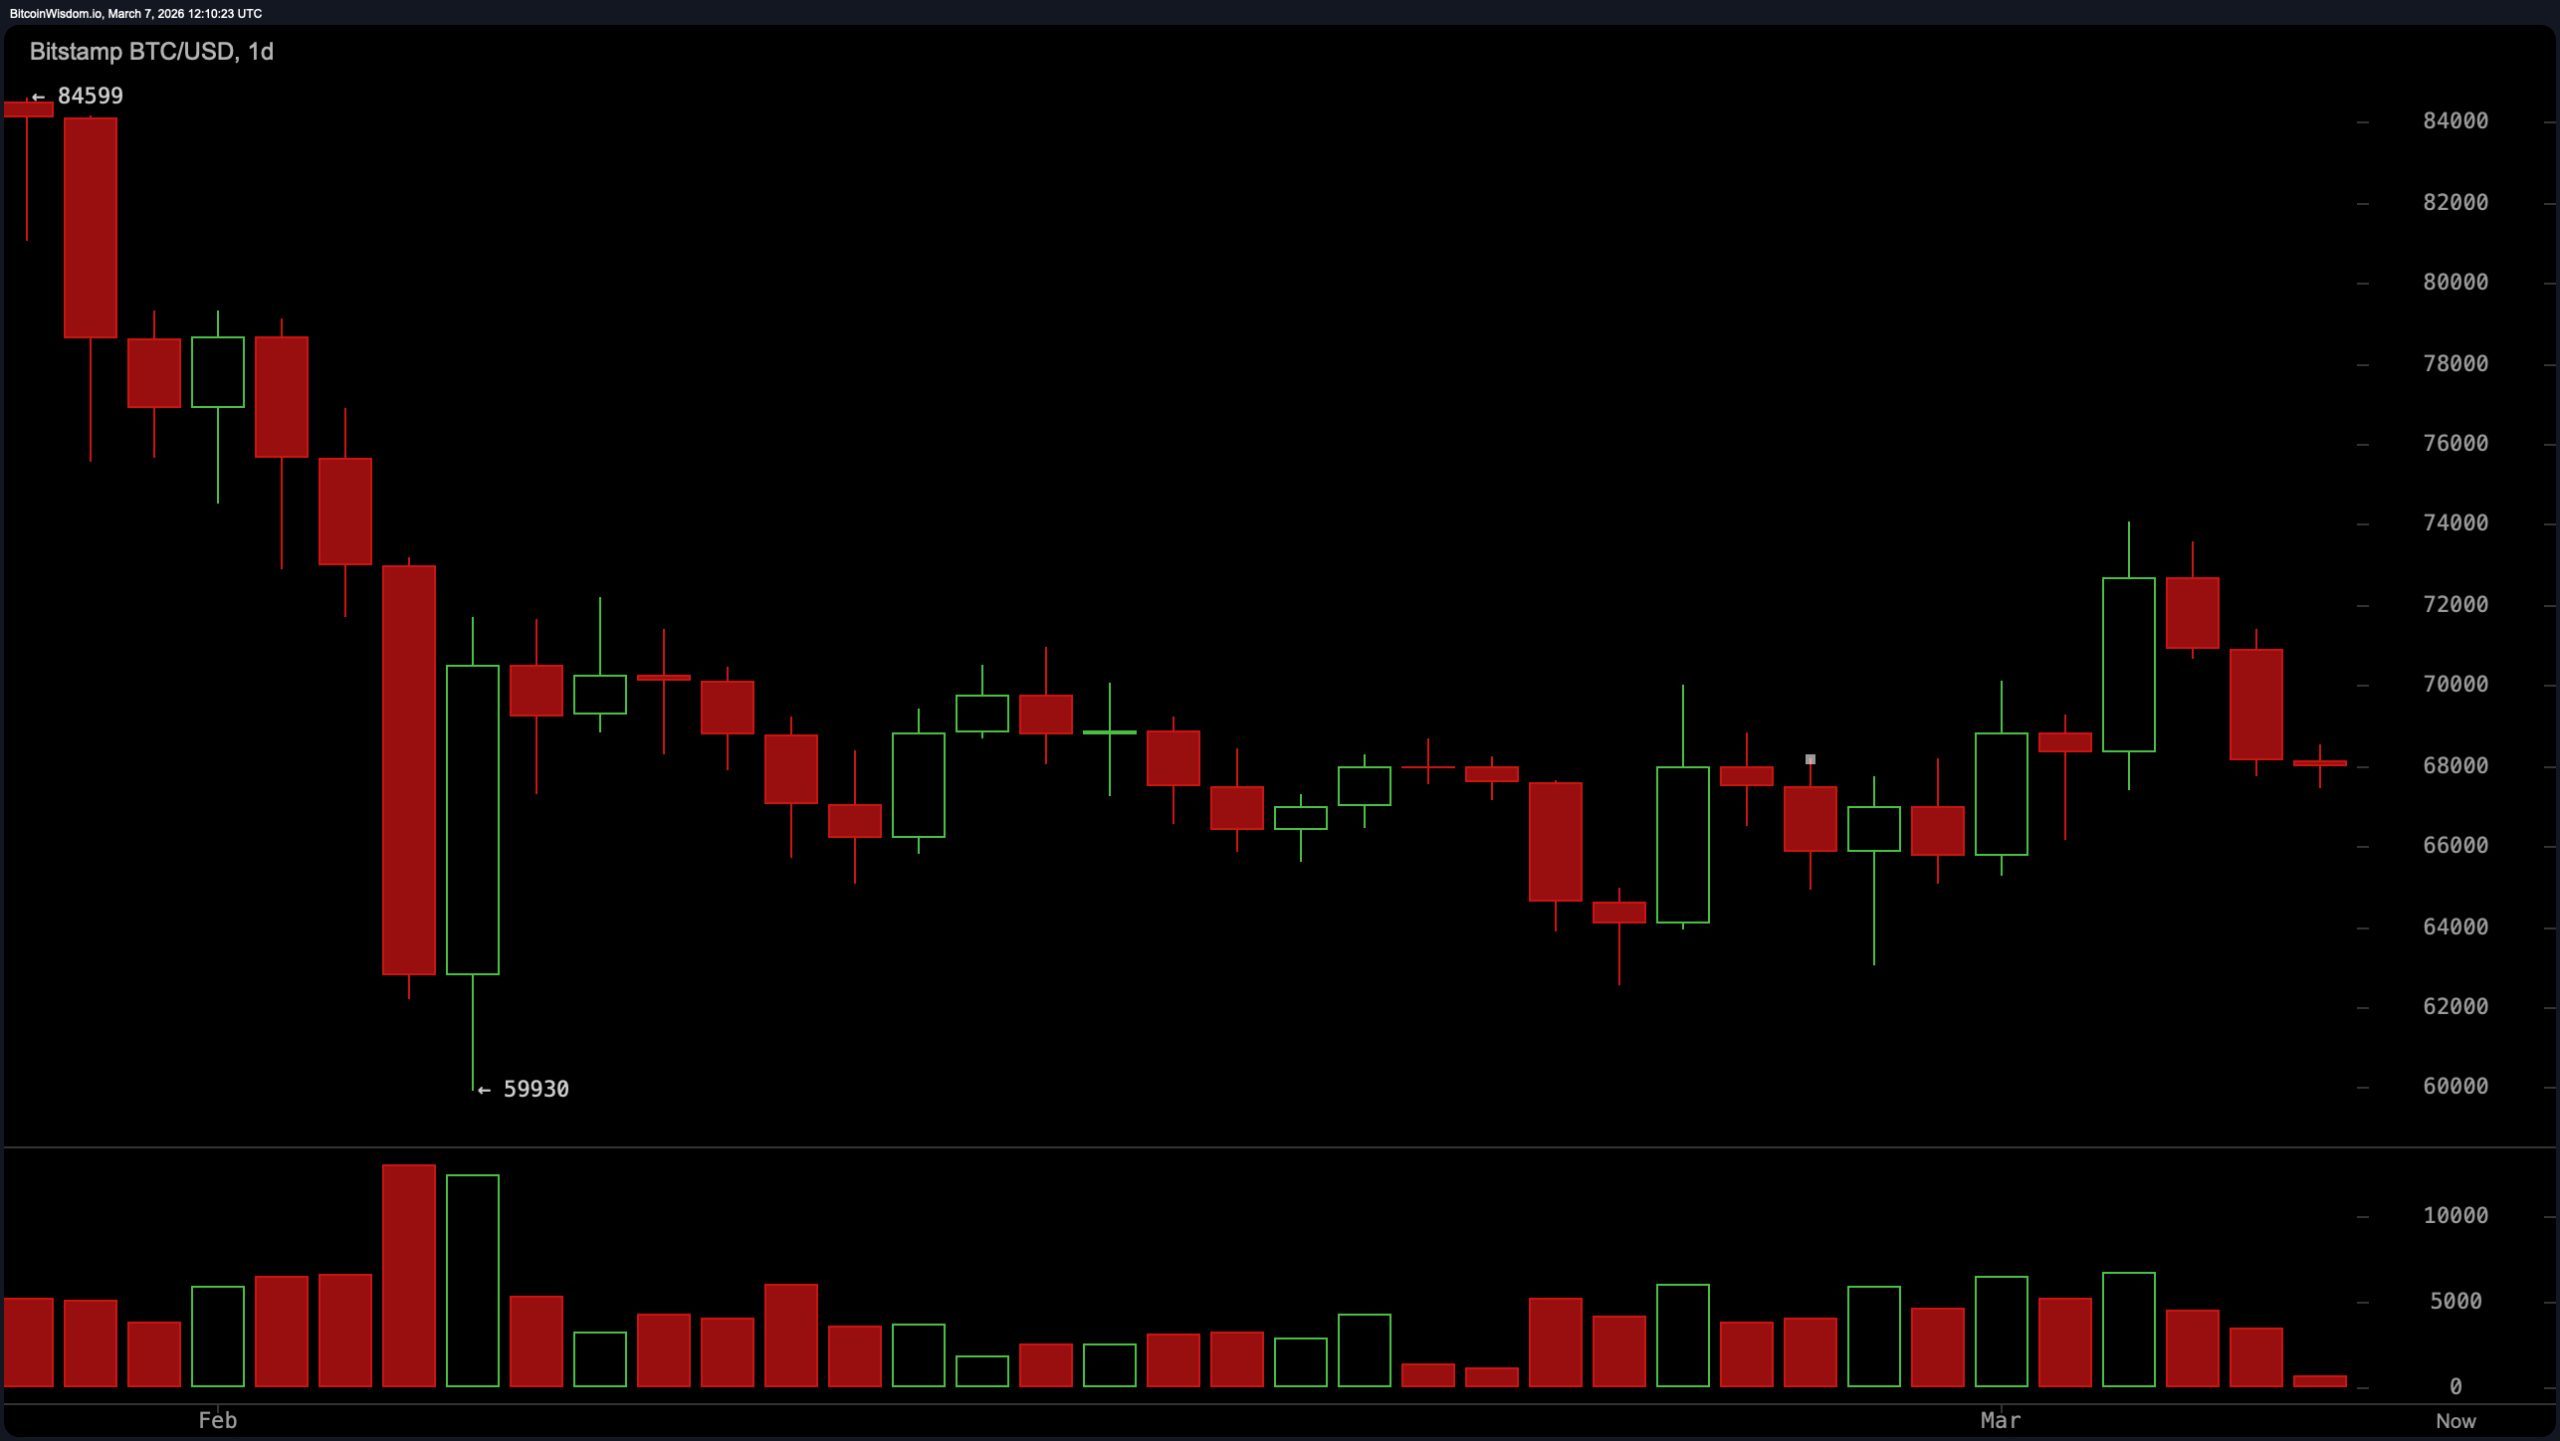
On the daily chart, bitcoin remains in a broader downtrend following a slide from the all-time high zone near $122,582 to a recent swing low of $59,930, representing roughly a 51% drawdown from the peak. Price has since rebounded toward the $68,000 region, but the recovery remains tentative. Candlestick structure shows large bearish bodies dominating the earlier $80,000 to $60,000 decline, followed by indecision candles near the bottom that suggest exhaustion rather than outright reversal.
The current pivot around $68,091 sits between major structural resistance near $80,000 and key support near $59,930–$60,000. Volume behavior reinforces the caution: trading activity spiked during the decline but has diminished during the rebound, a pattern that typically reflects weaker upward conviction.
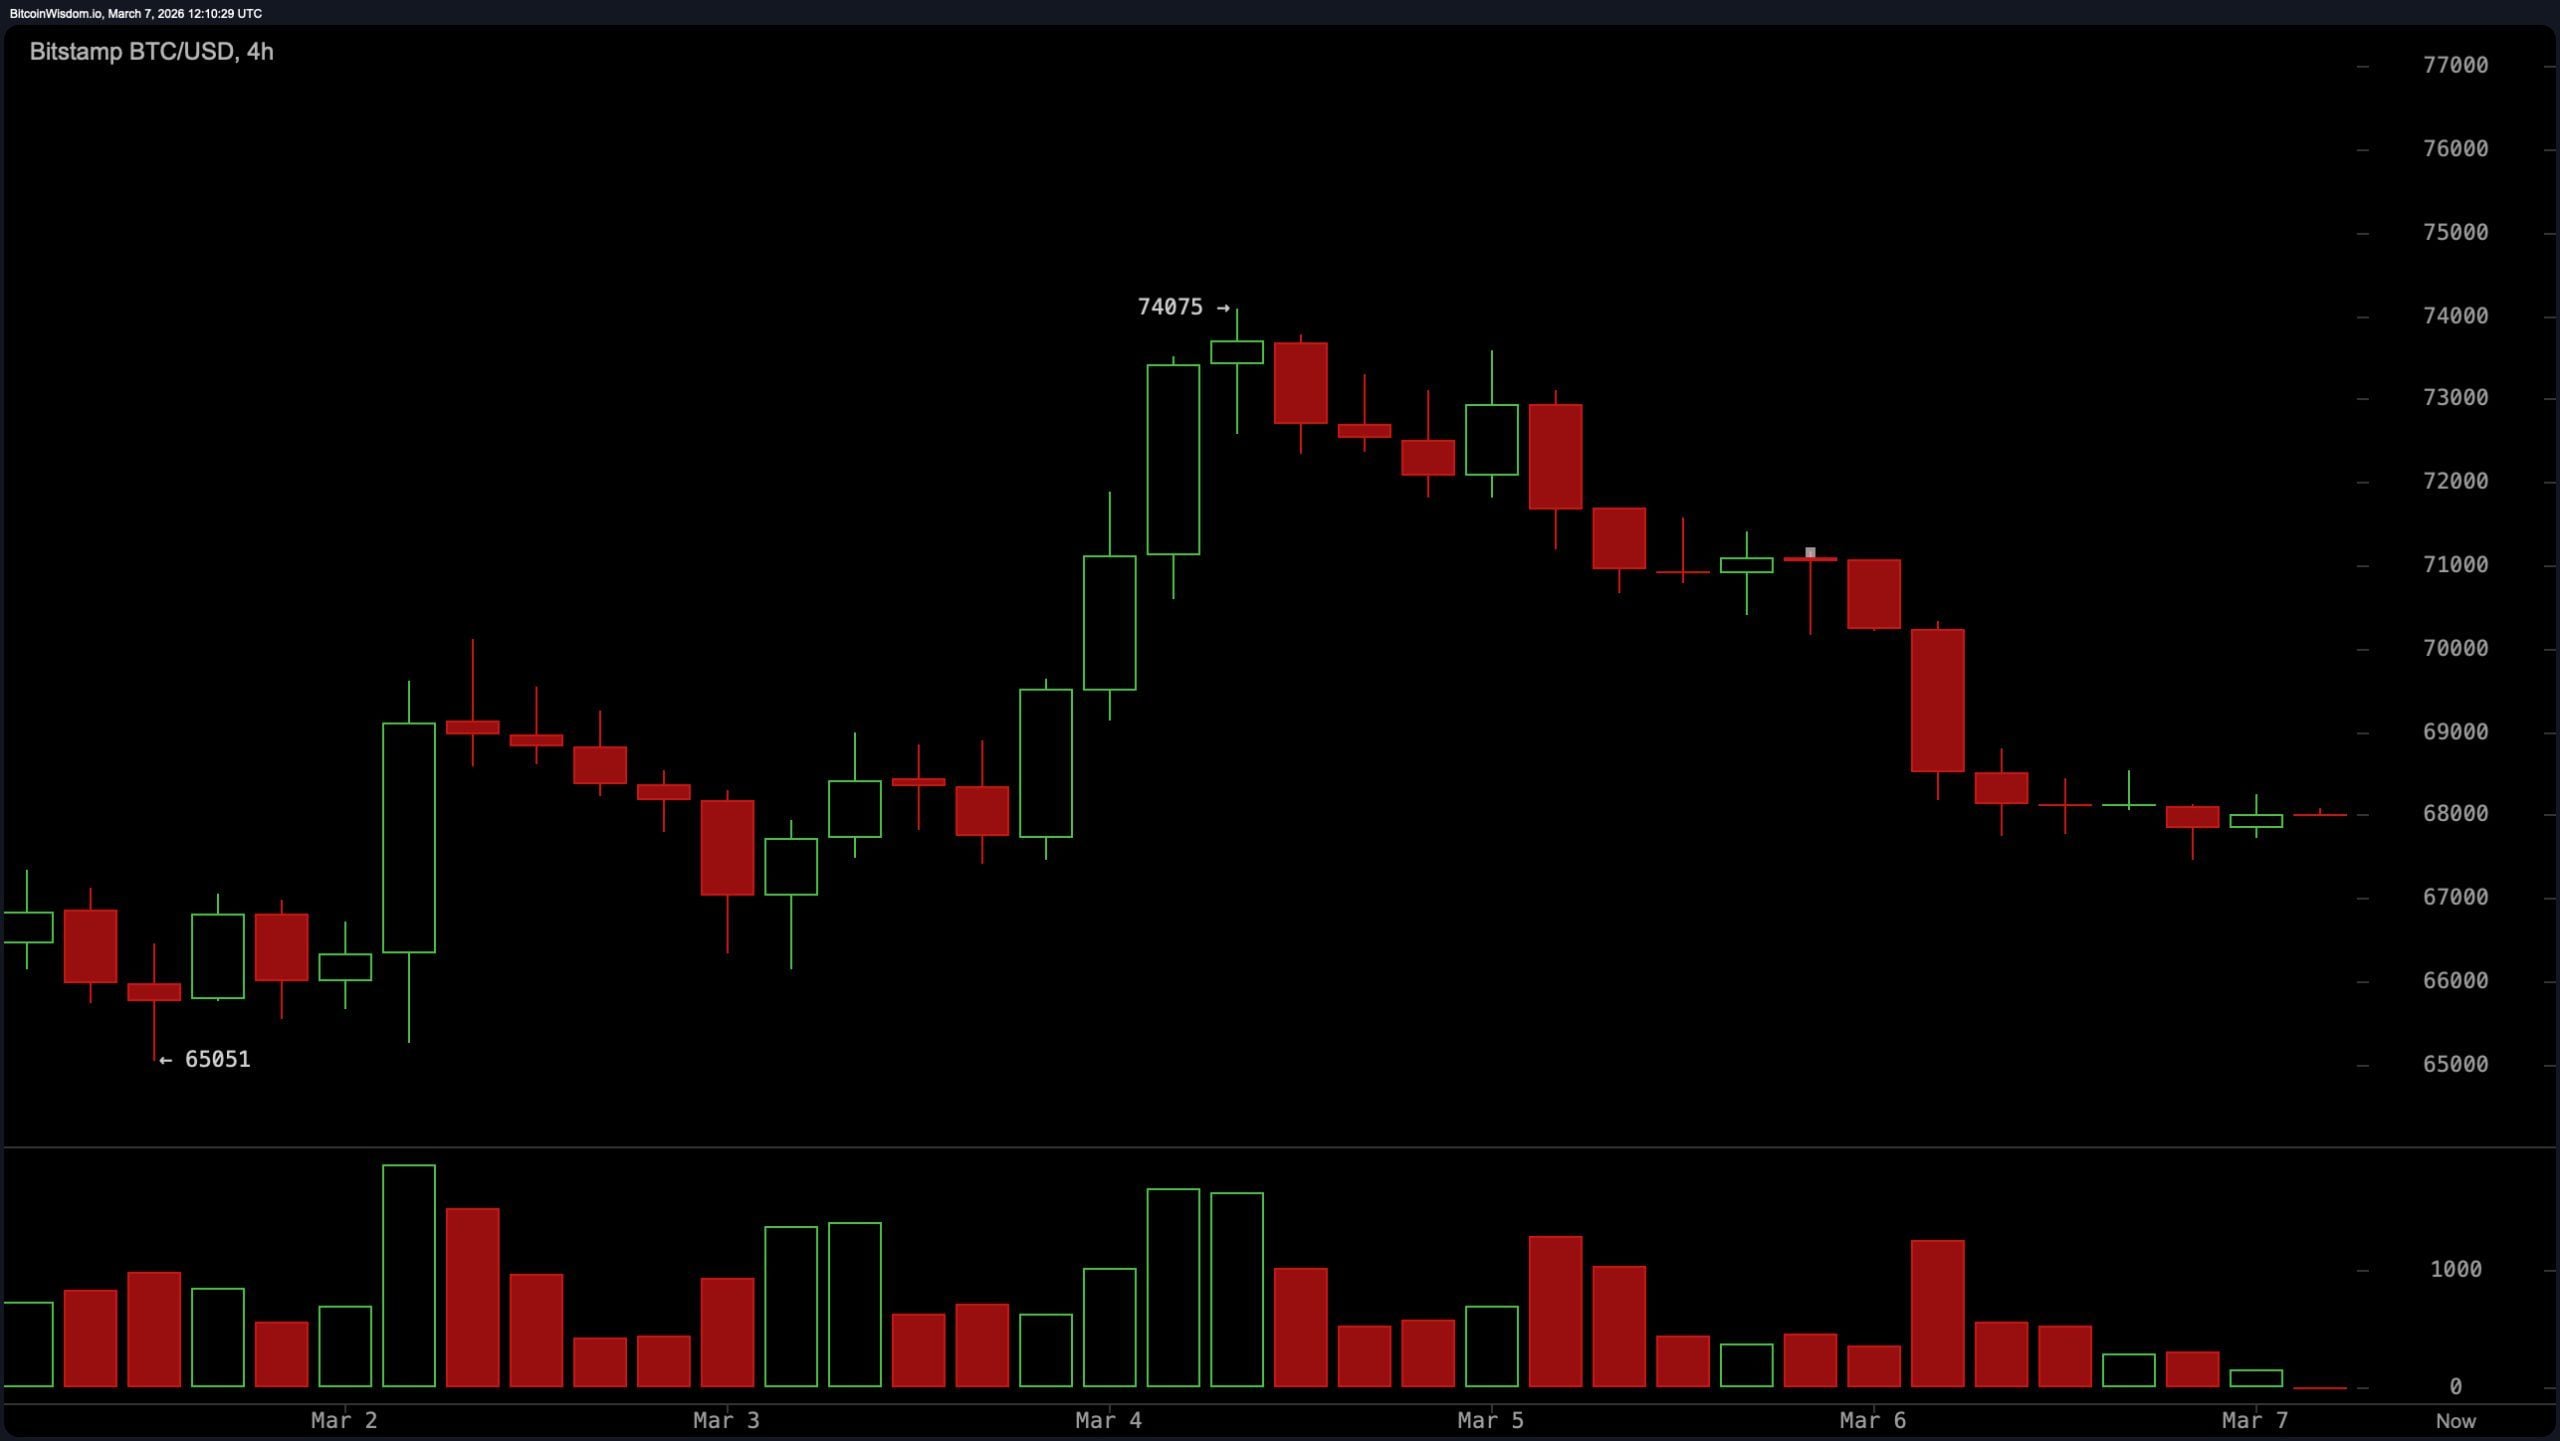
The four-hour bitcoin chart tells a similar story with slightly more drama. Bitcoin staged a sharp rally from $62,525 to $74,075 before momentum abruptly reversed, producing a sequence of lower highs beneath that peak. The decline from $74,075 unfolded with aggressive red candles, implying distribution after the brief surge. Price is now hovering around the $68,000 to $68,400 support zone, which effectively serves as the market’s current decision point. Immediate resistance sits near $70,000, while deeper support appears around $66,000 and ultimately $62,525. Volume expanded during both the rally and the subsequent reversal, then faded as price entered consolidation, suggesting traders are waiting for the next directional cue rather than eagerly chasing the current range.
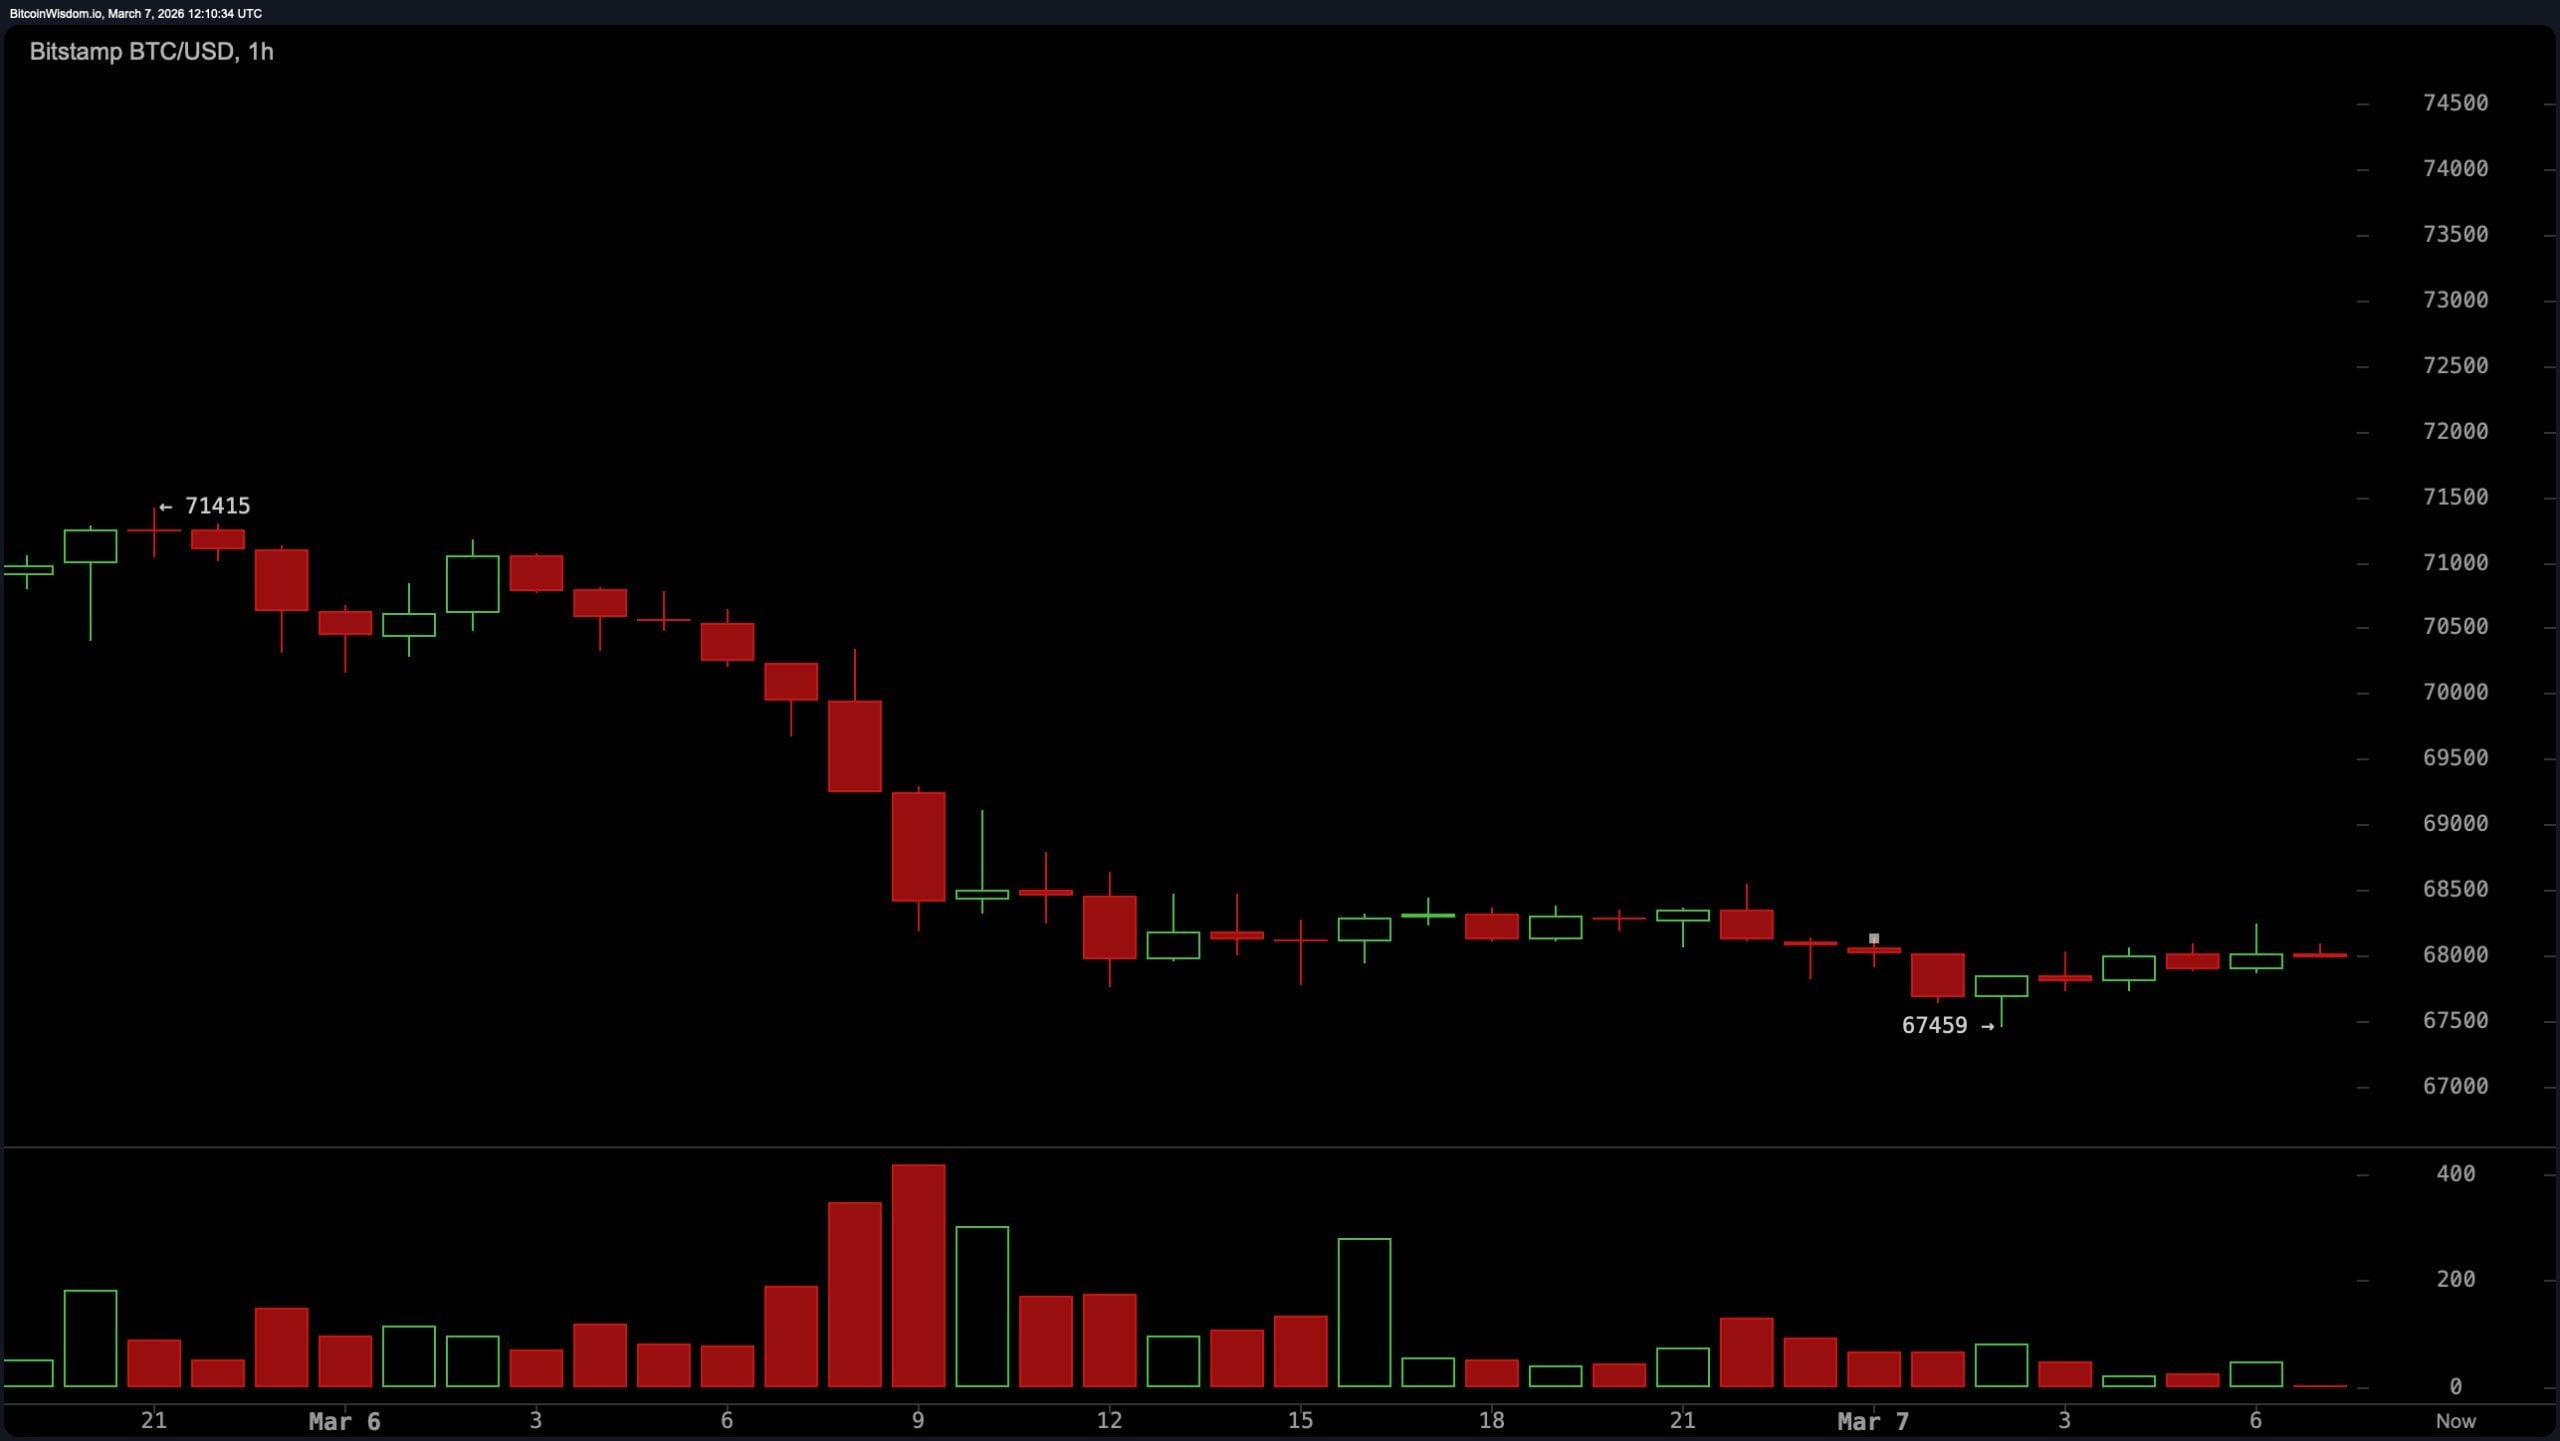
On the one-hour chart, the microstructure leans negative as price traces a descending channel from the $74,075 high. The pattern has produced consistent lower highs and lower lows, with repeated rejections near the $70,000 to $71,000 zone forming visible shooting-star candles. Immediate resistance sits between $68,500 and $68,800, while short-term support lies around $67,800 and $67,500. The chart also shows compression: inside bars and small candles cluster around the $68,000 pivot, indicating reduced volatility before a potential expansion. Hammer-style candles near $67,800 reveal intermittent demand, but so far, they have merely slowed the decline rather than flipping the short-term trend.
Oscillators collectively paint a picture of neutrality rather than exhaustion. The relative strength index ( RSI) reads 46, comfortably between overbought and oversold territory. Stochastic registers 56, commodity channel index (CCI) (20) sits near 23, and the average directional index (ADX) measures 37, all consistent with a market lacking decisive momentum.
The Awesome oscillator remains positive at 1,029, while the momentum indicator shows a negative signal, and the moving average convergence divergence ( MACD) level is below zero at −1,167, but is generating a positive signal. In aggregate, the oscillator set produces eight neutral signals, two negative, and one positive — essentially the market equivalent of a shrug.
Moving averages, however, are far less diplomatic. Bitcoin currently trades below every major exponential moving average, including the exponential moving average (EMA) (10) at $68,560, EMA (20) at $68,867, EMA (30) at $70,300, EMA (50) at $73,802, EMA (100) at $81,194, and EMA (200) at $89,321. The simple moving average (SMA) (10) sits at $68,310 and SMA (50) at $74,743, both above price as well, while longer-term measures such as SMA (100) at $82,428 and SMA (200) at $95,667 loom far overhead.
Only SMA (20) at $67,654 and SMA (30) at $68,090 generate positive signals. The Ichimoku base line (9, 26, 52, 26) rests near $68,300 and reads neutral. In total, the moving-average stack produces 11 negative signals and two positive ones — which, for those keeping score at home, is not exactly the posture of a roaring bull market.
Bull Verdict:
A bullish shift would require bitcoin to reclaim the immediate resistance band between $68,500 and $70,000 with sustained volume, breaking the series of lower highs visible on the one-hour and four-hour charts. A move above $70,000 would invalidate the descending short-term structure and open the path toward $74,075, the most recent swing high. Beyond that level, the broader market would begin testing heavier structural resistance near $80,000 on the daily chart. Oscillators remain largely neutral — including the relative strength index ( RSI) at 46 — which leaves room for upside momentum to build if price regains key levels. In short, reclaim the range, break the lower-high pattern, and the recovery narrative quickly becomes much more credible.
Bear Verdict:
Bitcoin’s bearish case remains technically dominant as long as bitcoin stays below the $68,500 resistance zone and beneath most major moving averages. A decisive breakdown below the $67,800 support level on the one-hour chart would confirm continuation of the descending channel and likely expose the next liquidity pockets around $67,000 and $66,500, with $65,051 emerging as the next major chart support. The broader structure reinforces that risk: price remains below the exponential moving average (EMA) from 10 through 200 periods and below several longer-term simple moving averages (SMA). Until the market can reclaim higher resistance levels, the prevailing technical bias continues to favor downside pressure, with $62,525 representing the next major structural test on a deeper retracement.
FAQ 🔎
- Why is bitcoin falling today?
Bitcoin is down about 3.3% as of March 7, 2026, with technical indicators and moving averages showing persistent downward pressure. - What is the key support level for bitcoin right now?
The most important short-term support sits around $67,800–$68,000, with deeper support near $65,051 and $62,525. - What resistance levels must bitcoin break to recover?
Bitcoin needs to reclaim $68,500 and then $70,000 to shift short-term momentum back upward. - What do bitcoin technical indicators show today?
Most oscillators are neutral while moving averages show strong downside pressure, signaling a structurally bearish market.
Read More
- All Shadow Armor Locations in Crimson Desert
- Jujutsu Kaisen Season 3 Episode 12 Release Date
- Dark Marksman Armor Locations in Crimson Desert
- How to Get the Sunset Reed Armor Set and Hollow Visage Sword in Crimson Desert
- Keeping AI Agents on Track: A New Approach to Reliable Action
- How to Beat Antumbra’s Sword (Sanctum of Absolution) in Crimson Desert
- Top 5 Militaristic Civs in Civilization 7
- Best Bows in Crimson Desert
- Sakuga: The Hidden Art Driving Anime’s Stunning Visual Revolution!
- Sega Reveals Official Sonic Timeline: From Prehistoric to Modern Era
2026-03-07 16:29