On Tuesday morning (8:30 a.m. EST), bitcoin’s price action danced between $91,800 and $92,479 today, carving out a narrow but significant range in a broader game of “will they or won’t they” among traders. With a market cap firmly seated at $1.83 trillion and a hearty $44.68 billion in 24-hour trading volume, the king of crypto seems to be eyeing a fresh move. Intraday, the price pivoted between $90,128 and $92,479-suggesting that while resistance holds strong, the bulls aren’t exactly backing down either. 🧠
Bitcoin Chart Outlook
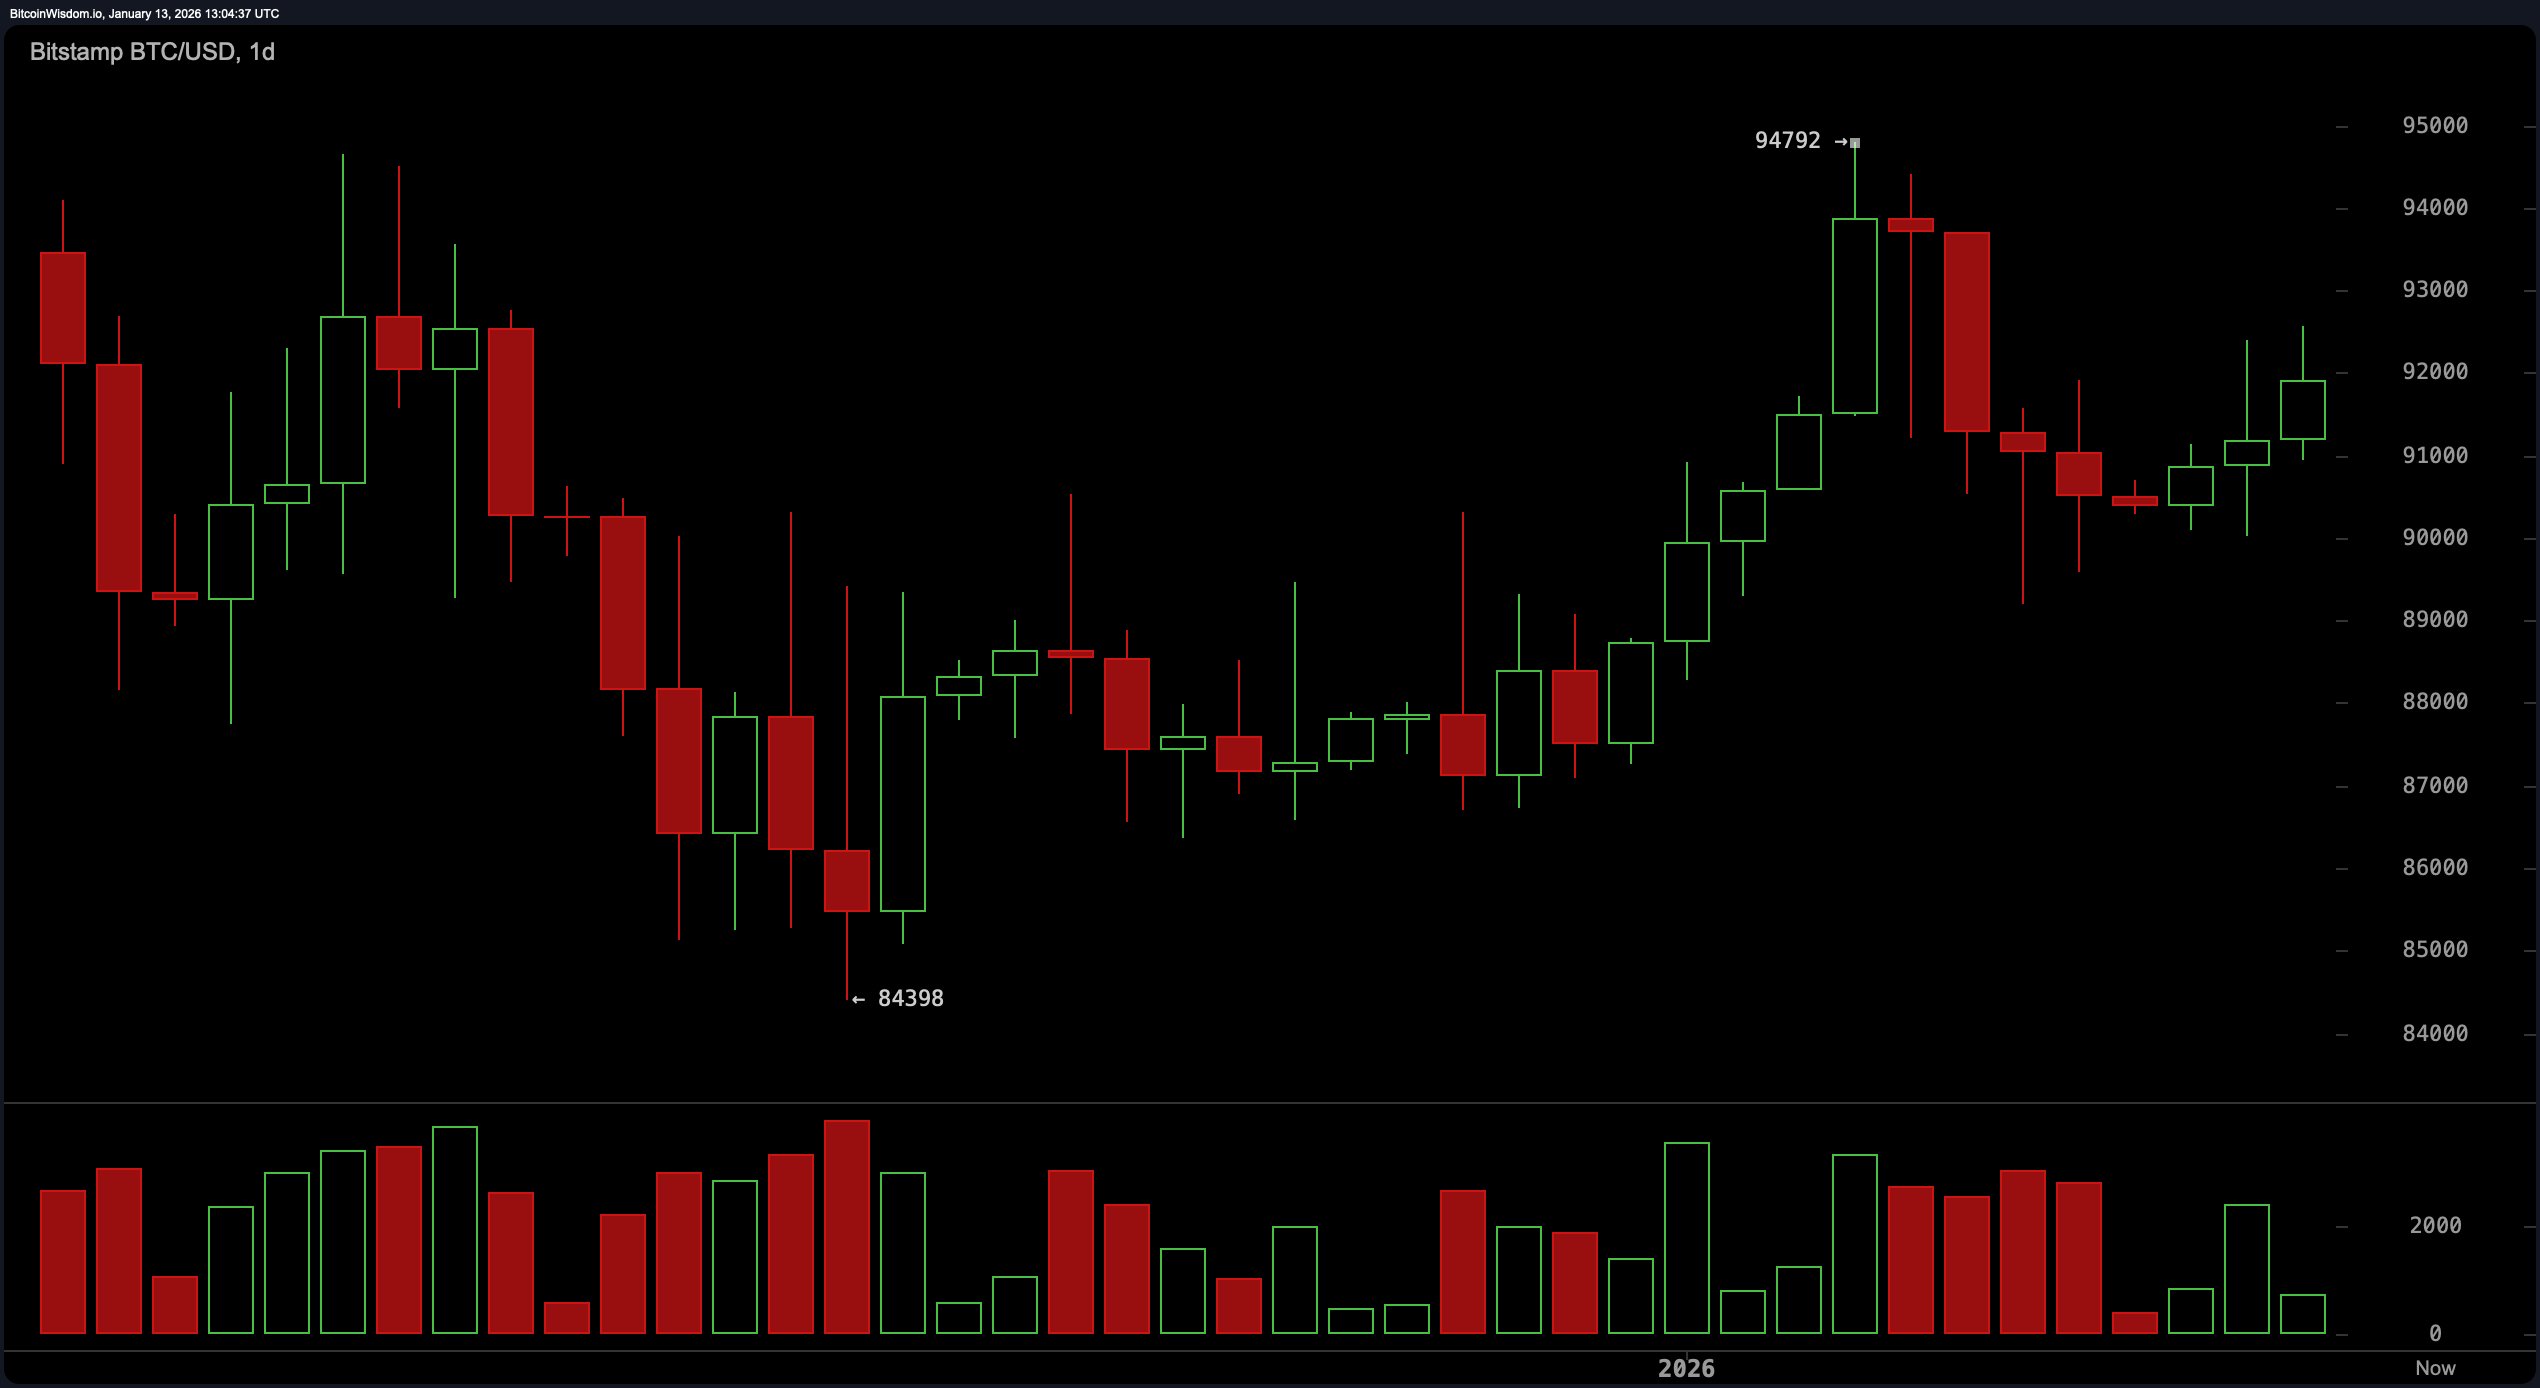
From a macro lens, the daily chart reveals a sideways grind with a not-so-subtle bullish undercurrent. After rallying from approximately $84,000 to $94,800-a tidy 12.3% sprint-bitcoin has simmered into a stabilizing groove above the $91,000 mark. 🐢
That retracement might look like hesitation, but beneath the surface, momentum is gathering like guests at an afterparty. Lower volume post-rally signals indecision, not defeat, as the asset consolidates gains. If bitcoin can maintain altitude above $90,000, there’s a strong case for a continued move toward $94,500-$95,000, as long as traders don’t blink first. 🤯
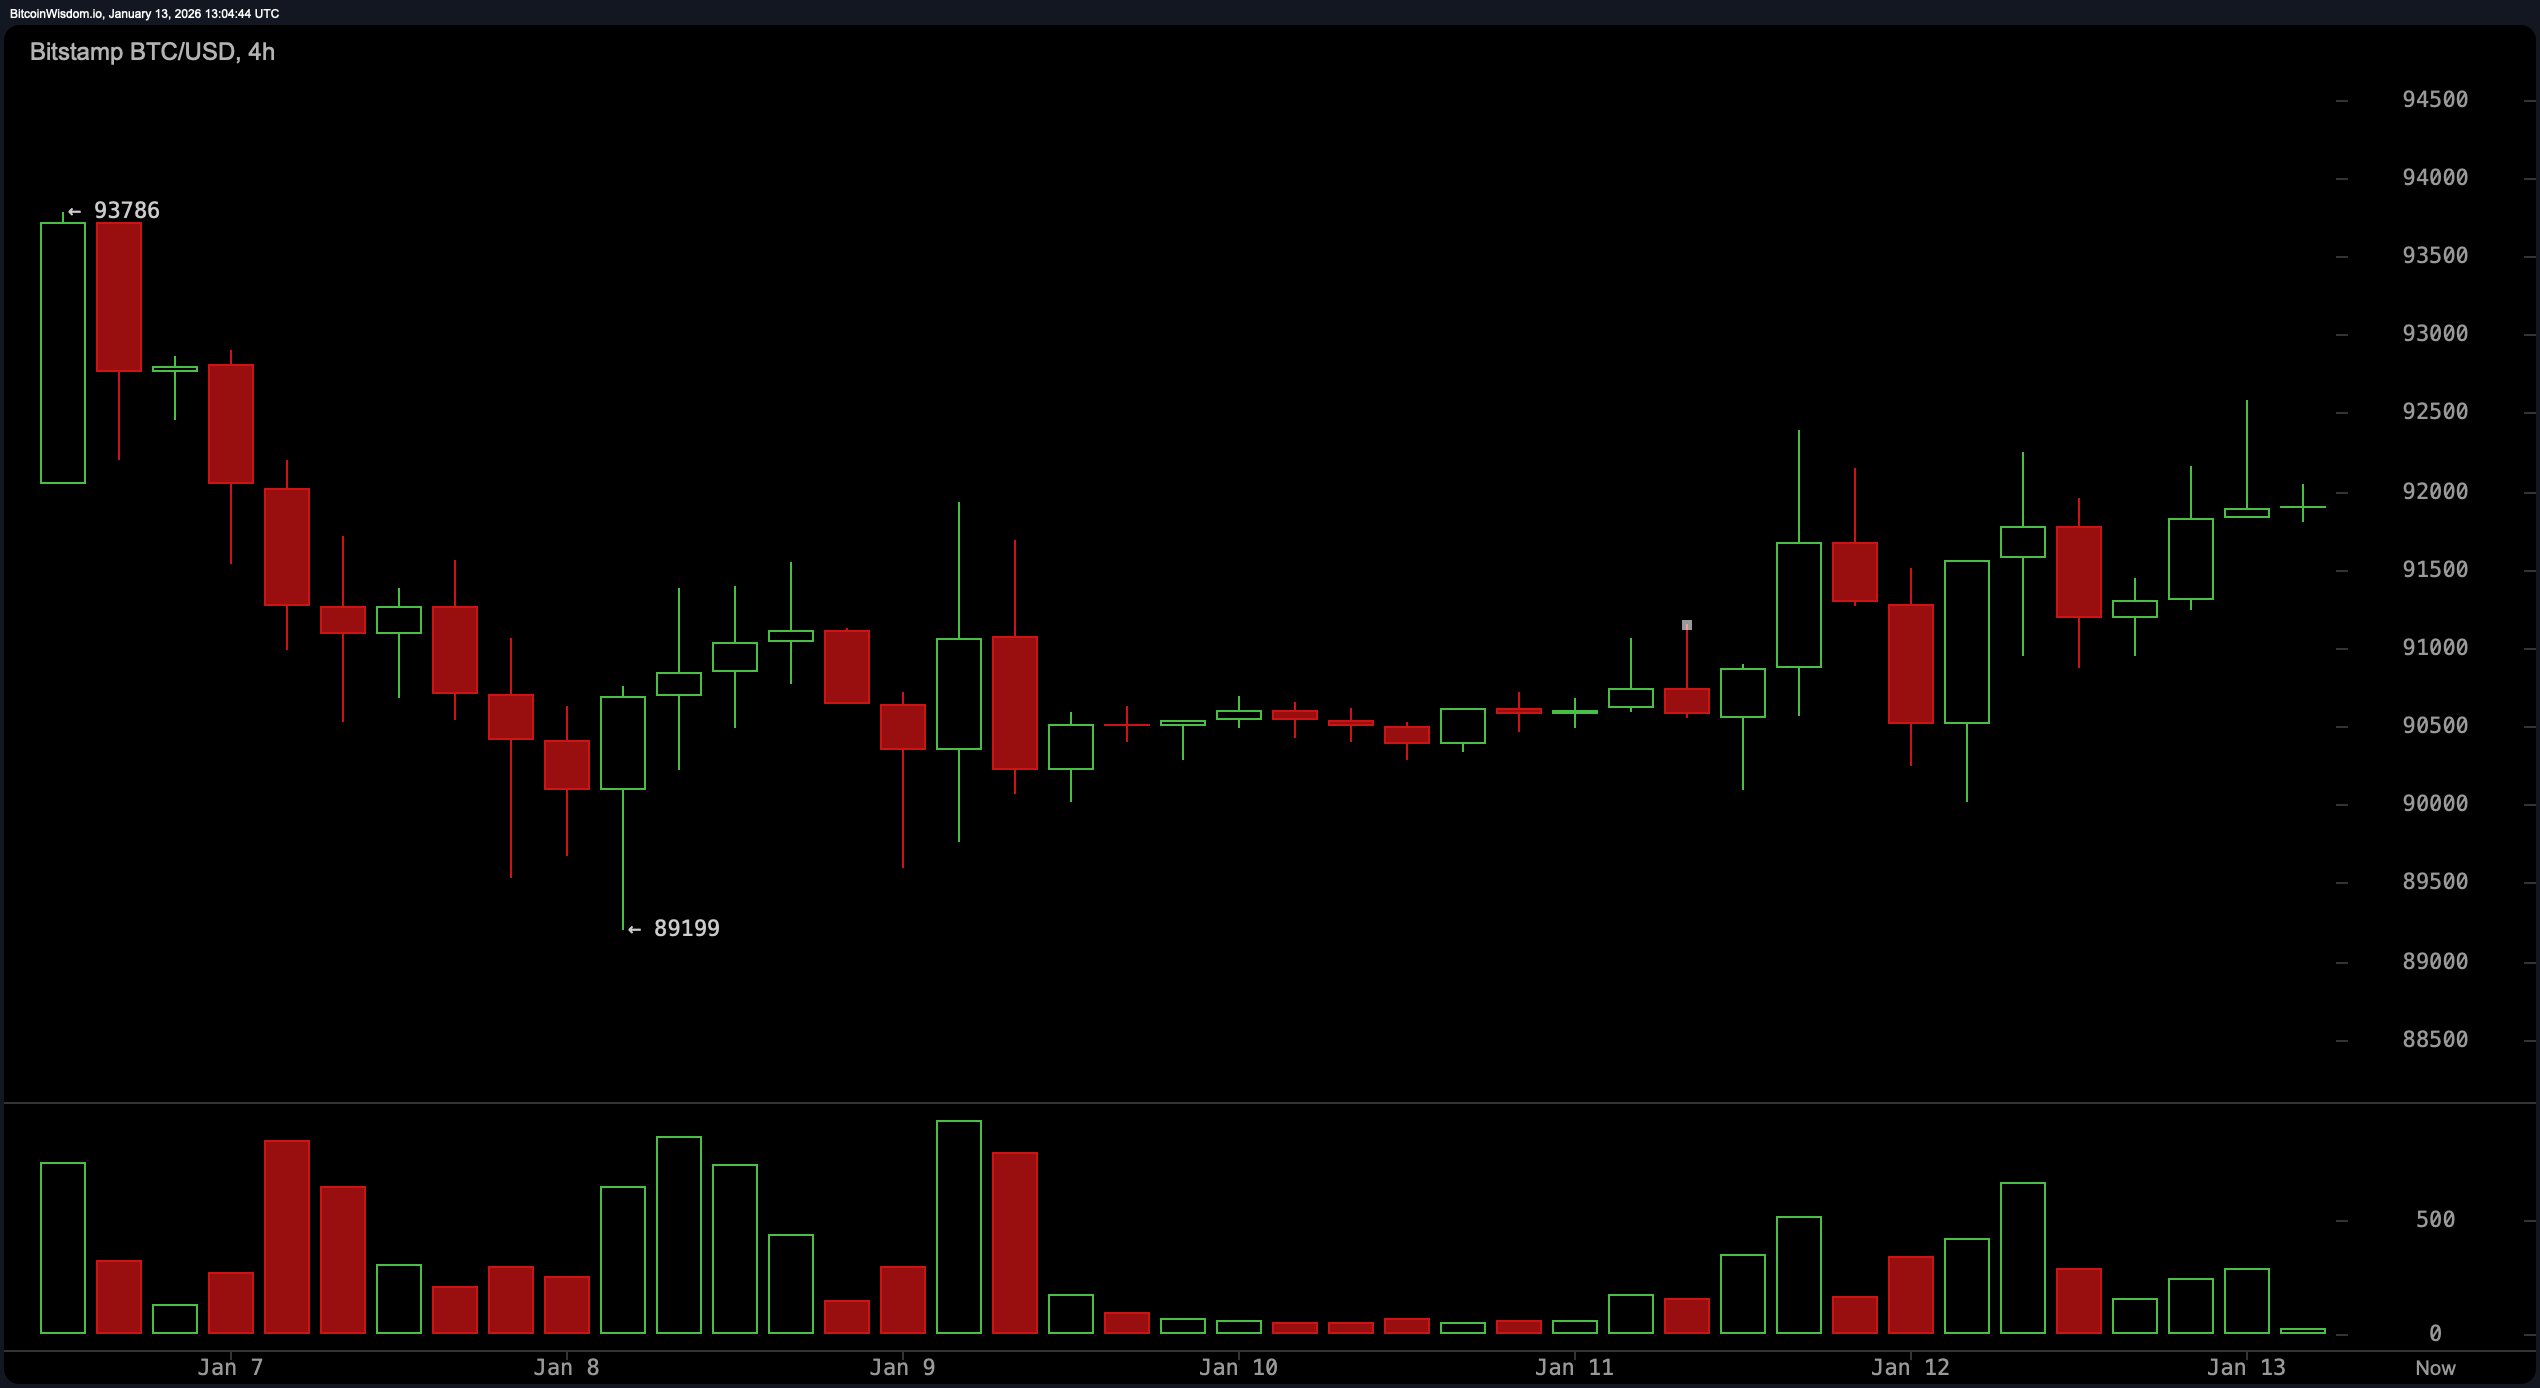
Zooming in on the four-hour chart, bitcoin’s rounded bottom formation from the $89,200 low whispers of quiet accumulation. This mid-term snapshot shows a slow but deliberate recovery to the current price zone. A low-volatility stretch from January 10-12 adds evidence of coiling energy, ready to snap if sparked by volume. Key support rests near $89,199, while a clean push above $92,500 could energize a test of $93,700 to $94,000. Until then, it’s a waiting game-though the bulls seem to be holding the better hand. 📈
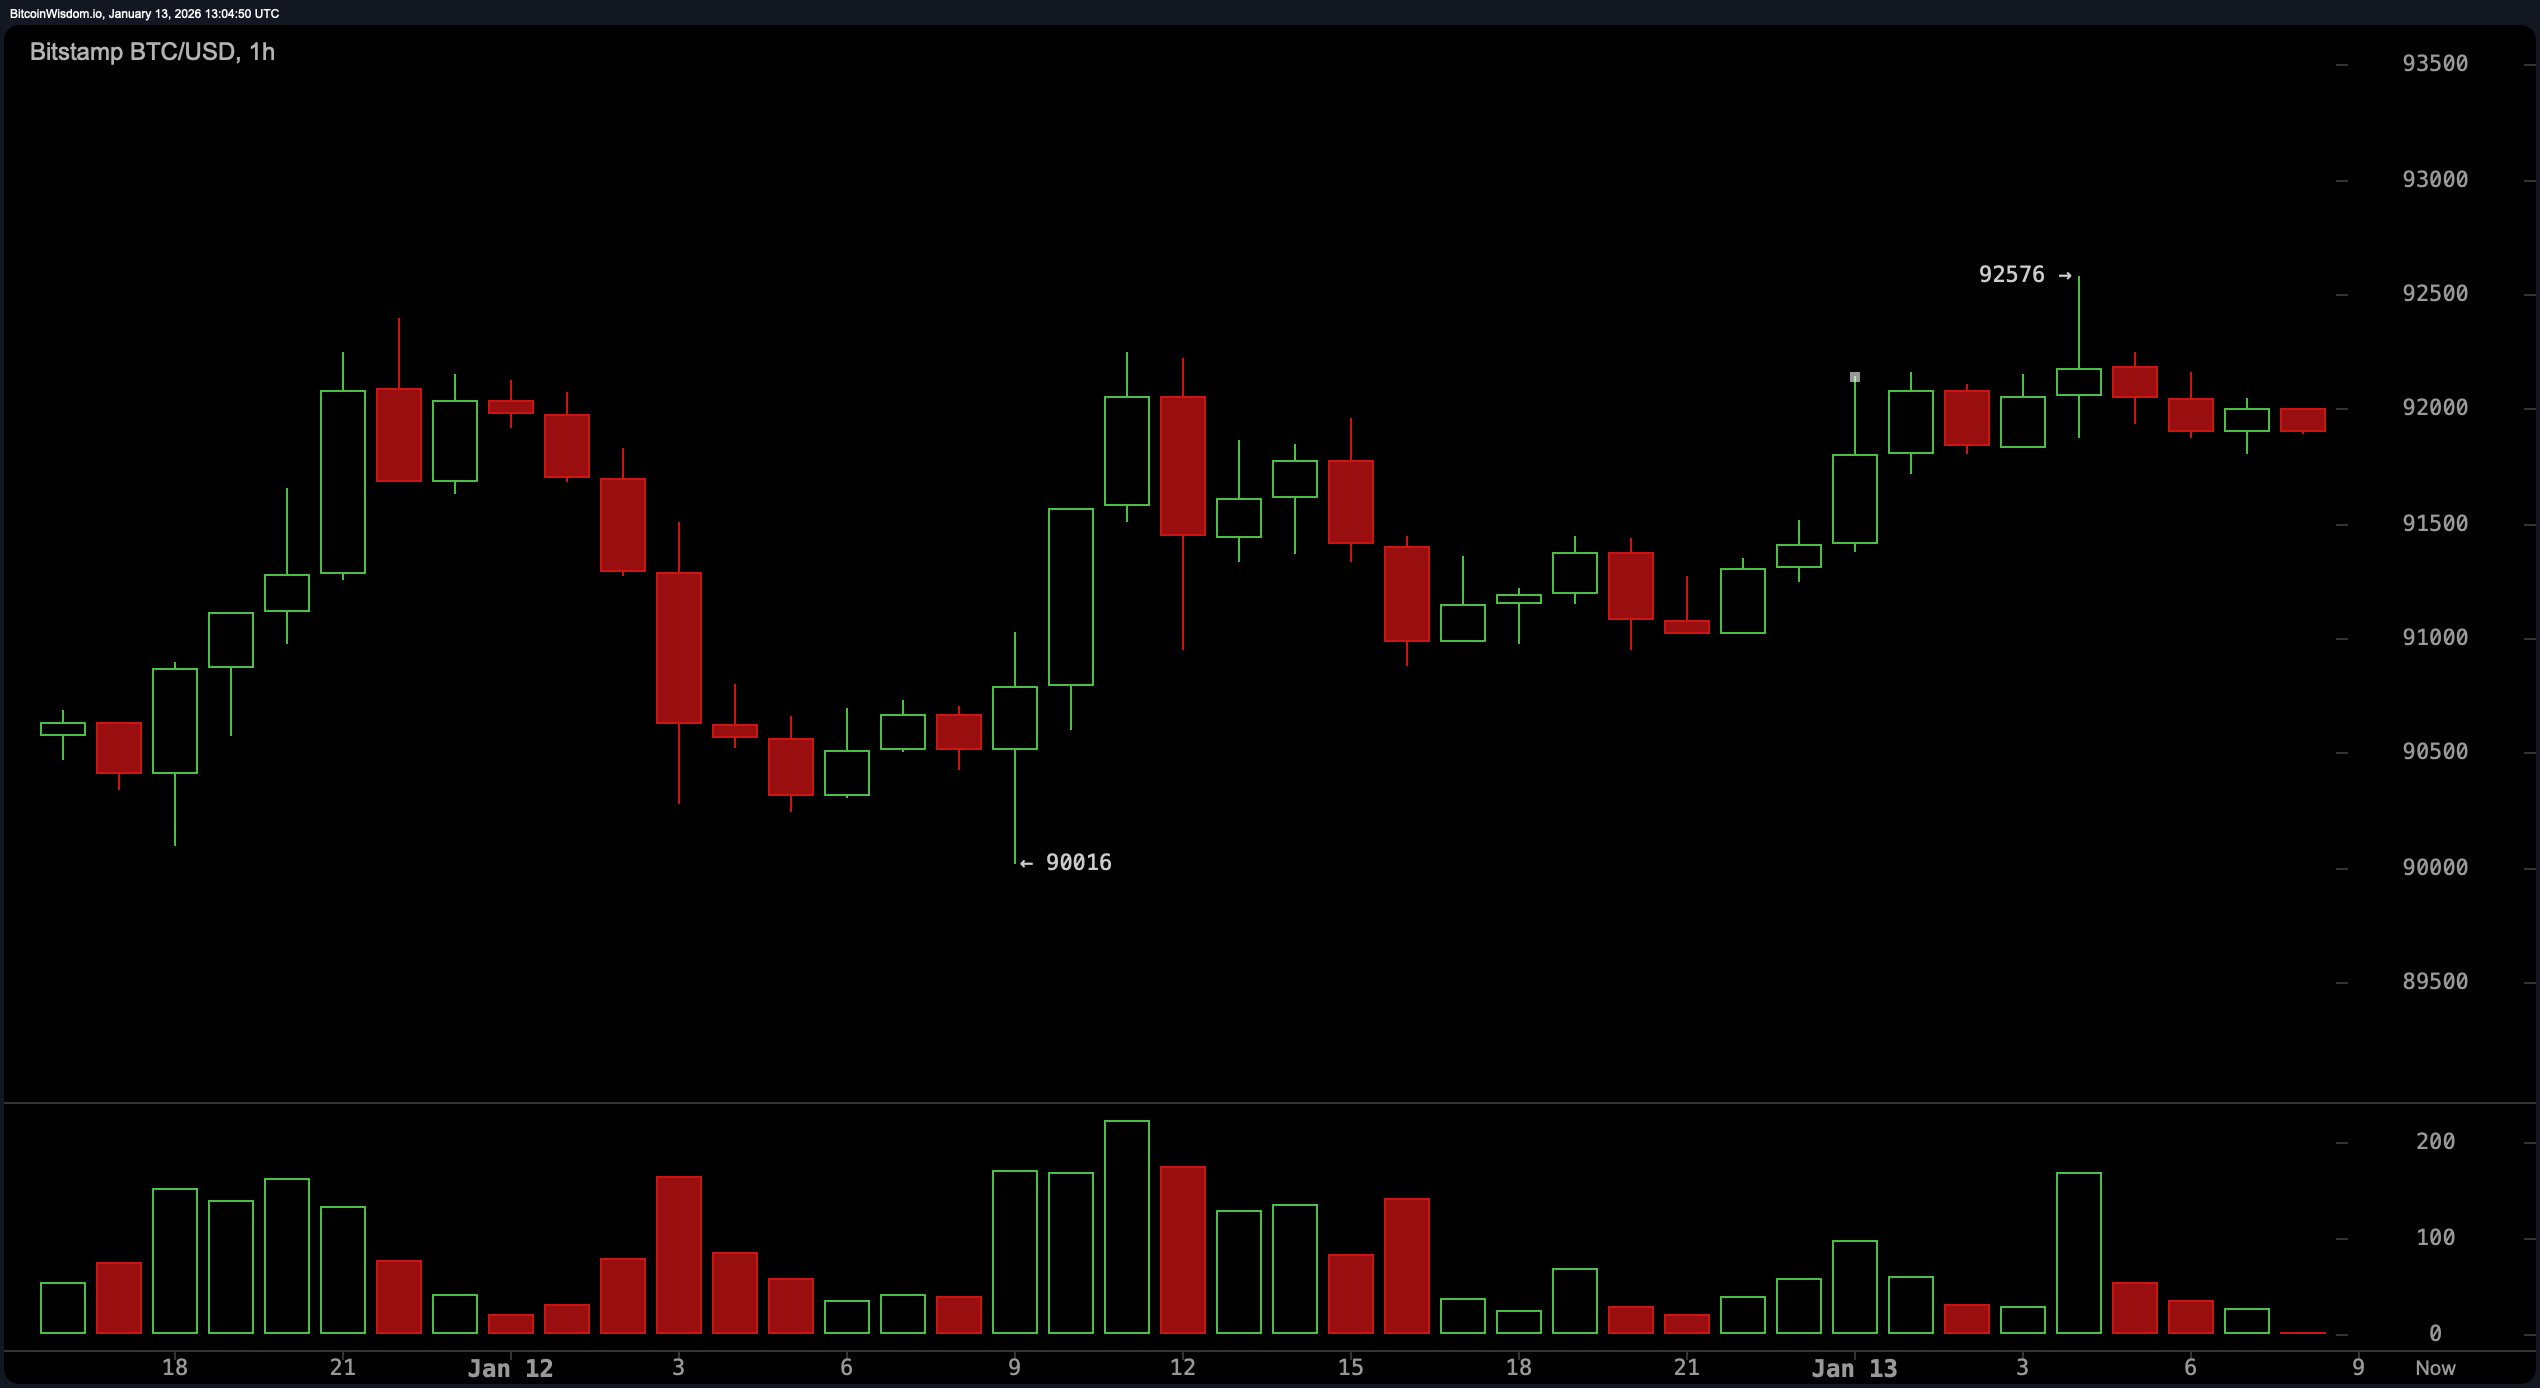
The hourly chart paints a tighter, more tense narrative. Bitcoin remains boxed between $91,000 and $92,500, teasing traders with several failed breakouts. The $92,576 resistance level acts like a velvet rope at an exclusive club: many try, few enter. Buyer exhaustion looms as volume wanes on each approach, leaving the short-term bias neutral to slightly bullish. Only a convincing break above the ceiling-with conviction in volume-will signal this range is ready to be retired. 🚀
Oscillators suggest that Bitcoin is keeping its cool. The relative strength index (RSI), Stochastic oscillator, commodity channel index (CCI), and average directional index (ADX) all hover in neutral territory. But three standouts-momentum, the Awesome oscillator, and the moving average convergence divergence (MACD)-flash positive signals. Translation? Bitcoin may not be sprinting, but it’s stretching and warming up for a potentially bullish jog. 🧠
Moving averages (MAs) also show their hand. From the 10-period to the 50-period ranges, both exponential (EMA) and simple (SMA) moving averages cluster below the current price, backing the bullish tilt. However, the longer-term 100- and 200-period EMAs and SMAs remain bearish-indicating Bitcoin still has some heavy lifting to do before flipping the entire script. It’s a classic case of short-term optimism battling long-term skepticism, and right now, the near-term technicals are winning the argument with a smirk. 🤯
Bull Verdict:
The structure is firming, momentum is ticking, and short-term averages are lining up like dominoes in favor of the bulls. With consolidation above $91,000 and three key oscillators flashing green, Bitcoin appears to be mustering strength for a decisive move. If volume joins the party above $92,500, the breakout crowd might just get their headline moment. 🚀
Bear Verdict:
Despite the flirtation with higher levels, the lack of volume on recent rallies and the drag from longer-term moving averages paint a more cautious picture. Resistance at $92,500 remains stubborn, and any dip below $90,000 could reopen the gates to deeper retracement. Until then, the bear case remains on the table-quiet, patient, and watching. 🐻
FAQ 🐂 🐻
- What is Bitcoin’s current price range?
Bitcoin is trading between $91,800 and $92,479 as of January 13, 2026. 🧠 - What are key support and resistance levels for Bitcoin today?
Support sits near $90,000, while resistance holds firm at $92,500. 📉 - Is Bitcoin showing bullish or bearish signals?
Short-term indicators lean bullish, but long-term averages remain bearish. 🤯 - What’s Bitcoin’s market cap and trading volume today?
Bitcoin’s market cap is $1.83 trillion with a 24-hour volume of $44.68 billion. 🚀
Read More
- All Skyblazer Armor Locations in Crimson Desert
- How to Get the Sunset Reed Armor Set and Hollow Visage Sword in Crimson Desert
- All Shadow Armor Locations in Crimson Desert
- Marni Laser Helm Location & Upgrade in Crimson Desert
- All Golden Greed Armor Locations in Crimson Desert
- All Helfryn Armor Locations in Crimson Desert
- Best Bows in Crimson Desert
- Keeping Large AI Models Connected Through Network Chaos
- All Icewing Armor Locations in Crimson Desert
- How to Craft the Elegant Carmine Armor in Crimson Desert
2026-01-13 17:48