Well, folks, it looks like Dogwifhat’s price is doing its best impression of a rock at the bottom of a well! 🪨 Despite some traders trying to catch a falling knife by buying dips, the technical signals are saying, “Hold on to your hats, this ride ain’t over!”
The market activity? About as exciting as a soggy sponge. Major indicators are flexing their “weak” muscles, and sentiment is as fragile as an IKEA bookshelf after one too many moves.
Open Interest Decline: Where Did Everyone Go? 👀
Here’s the latest scoop: WIF/USD has been on a steady downward spiral, plummeting from $0.42 to a cozy $0.342. It’s like the price is just sliding down a slip ‘n slide made of disappointment.
With sellers calling all the shots, the volatility is cranking up every time the price drops. We saw it dip to the $0.33-$0.34 range, and folks, buyers couldn’t even throw a lifeline to those short-term support levels. Ouch.
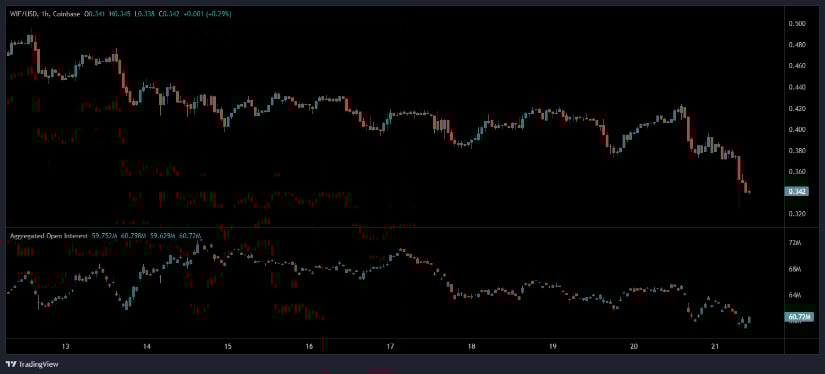
As for the open interest? It’s fading faster than my will to explain crypto to my grandmother. It’s down from 72 million contracts to 60.72 million. That’s traders closing up shop rather than opening new positions. What does that mean? Basically, everyone’s running for the hills before things get worse.
Data Shows WIF Down 3.79% and Still No One’s Buying the Dip
BraveNewCoin is listing Dogwifhat at a delightful $0.38, which is down 3.79% in just 24 hours. Talk about a bad day at the office. With a market cap of $379.28 million and a circulating supply of 998.9 million WIF, it’s clear that the liquidity’s still there, but the price? Not so much.
Even with volumes of $189.88 million, traders are more like passive spectators, waiting for the next disaster. The token’s trading range between $0.34 and $0.40 is like a game of “how low can you go?” And surprise, surprise, it’s trending downwards. Woo-hoo. 💸
But hey, don’t be fooled by its #189 rank. Dogwifhat’s more speculative than a fortune teller at a carnival, driven by sentiment and short-term whimsy rather than anything resembling long-term stability. Without some heavy-duty buying action or a shift in the market mood, we’re looking at more downward pressure, folks. 🚨
Indicators Confirm: Bears are Running the Show 🐻
TradingView’s daily chart is painting a picture no one wants to hang on their wall. WIF’s sitting at $0.342, down 9.52% just today. It’s like the price can’t catch a break. The chart shows the price is below the Bollinger Band basis at $0.435, and guess what? It’s not coming back anytime soon. Directional weakness is the name of the game. Even buyers are struggling to keep the price from completely cratering.
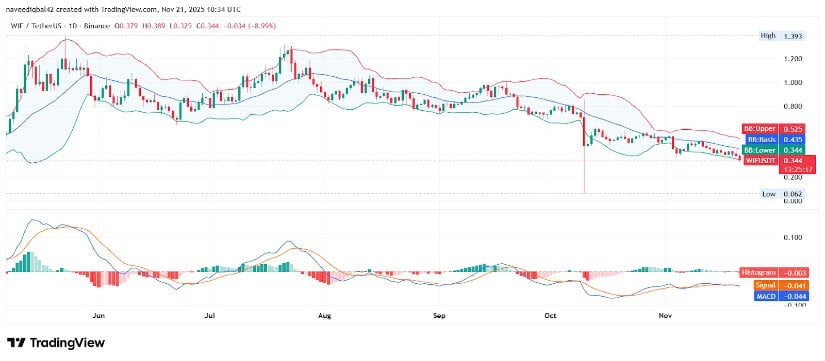
Source: Tradingview
The resistance near $0.52-$0.60 is stronger than my willpower to not eat chocolate during a workout. Meanwhile, key support sits somewhere near $0.20. Whoo boy, talk about a cliffhanger. The short-term trend? Definitely negative, and unless something drastic happens, we’re looking at deeper dips ahead.
And let’s not forget the MACD, which is about as promising as my last attempt to learn a new language. The histogram’s negative at -0.003, and the MACD line’s sitting beneath the signal line, signaling bearish continuation. So unless some miracle happens (like a price reversal or a crossover), the Dogwifhat train may keep chugging downward. 🚂
Read More
- All Skyblazer Armor Locations in Crimson Desert
- All Shadow Armor Locations in Crimson Desert
- How to Get the Sunset Reed Armor Set and Hollow Visage Sword in Crimson Desert
- Marni Laser Helm Location & Upgrade in Crimson Desert
- Best Bows in Crimson Desert
- All Helfryn Armor Locations in Crimson Desert
- All Golden Greed Armor Locations in Crimson Desert
- How to Craft the Elegant Carmine Armor in Crimson Desert
- Keeping Large AI Models Connected Through Network Chaos
- One Piece Chapter 1179 Preview: The Real Imu Arrives in Elbaf
2025-11-21 23:51