Whales Sold $60 Billion Worth of Bitcoin: Could This Trigger a Crash to $60,000?
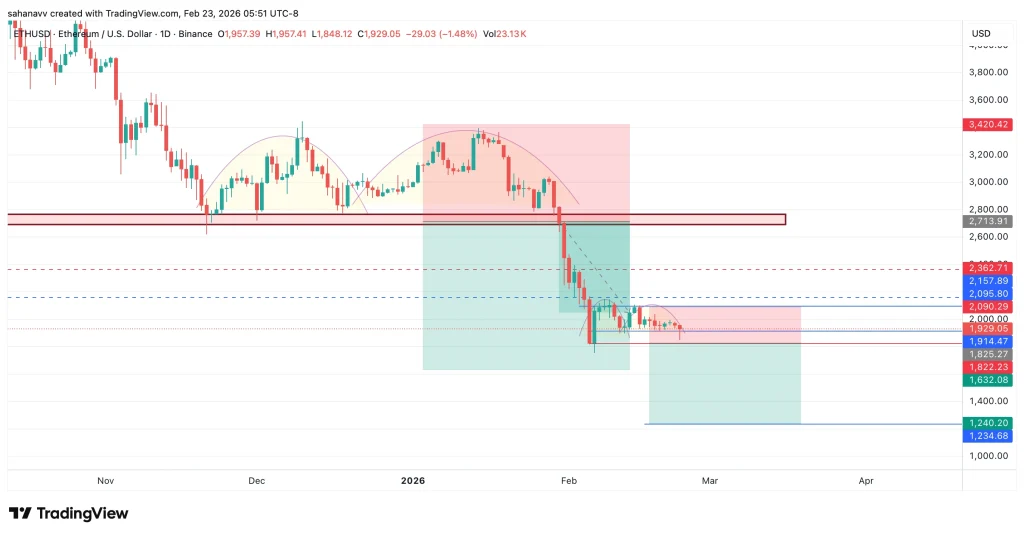
At present, Bitcoin finds itself in a lovely little range, teetering between the buyers and sellers like a drunkard at a party trying not to spill his drink. This delightful equilibrium suggests that the next dramatic move will hinge upon how investors decide to play their cards-will they fold or go all in?