Bitcoin’s $71K Tango: OGs Sell, G Coin Parties on MEXC
TLDR (Because who has time for nuance?):
TLDR (Because who has time for nuance?):
HYPE’s trading patterns recently show a period of stabilization within a generally rising trend. Most key moving averages indicate a continued upward direction, with 12 out of 14 suggesting a buying opportunity. However, indicators like RSI, Stochastic, and CCI aren’t currently showing strong momentum, meaning the price hasn’t definitively broken out to a new high. Overall, the trend is still positive, but a strong move upward hasn’t been confirmed yet.

According to sources “familiar with Capitol Hill chatter” (read: interns with burner phones), Senate Banking Committee members may have struck a “compromise,” which in Washington parlance means everyone got half of what they wanted and twice the loopholes. The Agriculture Committee, ever the eager beaver, already staged a procedural vote back in January, because nothing says urgency like a three-month head start.

Behold, the spectacle of PI: a mid-cap, dilutive relic, trading not on cash-flow or utility but on the fever-dream of a narrative. Its chart? A dead cat bouncing, a 30% plunge in some fiat pairs, a 7% rupee bounce-a farce of volatility. Daily volume? A mere whisper in the tens of millions, enough to let traders play god with its price, but nothing to rival the titans of Layer 1. By 2026, it may linger near 0.17 dollars, a 94% fall from its 2025 peak-a post-launch repricing so brutal it would make a Roman emperor weep.

In the dusty plains of the crypto frontier, Ledger has decided it’s time to put on a suit and tie. The company, known for its hardware wallets-those little devices that keep your Bitcoin safer than a miser’s mattress-has hired John Andrews, a former Circle executive, as its new CFO. Andrews, a man who’s spent more time in boardrooms than most of us have in our own living rooms, is tasked with steering Ledger toward a U.S. IPO. Because nothing says “we’ve made it” like ringing the Nasdaq bell.
Let’s not call this a “bull run” – that’s too dignified. This is more like a stampede of clueless cows wearing “I’m a Short Seller” signs. The buying pressure? Two months in the making, folks. And now it’s clashing with the heaviest concentration of leveraged short positions since the Great Crypto Crash of 2026. Spoiler: The cows are winning. For now.
Ah, Bitcoin, that fickle darling of the digital realm, has perched itself above $70,000 like a crow on a wobbly branch. Its resilience is as baffling as a nose in the middle of a face-why is it there? Who knows! Yet, here it stands, defiant amidst the selloff that saw it plummet from $75,000, as if it had tripped over its own shoelaces.
The BeInCrypto Legal and Regulatory Expert Council, a cabal of sages in ties and blockchain, whispers of a new electorate: crypto voters. A bloc so potent, even politicians might soon trade their briefcases for crypto wallets-or perish in the maelstrom.
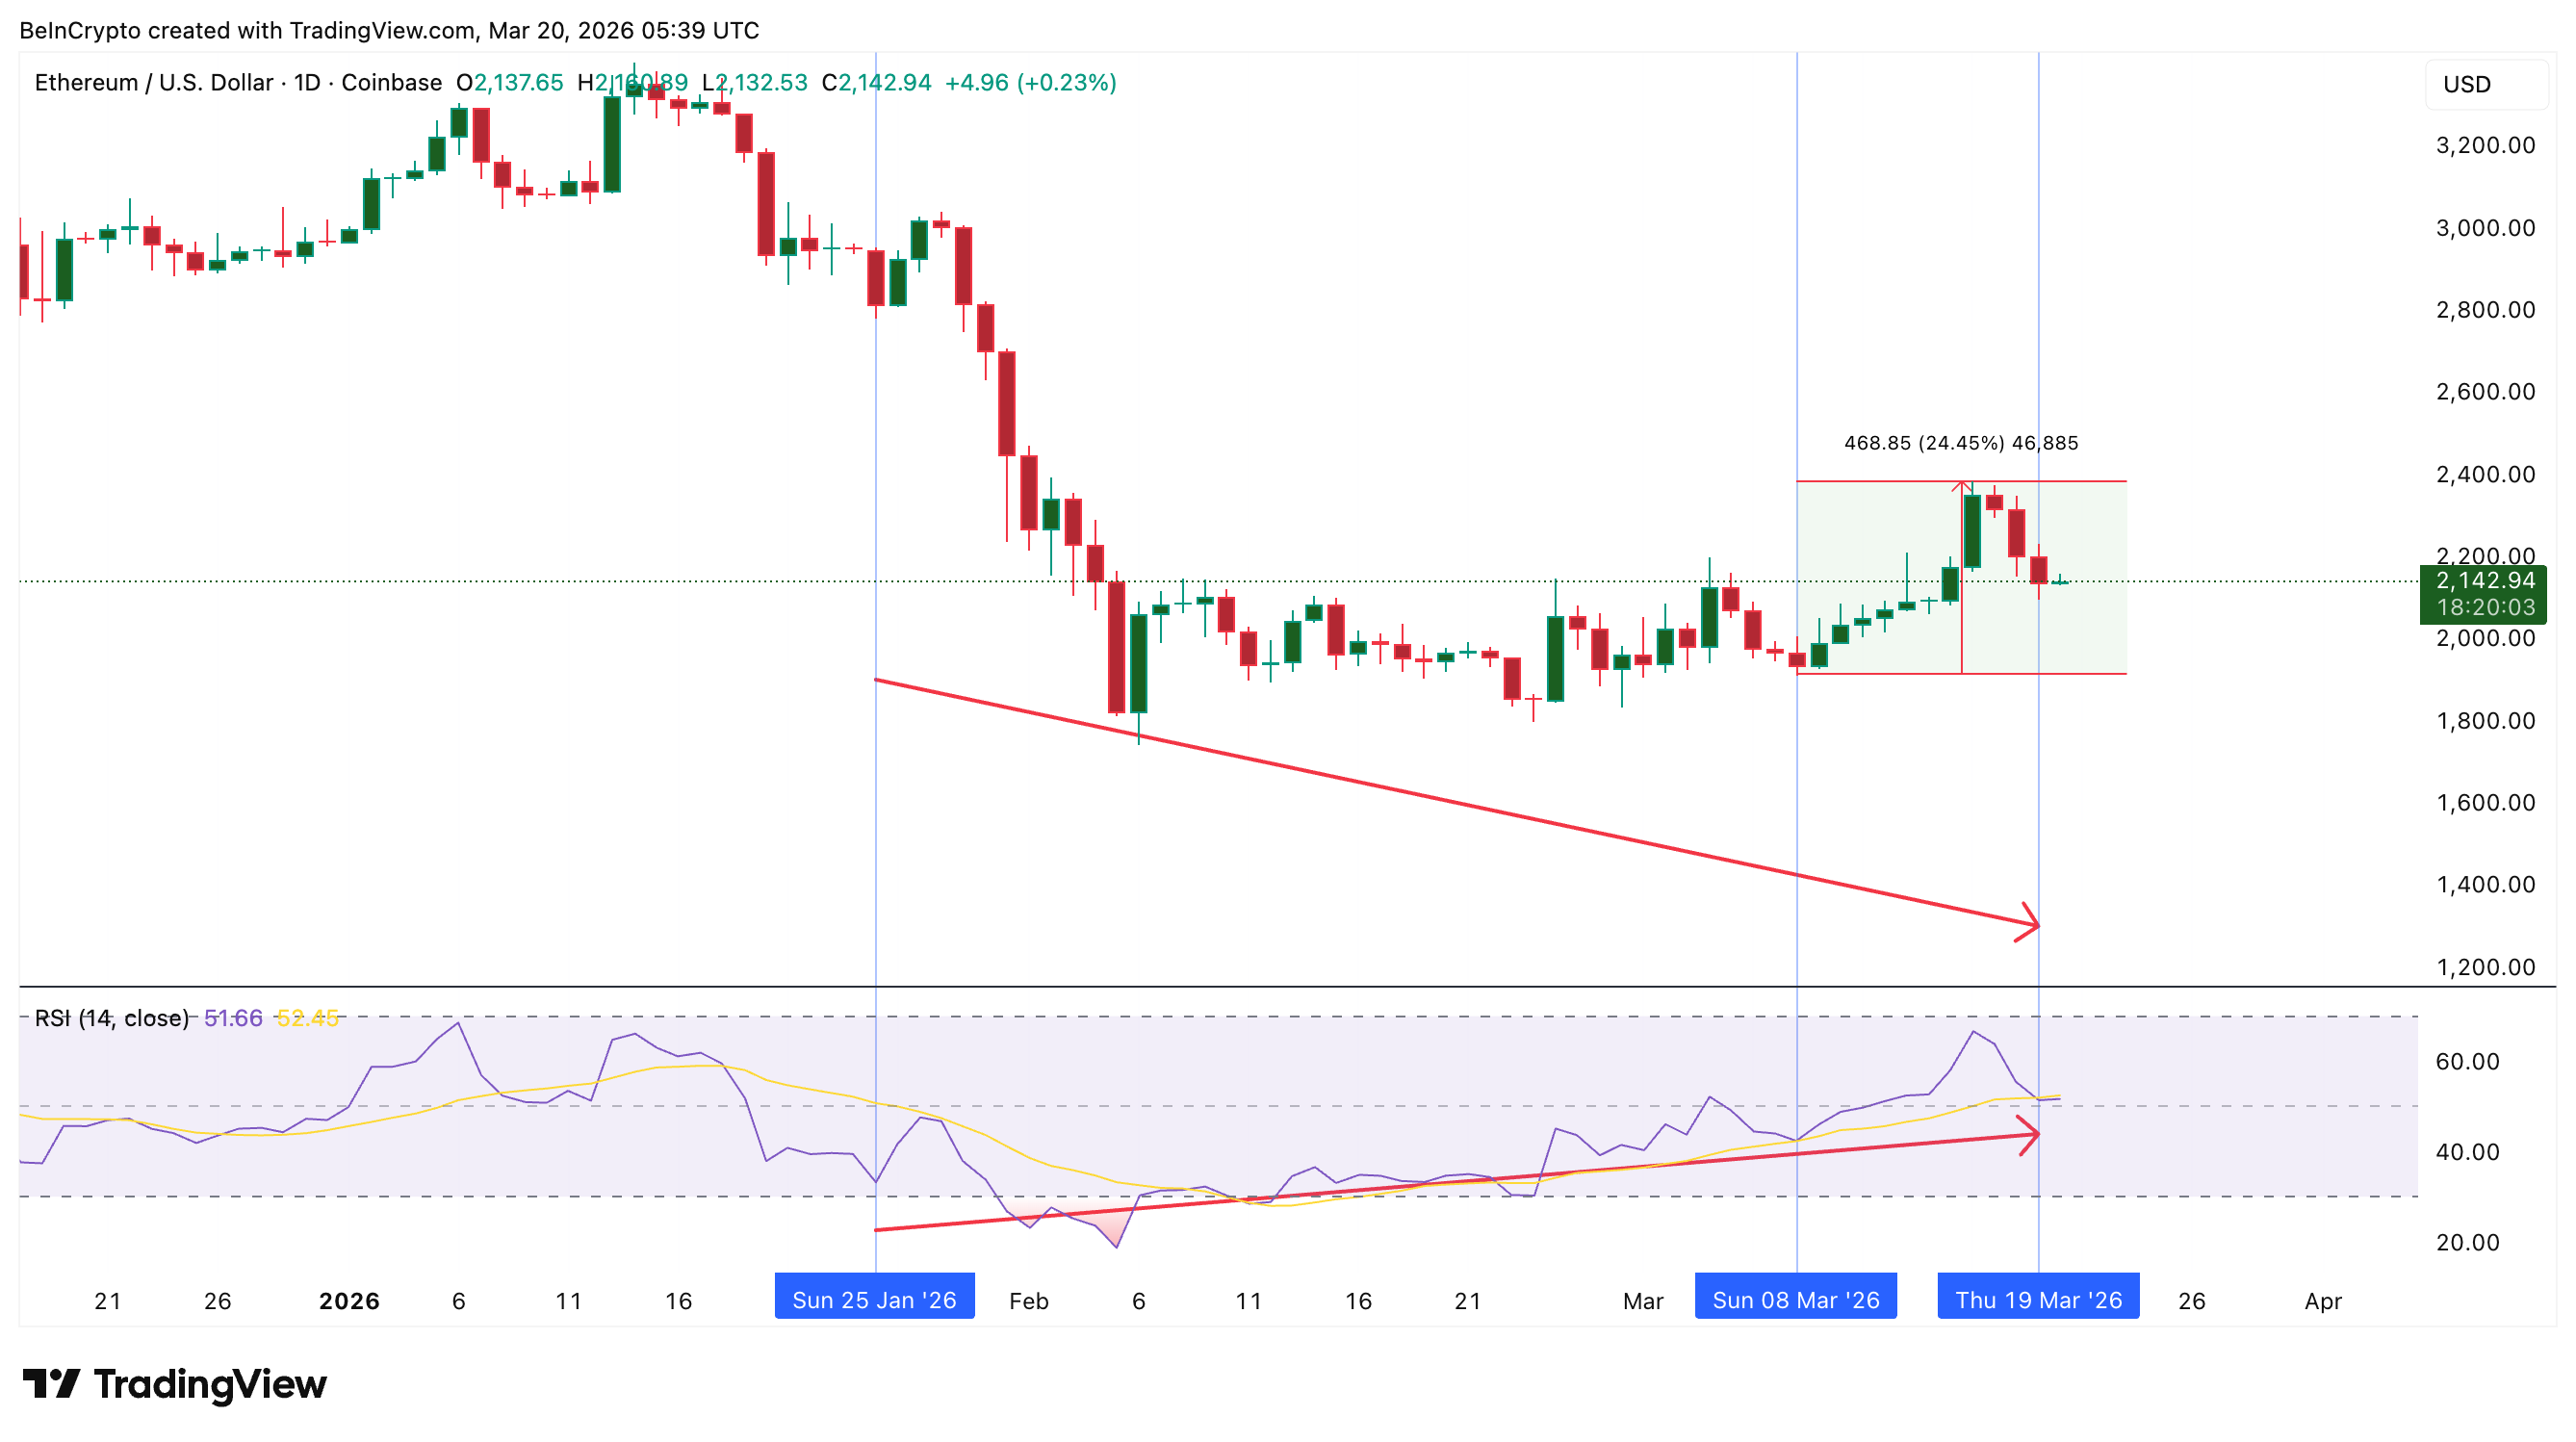
Our dear ETH is currently loitering around $2,140, nursing a 48% bruise from its January high of $3,400. But fear not! The derivatives and spot markets are having a jolly old argument about what happens next. Will it be a triumphant bounce or a slapstick tumble? Only the crystal ball knows-and it’s on holiday.
Companies House, that austere sentinel of corporate virtue, declared Zedxion’s demise due to “information or a statement in an application for incorporation that is misleading, false or deceptive.” A poetic irony, one might say, for a company built on the pillars of illusion.