So, here we are, watching Solana do its best impression of a phoenix rising from the ashes, or maybe just a really determined pigeon. Currently, it’s clawing back some of its lost value, which could mean a reversal is on the horizon. But wait! What’s that lurking on the chart? A hidden head and shoulders pattern! Sounds ominous, right? This could be the sign of a retracement that traders have been waiting for, or just a really bad hair day for SOL. It’s trading at about $197 after a bit of a recovery, but let’s not get too excited just yet.
Now, don’t get too comfy, because while Solana is showing some resilience above those all-important moving averages (cue the dramatic music), it’s only up by a modest 1.60%. The short-term bullish sentiment is like that friend who keeps saying “I’m fine” when they’re clearly not, thanks to a recent recovery from the $190 support level. But if the momentum fizzles out, those pesky resistance levels at $209 and $212 might just rain on Solana’s parade. ☔️
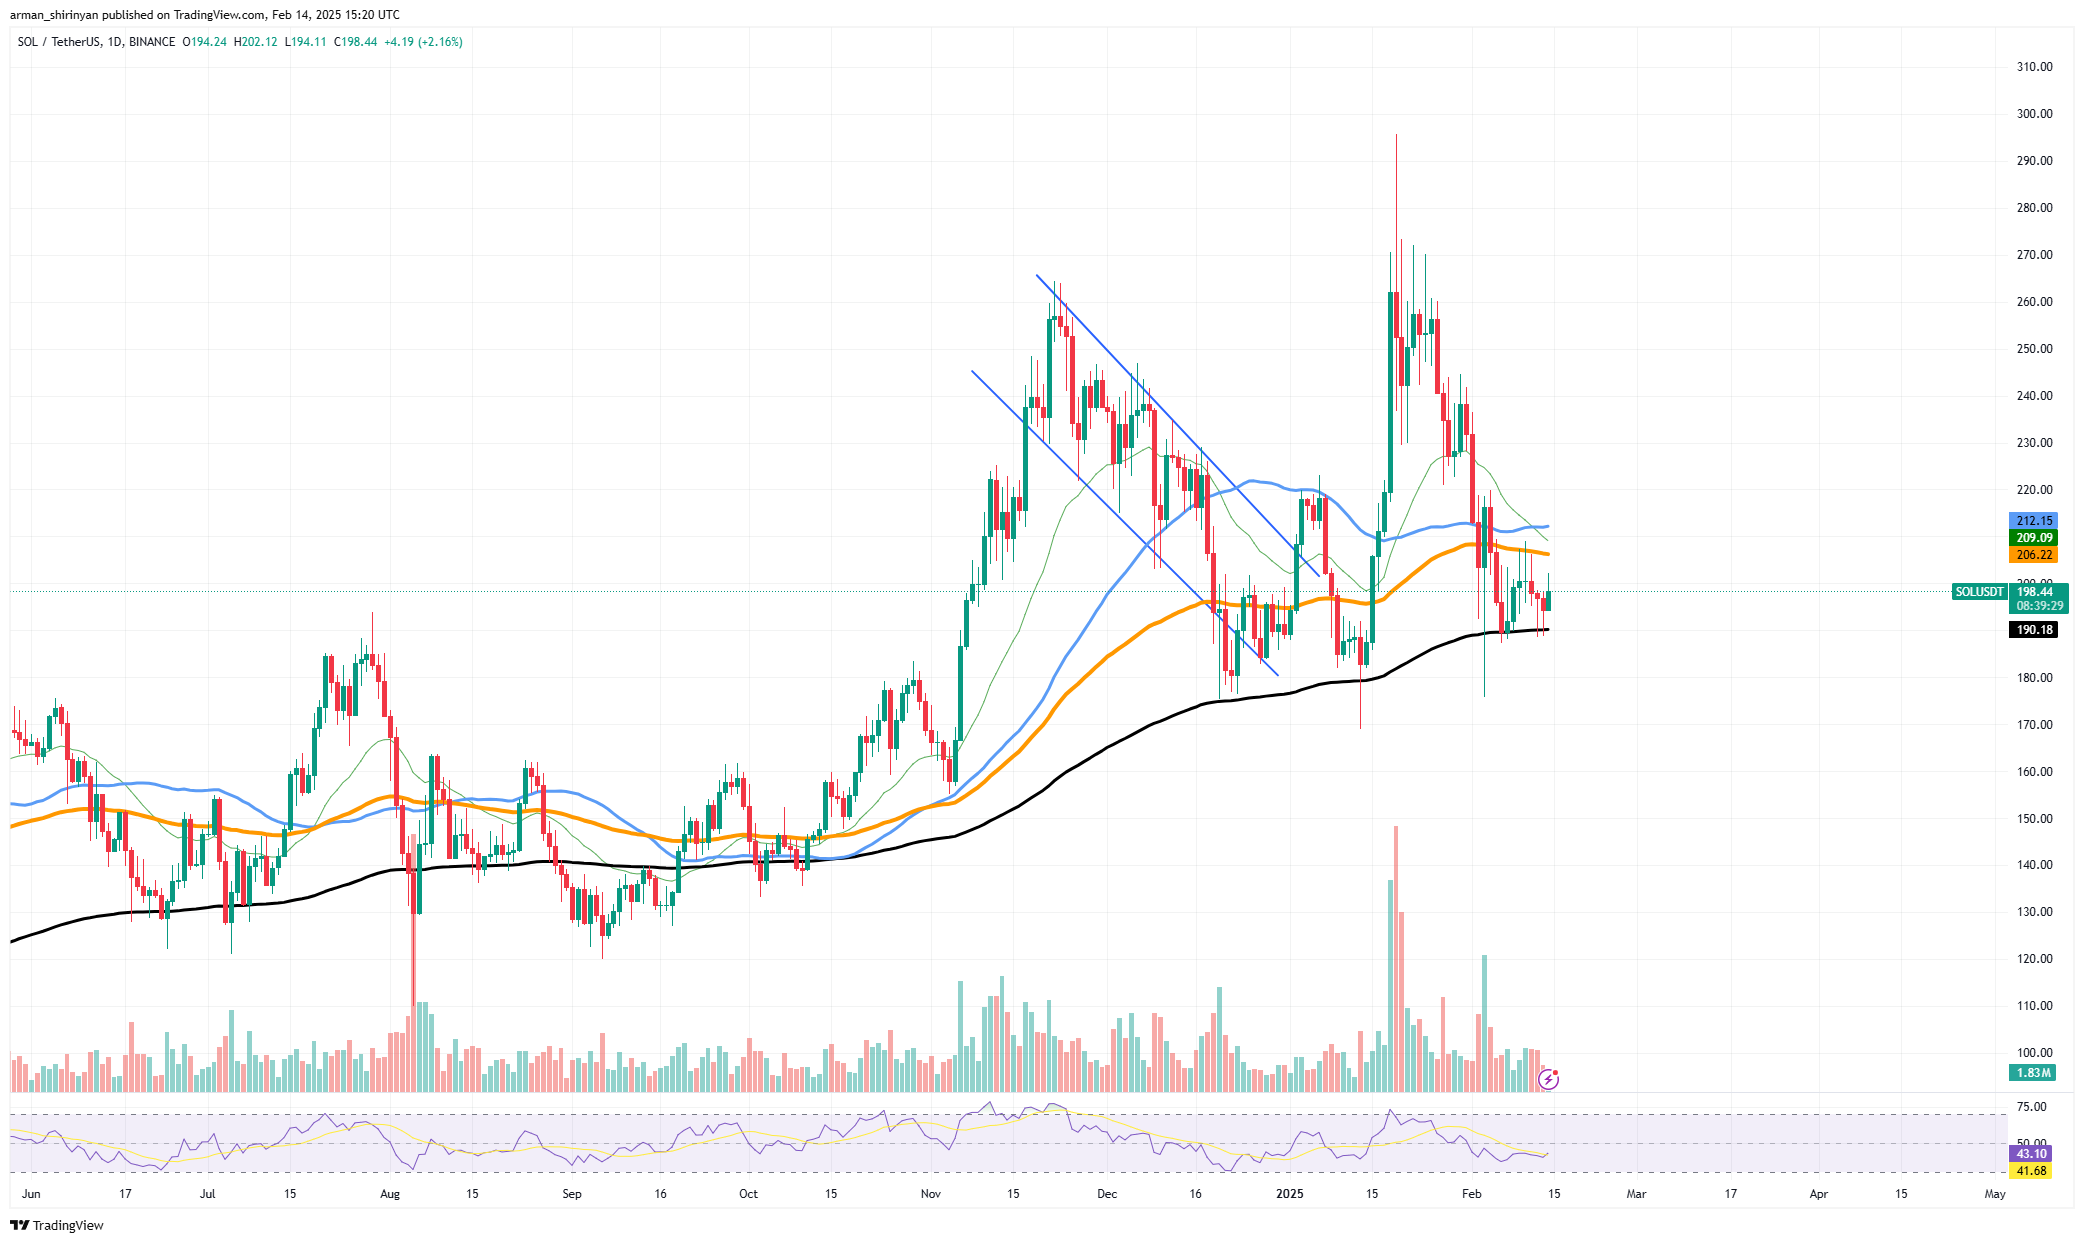
Ah, the classic head and shoulders pattern—like the bad breakup of the crypto world. It often signals the end of an uptrend and the start of a downturn. If SOL can’t shake off its resistance and complete that right shoulder, we might be looking at a decline back toward the $190–$180 support range. Talk about a dramatic plot twist! 📉
But fear not! If SOL can pull a rabbit out of its hat and break above $212, we might just see it strut its stuff toward $220 and reclaim those lost highs. Fingers crossed! 🤞
XRP Aims for a Comeback
Meanwhile, XRP is strutting around with a daily gain of 6.74% and a current price of $2.73, clearly ready for another short-term rally. It’s like that friend who always bounces back after a breakup—XRP is maintaining momentum above the 200-day moving average and showing off an impressive recovery from the $2.20 support level. 💪
With clear signs of a bullish reversal, XRP might just be gearing up for another rally, assuming it can overcome those pesky technical resistance levels. It’s like trying to get into a club with a strict bouncer—will it make it past the door? The 50-day Exponential Moving Average (EMA) is currently hanging out around $2.85, and a breakout above this level could mean the party is just getting started, pushing XRP closer to $3.00 and beyond. 🎉
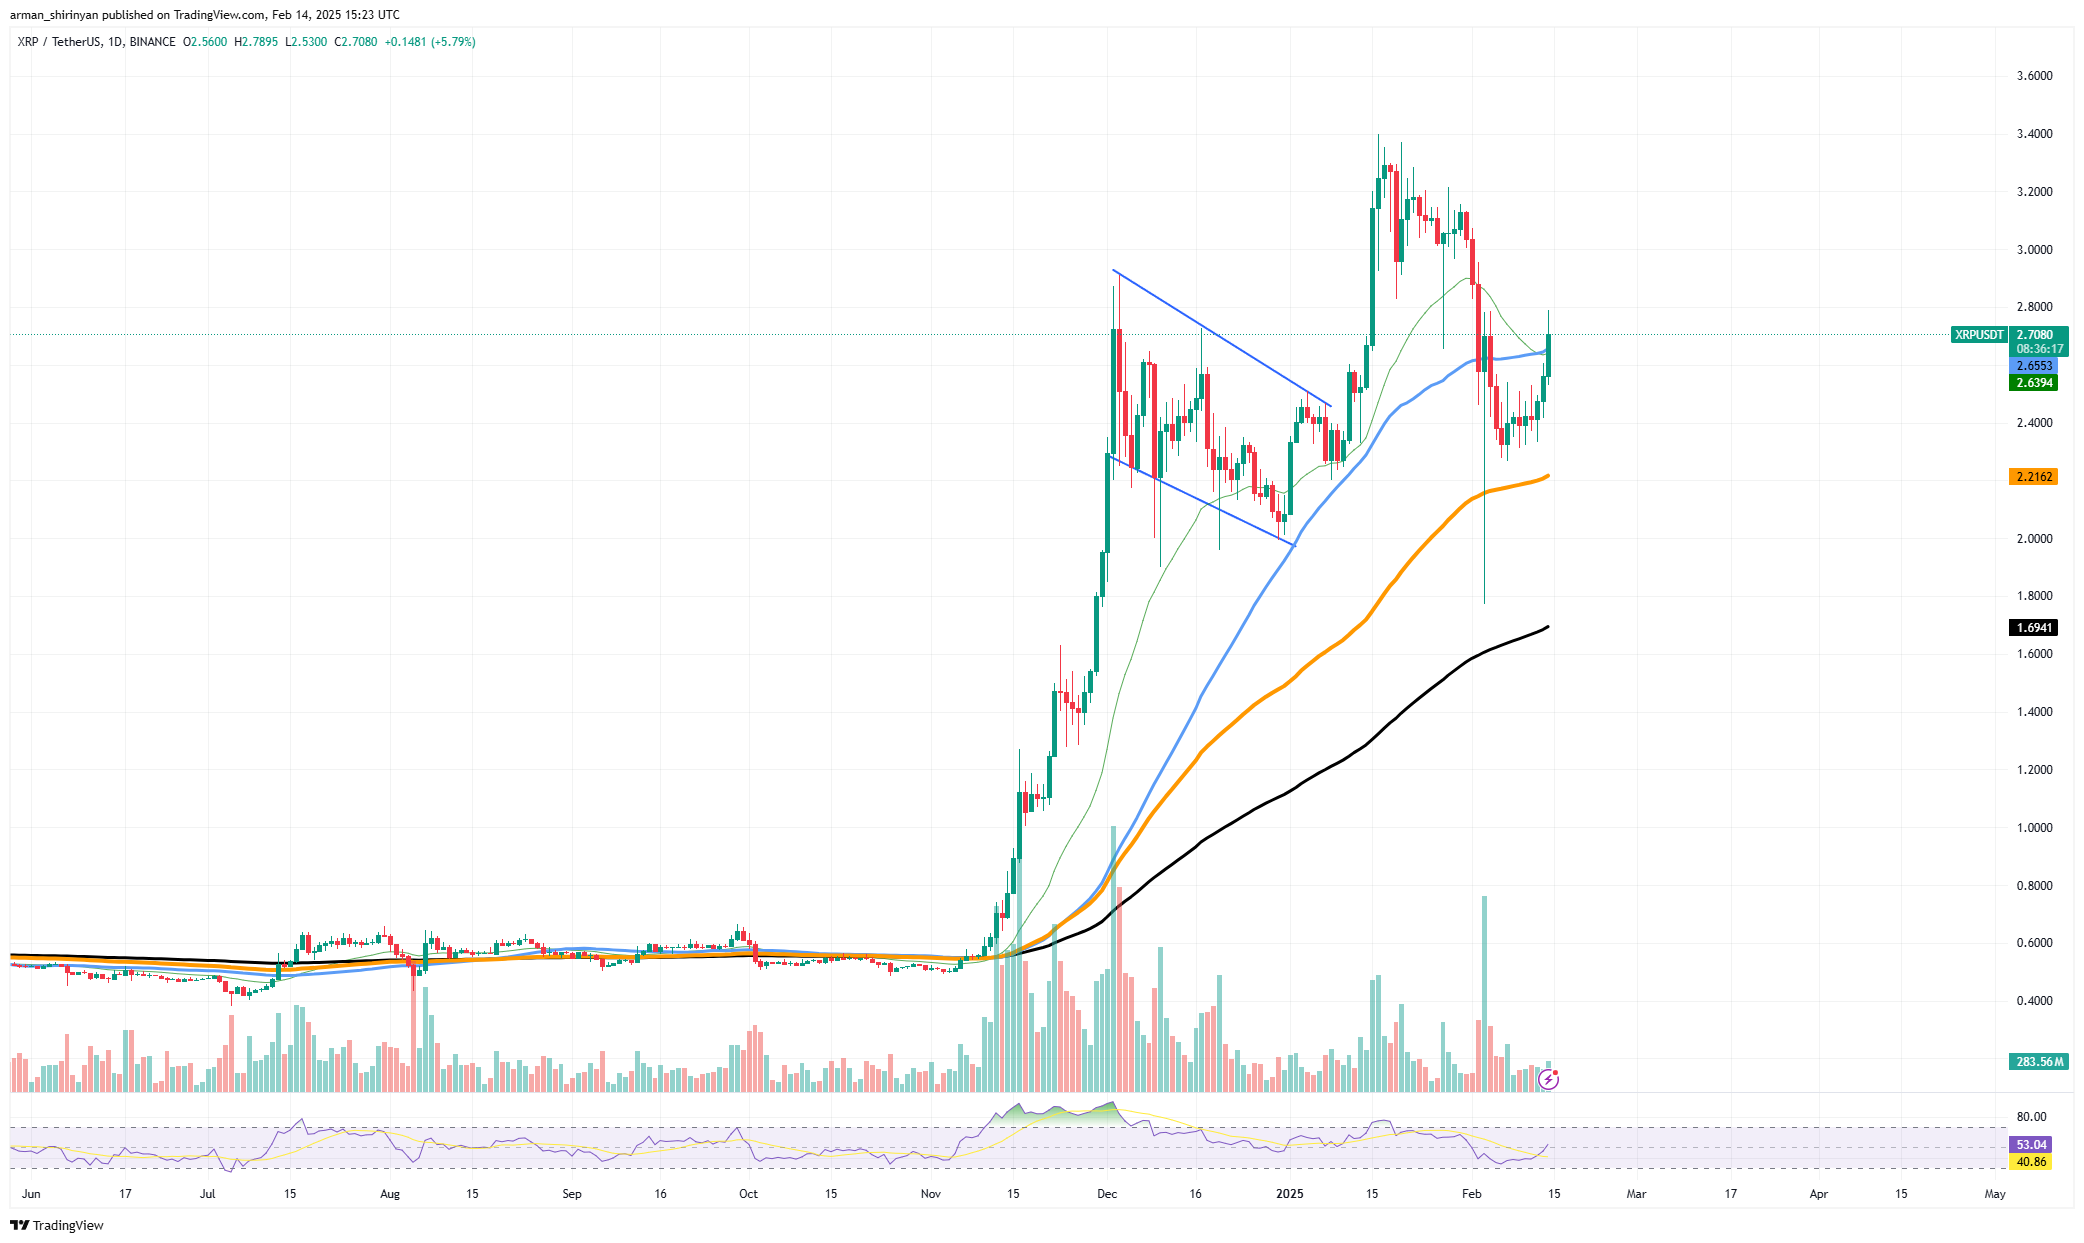
With XRP making higher lows and an increase in trading volume, the technical setup is looking pretty promising for a bullish breakout. And let’s not forget the RSI’s recovery from oversold levels—talk about a glow-up! ✨
If XRP can close above the 50 EMA, we might be in for a wild ride, attracting more traders like moths to a flame. But if it doesn’t break that resistance, it might just hang around between $2.40 and $2.85 for a bit, like a teenager refusing to leave their room. 🙄
Ethereum: Volatility on the Horizon?
Now, let’s talk about Ethereum, which is like that unpredictable friend who keeps you on your toes. A price shift might happen sooner than expected, thanks to the rapid conversion of moving averages that often brings some much-needed drama back to the market. ETH is currently trading at about $2,699, up 0.86% for the day after a prolonged period of decline. It’s like watching a soap opera—will it rise or fall? 📺
With those important moving averages starting to converge, the market might be gearing up for a breakout that could send ETH soaring above the crucial resistance level of $3,000. After a recent low of about $2,500, ETH is trying to bounce back, but it’s still below its 200-day and 50-day EMAs, which are currently at $3,124 and $3,085, respectively. It’s like trying to climb a mountain with flip-flops—good luck with that! 🏔️
A breakout above $3,000 might be on the horizon, given Ethereum’s recent price action and rising trading volume.
Read More
- Mr. Ring-a-Ding: Doctor Who’s Most Memorable Villain in Years
- Nine Sols: 6 Best Jin Farming Methods
- Top 8 UFC 5 Perks Every Fighter Should Use
- How to Get the Cataclysm Armor & Weapons in Oblivion Remastered Deluxe Edition
- Luffy DESTROYS Kizaru? One Piece Episode 1127 Release Date Revealed!
- Invincible’s Strongest Female Characters
- Unlock the Secrets: Khans of the Steppe DLC Release Time for Crusader Kings 3 Revealed!
- Eiichiro Oda: One Piece Creator Ranks 7th Among Best-Selling Authors Ever
- Unlock Roslit Bay’s Bestiary: Fisch Fishing Guide
- Sigourney Weaver Reveals Key Information About Her Role In The Mandalorian & Grogu
2025-02-15 03:13