Ah, volatility-our favorite little drama queen. As the markets tighten their belts, the technical indicators are suggesting that the next breakout will be either a triumphant encore or a disappointing flop. Will the coin continue its upward waltz, or will it trip and fall into the deep abyss of correction? Only time-and a bit of luck-will tell. 🎭
Hidden Divergences: WIF’s Next Act Is About to Begin
According to the ever-dramatic Crypto GEMs (who is, of course, never wrong), there are a series of RSI divergences gracing the Dogwifhat chart like a mysterious plot twist in a noir film. On the one hand, we have a hidden bullish divergence, where the RSI is showing higher lows while the price itself is busy making lower lows-because why not keep things interesting? This typically suggests some buying strength lurking beneath the surface, ready to burst forth in a dramatic short-term rally or reversal. As of now, the coin is doing its best to hold on to that sweet $0.55 support. 🎩
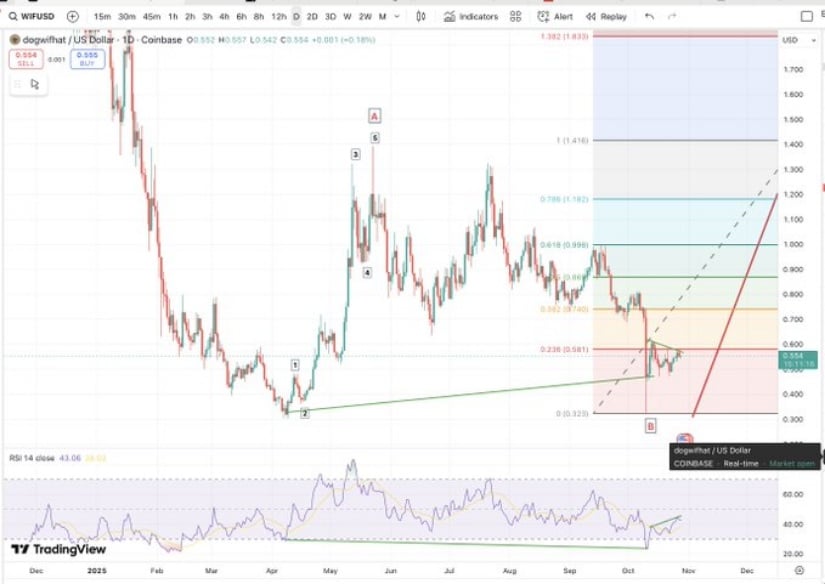
But wait-there’s more! A hidden bearish divergence has also made a surprise appearance. Picture this: the price is reaching new highs, but the RSI is just sitting there, unamused, failing to reflect this momentum. Oh dear. Unless the token breaks the $0.619 resistance level, this little bearish whisper might just ruin the party. But don’t worry, if the coin manages to break out, it could soar toward $1.416, sending its bullish wave into the stratosphere. 🎢
Market Data: WIF’s Dramatic Pause at $0.55
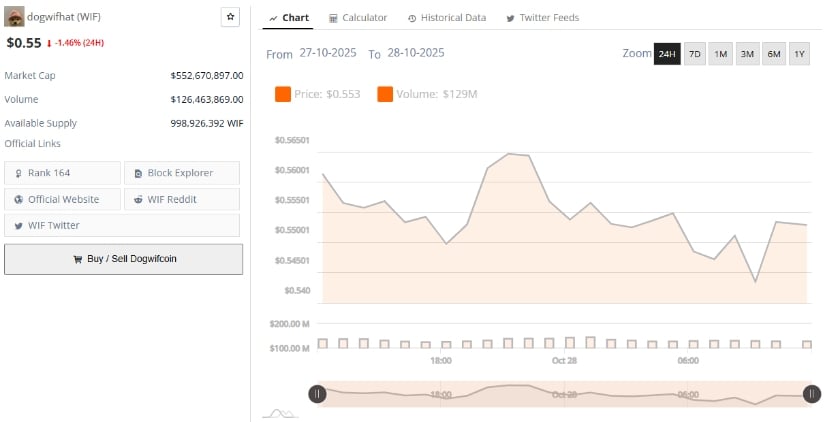
At the time of this writing, Dogwifhat is lounging comfortably at $0.55, down 1.46% over the last 24 hours. With a market cap of $552.67 million, it’s not exactly the darling of the crypto world, but it’s doing alright. The trading volume is hovering at a modest $126.46 million, and there are 998.9 million tokens in circulation. Oh, and it’s sitting comfortably at #164 by market cap, because why shoot for the stars when you can just take a nap at a respectable altitude? 🛋️
This little consolidation phase is like a polite dinner party where no one’s making a scene, but we all know something’s about to happen. The buyers are showing cautious optimism, accumulating within a narrow range. If meme-token liquidity returns, we might see a sudden surge in demand-especially with its oh-so-glamorous connection to the Solana ecosystem. 🍸
RSI and MACD: The Quiet Heroics of Gradual Recovery
As the clock strikes $0.551 (down 1% for the day, according to TradingView), the RSI stands at 42.86-just above its moving average of 39.03. It’s a subtle improvement after all that relentless selling. Meanwhile, the MACD has a reading of -0.366 versus the signal line at -0.483. The histogram is a cheery little 0.117, confirming that the downside momentum is slowly losing steam. Progress, darling, progress. 🌱
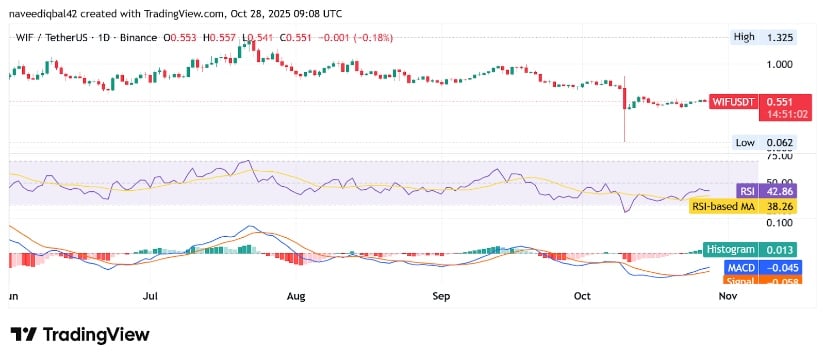
For the token to avoid further misery, holding support above $0.55 is absolutely critical. If the RSI keeps rising and the MACD decides to step into positive territory, we might just see a short-term recovery toward $0.619 and beyond. But fail to hold this support? Well, it could mean a slow, sad descent to the next level of support at $0.47. For now, let’s cling to the fragile hope that the bulls will continue their valiant defense. 🏰
Read More
- All Shadow Armor Locations in Crimson Desert
- Jujutsu Kaisen Season 3 Episode 12 Release Date
- Dark Marksman Armor Locations in Crimson Desert
- Sega Reveals Official Sonic Timeline: From Prehistoric to Modern Era
- How to Beat Antumbra’s Sword (Sanctum of Absolution) in Crimson Desert
- Top 5 Militaristic Civs in Civilization 7
- Genshin Impact Dev Teases New Open-World MMO With Realistic Graphics
- Sakuga: The Hidden Art Driving Anime’s Stunning Visual Revolution!
- Keeping AI Agents on Track: A New Approach to Reliable Action
- Where to Pack and Sell Trade Goods in Crimson Desert
2025-10-29 00:38