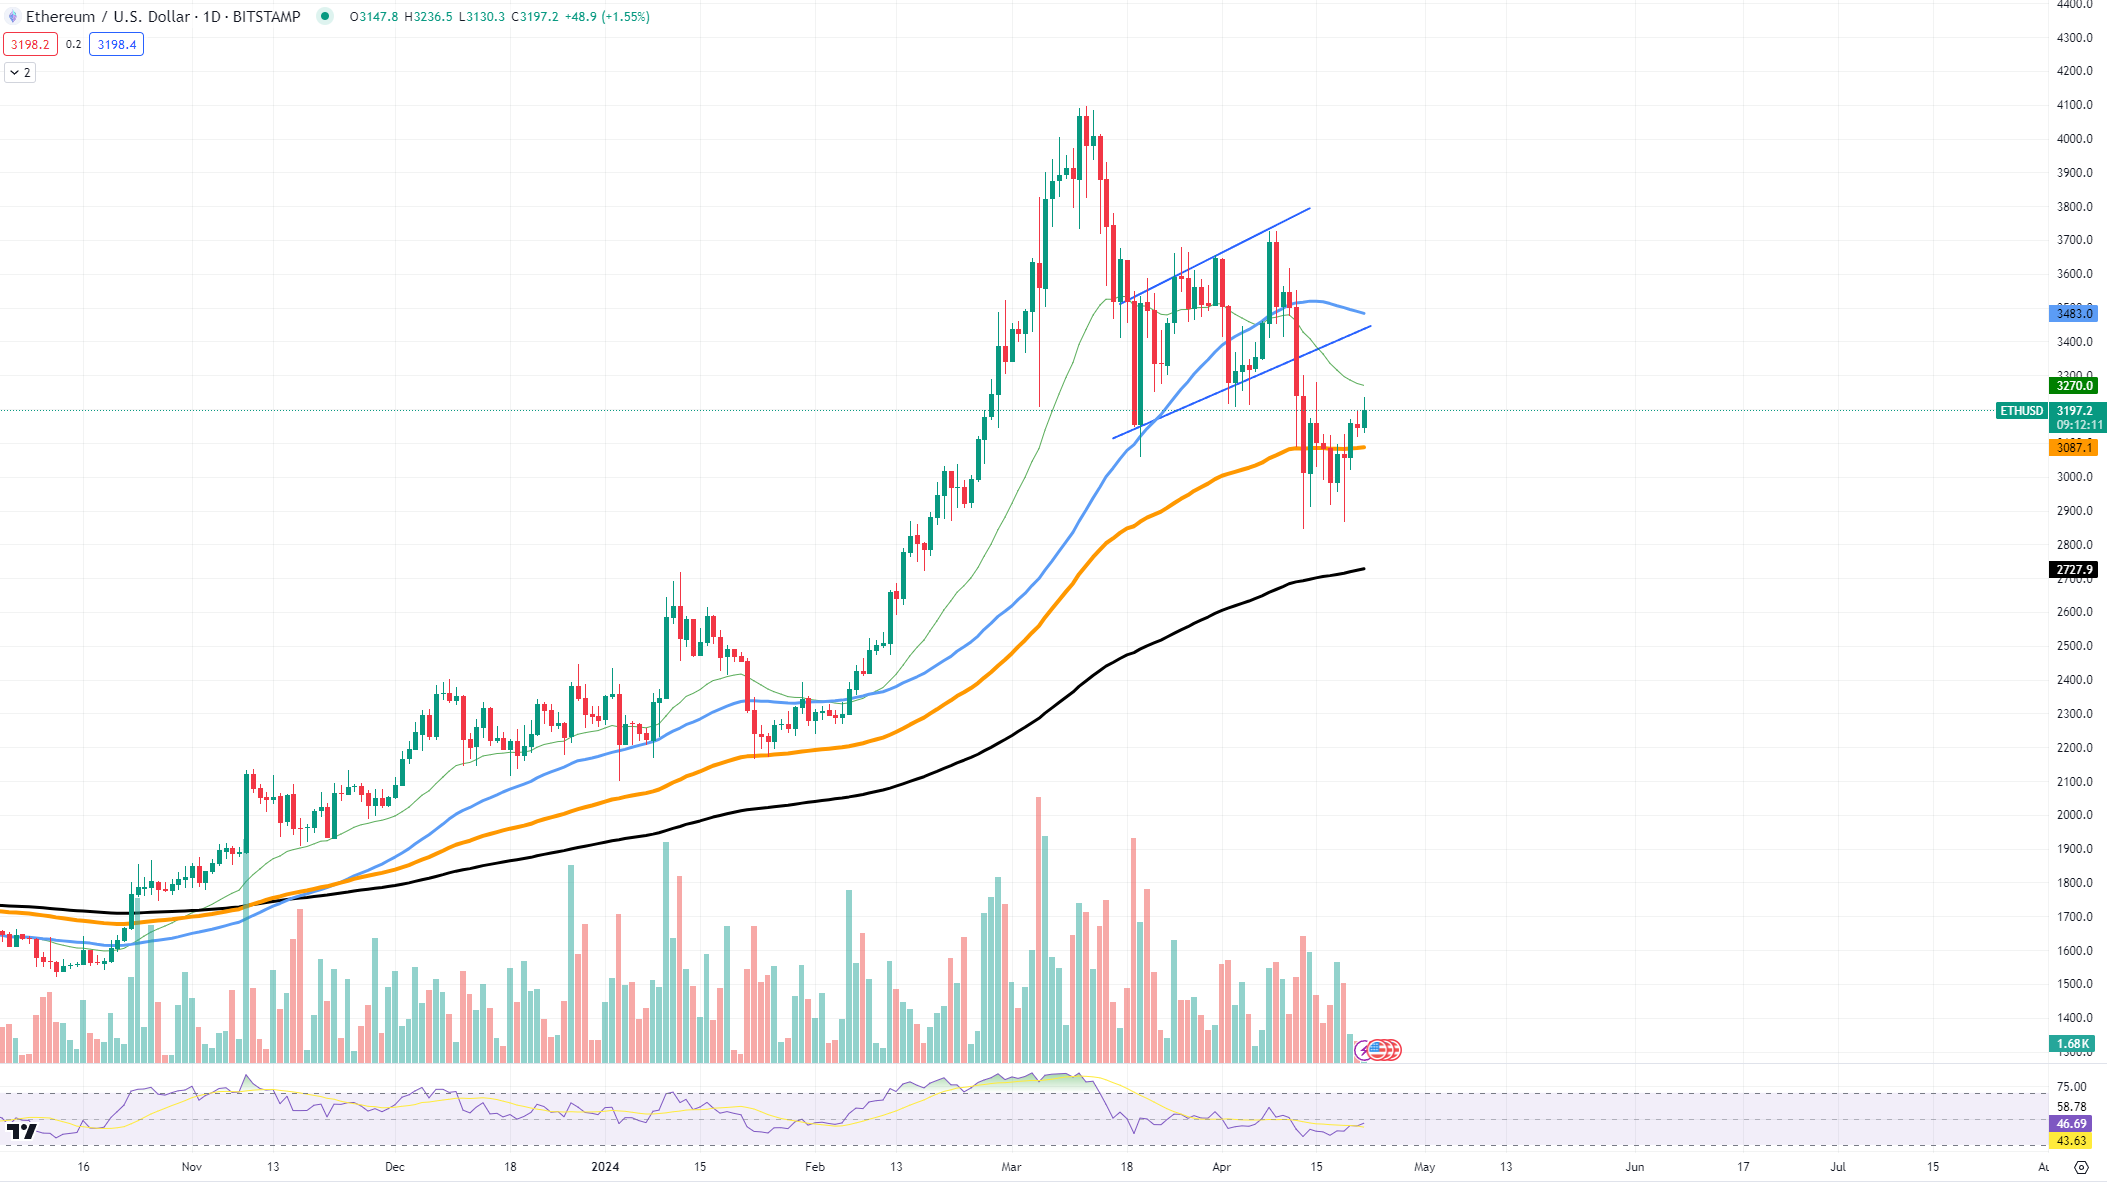
ETH surpasses $3,000 mark, shifting the crypto community’s outlook towards it back to optimistic. This bounce back has propelled it above its 100-day Exponential Moving Average (EMA), suggesting that positive market sentiment may be returning.
Despite the increase in prices, there’s been a notable decline in trading activity. This decrease in demand from traders could be a sign that the current upward trend may not have enough strength to overcome the major resistance levels coming up. One of these resistance levels is the 50-day Moving Average, which has historically hindered price growth.

Looking closely at Ethereum‘s daily chart, we notice that it has lately departed from an upward trendline, possibly signaling a change in direction. Such departures from established trends can result in increased price fluctuations. However, it’s unclear whether this is merely a brief departure or the commencement of a new trend.
The price of the asset has created a support zone around $2,900, which is where the 100-day moving average is located. This area has acted as a trampoline for the recent price rise. On the other hand, there’s noticeable resistance at the $3,200 mark, which is home to the 50-day moving average. The coming struggle between sellers and buyers could take place around this moving average.
Moving forward, if Ethereum manages to maintain its present position and potentially surpass the 50-day moving average, it may set the stage for a new bullish trend. However, a significant challenge awaits as Ethereum needs to generate sufficient trading volume and attract buyers in order to overcome these impending resistance levels.
Is Bitcoin ready?
Bitcoin prepares for another battle, according to price indicators. The cryptocurrency has broken above its 26-day Exponential Moving Average (EMA), serving as a marker of short-term price trend. This development goes beyond mere number crunching; it may indicate that Bitcoin is gearing up for a resurgence.
An important upcoming clash for Bitcoin lies at the 50-day moving average. If Bitcoin manages to surpass this benchmark, it could serve as a powerful signal for bulls, potentially paving the way for a surge toward the record high of $100,000. However, it’s important to remember that reaching this milestone won’t be easy; there will likely be challenges along the way.
After the halving event, the asset has shown strong signs of bouncing back. Its current price around $63,000 has the crypto community excitedly discussing the next significant milestone: reaching $70,000.
Examining the graph, it’s clear that if the bulls continue to drive up the price and surpass the 50-day moving average, reaching $70,000 could shift from being an idealistic goal to a tangible possibility. Conversely, if Bitcoin experiences a pause and the bears take control, there is solid support around $59,000, which has historically provided a firm base for the price.
Reaching the $100,000 mark for Bitcoin is still a significant goal, but given the substantial resources required to get there, it feels far off. The Bitcoin landscape is influenced by numerous variables, making it challenging to predict its future on the present market.
Cardano‘s surge
Cardano is getting close to crossing the 200-day moving average (MA). This significant line may influence its direction in the near future. In the past, the 200 MA has been an important indicator of market sentiment, acting as a bullish or bearish signal for other assets, and now it’s a critical test for Cardano.
The price of ADA hovers near the $0.50 mark, a level that was recently broken. This figure could become a significant source of support if ADA manages to stay above it. If so, attention turns to whether ADA can continue its uptrend.
If ADA cannot maintain its position, the next significant support level is at $0.44 – the prior turning point and lowest local price. This level is important because it was the last place where ADA encountered substantial buying activity, enabling it to rebound and rise.
On the other hand, ADA‘s price drops might bring challenges because a decrease in trading activity while prices rise could imply that buyers are uncertain, increasing the likelihood of a reversal.
Read More
- LUNC PREDICTION. LUNC cryptocurrency
- BTC PREDICTION. BTC cryptocurrency
- SOL PREDICTION. SOL cryptocurrency
- USD COP PREDICTION
- BICO PREDICTION. BICO cryptocurrency
- USD ZAR PREDICTION
- VANRY PREDICTION. VANRY cryptocurrency
- USD PHP PREDICTION
- USD CLP PREDICTION
- WQT PREDICTION. WQT cryptocurrency
2024-04-23 03:49