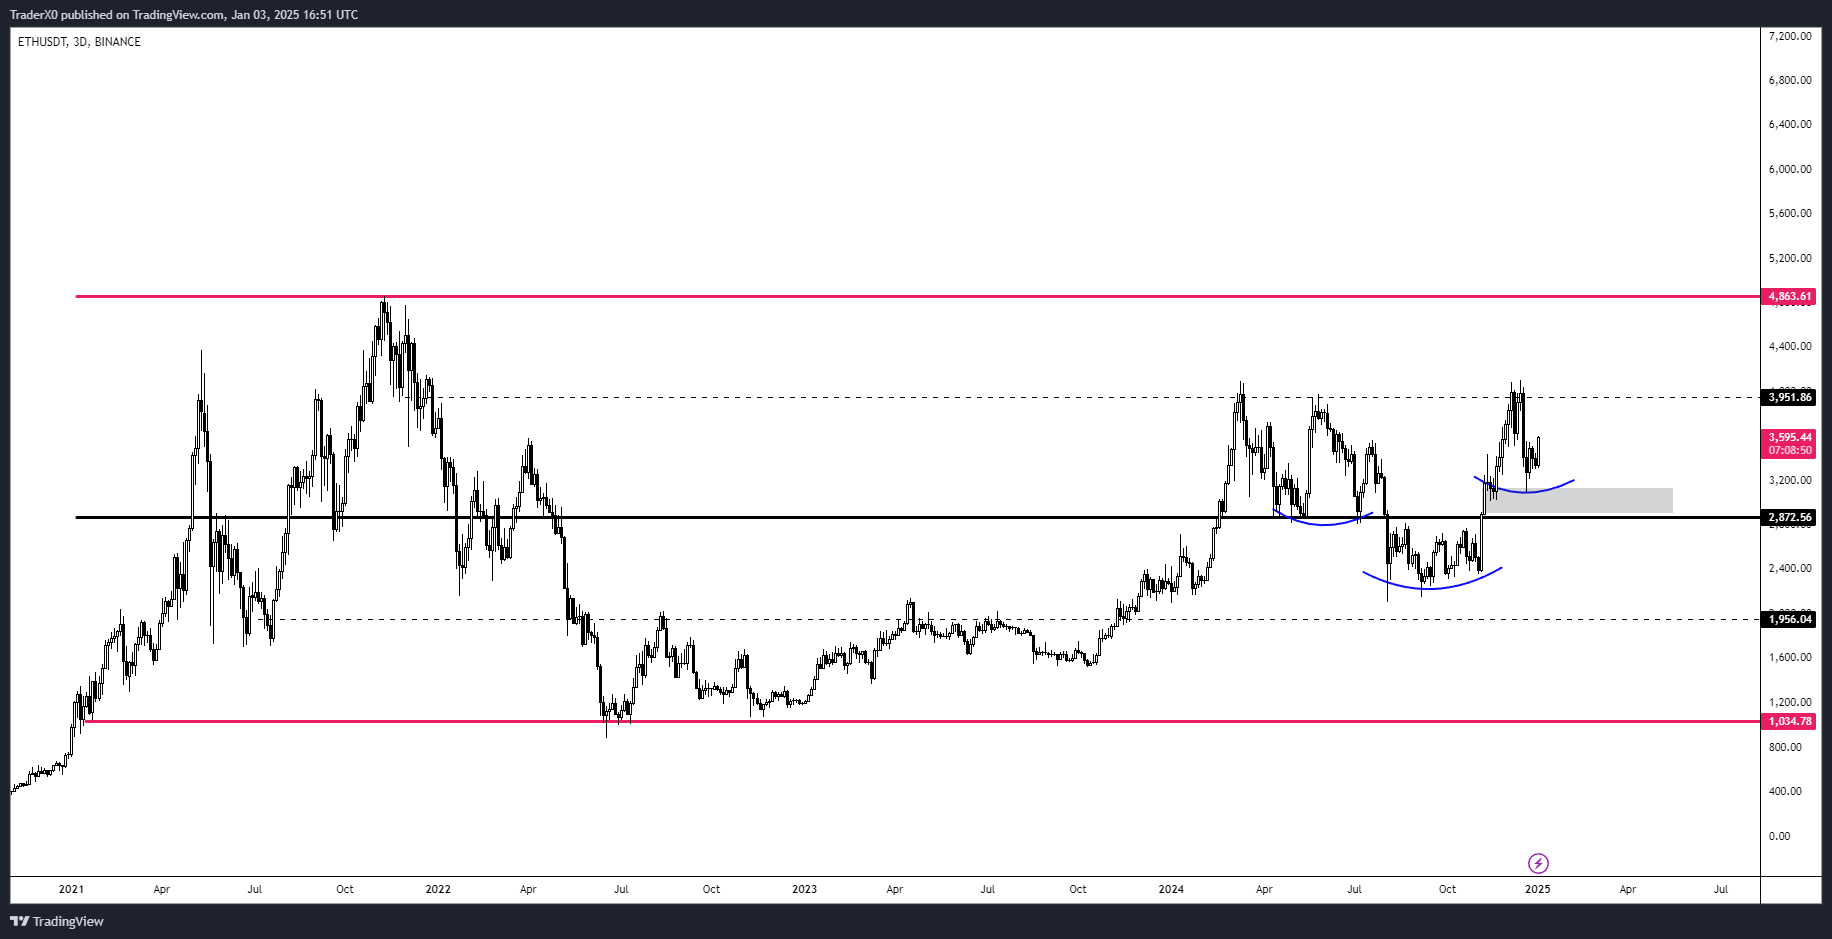
Today, Ethereum (ETH) breached the nearby barrier at $3,670, fueling speculation among traders about a potential breakthrough above the long-standing $4,000 resistance. Several cryptocurrency analysts are bullish on ETH and believe it could potentially set new record highs.
Ethereum To Benefit From Inverse Head-And-Shoulders Pattern?
In simpler terms, Ethereum, the second-largest digital currency with a market value over $450 billion, seems poised to challenge the significant resistance at around $4,000 again. To put this into perspective, Ethereum has attempted to surpass the $4,000 mark on three separate occasions since March 2024, but has not been successful in doing so each time.
Based on the insights of experienced cryptocurrency expert Trader_XO, the fourth try could potentially be successful. This expert believes that approaching the $4,000 mark for the fourth time may increase the chances of surmounting this persistent price hurdle.
In Trader_XO’s analysis, a chart depicting an inverse head-and-shoulders structure was presented. For those unaware, this bullish chart formation may suggest a possible change in trend direction from downward to upward. It comprises three low points: the “head,” which is a lower point, appearing between two higher points, referred to as the “shoulders.

In simple terms, a breakout happens when the price goes beyond a connecting line (called the “neckline”) that joins the highest points between the lowest points. For Ethereum, the neckline is roughly at $4,000. If Ethereum manages to surpass $4,000 and then successfully retests this level as new support, it could potentially set the stage for Ethereum to reach new all-time highs in the near future.
According to Trader_XO’s assessment, there seems to be agreement with crypto analyst Daghan, who predicts Ethereum could potentially hit a new all-time high (ATH) that might lead to an upward trend reaching approximately $8,047. Notably, this is the viewpoint expressed by the analyst.
For the excitement to kick off in earnest, Ether (ETH) needs to surpass $4150. So far, things are still in their early stages. This appears to be a classic continuation pattern, suggesting a robust upward trend is on the horizon, but it may take some time to fully materialize.

Other Technical Indicators Bullish For ETH
Apart from the inverted head-and-shoulders formation, crypto expert Ali Martinez also emphasized that Ethereum is maintaining its position robustly within an increasing parallel channel, with a potential for reaching the $6,000 price mark.
In simpler terms, an ascending parallel channel on a chart represents a bullish pattern formed by two lines that gradually slope upwards. These lines enclose price fluctuations. This pattern indicates a consistent increase in highs and lows, which suggests a strong upward trend. Breakouts, or significant price movements, can occur either above or below this channel.
Furthermore, a fresh analysis indicates that Ethereum’s weekly Relative Strength Indicator (RSI) has been reinitialized, potentially fueling additional growth for ETH to set new all-time highs. Currently, ETH is being traded at $3,696 and has risen by 1.9% over the past day.

Read More
- REPO: How To Fix Client Timeout
- UNLOCK ALL MINECRAFT LAUNCHER SKILLS
- Unaware Atelier Master: New Trailer Reveals April 2025 Fantasy Adventure!
- 10 Characters You Won’t Believe Are Coming Back in the Next God of War
- 8 Best Souls-Like Games With Co-op
- Top 8 UFC 5 Perks Every Fighter Should Use
- All Balatro Cheats (Developer Debug Menu)
- Unlock Wild Cookie Makeovers with Shroomie Shenanigans Event Guide in Cookie Run: Kingdom!
- How to Reach 80,000M in Dead Rails
- BTC PREDICTION. BTC cryptocurrency
2025-01-07 10:41