Ah, the crypto circus is back in town, folks! 🎪 Bitcoin and Ethereum, those star-crossed lovers of the financial world, are once again making eyes at each other, rising by more than 7% in the past week. 🌝 Just when you thought the bears had hibernated for good, along comes crypto analyst John Carter, armed with a chart and a dramatic flair that would make Shakespeare blush. 🖋️ He’s predicting the next big move in the ETH/BTC saga, complete with a sell zone that’s practically screaming, “Cash me outside, how bow dah?” 💸
Ethereum’s Date with Destiny (and Resistance)
John Carter, the crypto market’s resident Nostradamus, has taken to X (formerly Twitter, because why not?) to share his latest masterpiece: a chart so intricate it could double as modern art. 🎨 According to Carter, Ethereum is teetering on the edge of a Broadening Wedge pattern-yes, that’s a thing-like a tightrope walker in a windstorm. 🌪️ The price is hovering near a technical level so critical, it’s basically the crypto equivalent of a cliffhanger in a Netflix series. 🍿
Apparently, Ethereum has been stuck in this wedge for years, bouncing between trendlines like a ping-pong ball in a wind tunnel. 🏓 Recently, it bounced off the lower support zone with the grace of a cat landing on its feet, and now it’s charging toward the upper boundary like a bull in a china shop. 🐂 Carter claims this is the “final phase of consolidation,” which sounds suspiciously like the calm before the storm. ⛈️
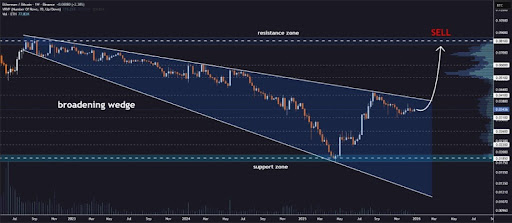
If ETH/BTC breaks out above the wedge, Carter predicts it’ll hit $0.041, then $0.051, and finally $0.060-because why stop at one target when you can have three? 🎯 The grand finale? A whopping $0.081, where traders should allegedly start taking profits. 🤑 But let’s be real, who’s actually going to sell? We’re all just holding until the moon, right? 🚀
Support Levels: Crypto’s Safety Net
Of course, Carter wouldn’t be a proper analyst if he didn’t also outline the support levels-those magical lines that supposedly catch falling prices like a trampoline. 🪂 The first one’s at $0.031, then $0.026, and if things get really spicy, $0.022. 🌶️ If all else fails, there’s the Broadening Wedge’s “support zone” at $0.0185, which sounds like the last stop before the crypto abyss. 🕳️ Below that? Well, let’s just say $0.010 is where dreams go to die. 💔

So, there you have it: Ethereum vs Bitcoin, the crypto soap opera that never ends. 🎭 Will ETH break out and soar to new heights, or will it crash and burn in a blaze of glory? Only time will tell. In the meantime, grab your popcorn and enjoy the show. 🍿 Just remember, in the world of crypto, the only thing certain is uncertainty-and John Carter’s charts. 📈
Read More
- All Shadow Armor Locations in Crimson Desert
- How to Get the Sunset Reed Armor Set and Hollow Visage Sword in Crimson Desert
- Best Bows in Crimson Desert
- All Skyblazer Armor Locations in Crimson Desert
- All Golden Greed Armor Locations in Crimson Desert
- Wings of Iron Walkthrough in Crimson Desert
- Marni Laser Helm Location & Upgrade in Crimson Desert
- All Helfryn Armor Locations in Crimson Desert
- How to Craft the Elegant Carmine Armor in Crimson Desert
- Keeping Large AI Models Connected Through Network Chaos
2026-01-07 03:19