Ah, Ethereum, that tempestuous prima donna of the digital realm, is once again pirouetting on the precipice of $2,100, as the market, that fickle maestro, conducts a symphony of indecision. Bulls and bears, those eternal rivals, stand locked in a stalemate, their swords glinting under the harsh light of uncertainty. A fleeting moment of reprieve arrived when the great Trump, that oracle of geopolitical whimsy, proclaimed the Strait of Hormuz unshackled. The markets, ever the drama queens, interpreted this as a dovish breeze, and both Bitcoin and Ethereum, those star-crossed lovers, rebounded in a fleeting embrace. Alas, the relief was as ephemeral as a Moscow fog at dawn.
XWIN Research Japan, those modern-day soothsayers, have peered into the entrails of Ethereum’s market structure and discovered a paradox that would make even the Master and Margarita scratch their heads. The signs of a healthy market are all present: Spot Taker CVD remains positive, funding rates hover above zero, and ETH continues its exodus from exchanges like a herd of cats fleeing a bath. Yet, the price, that obstinate creature, refuses to ascend. It is as if the market is a stage, and the actors are performing a farce, each step forward met with an invisible hand pushing them back.
From the lofty heights of $2,375 on May 11, Ethereum tumbled to a mere $2,031 by May 23-a 14% descent, all while the internal metrics sang hymns of bullish glory. It is as if the market has been possessed by a mischievous demon, one that delights in contradiction. XWIN Research Japan, in their wisdom, have identified the culprit: hidden sellers, those spectral entities, lurking in the shadows of the order book, absorbing buys with the patience of a cat stalking a mouse.
Hidden Sellers, Macro Headwinds, and the Market’s Theatrical Collapse
The XWIN report, with its surgical precision, reveals the mechanism behind this charade. Hidden liquidity, that elusive phantom, is the structural villain. Large sell orders, placed by market makers and whales, sit quietly in the order book, absorbing aggressive buying without so much as a whisper in the metrics that retail traders worship. The surface signals appear bullish, for the buyers are indeed present, but the price falls, dragged down by sellers who are larger, more patient, and invisible to the conventional gaze.
The macro environment, that ever-present specter, compounds this structural pressure. Despite the CLARITY Act briefly soothing the nerves of the digital asset faithful, the markets have refocused on inflation risks and the higher-for-longer interest rate environment, that persistent bogeyman of the Federal Reserve. For Ethereum, that high-beta diva, this macro backdrop is a headwind that no amount of on-chain improvement can fully neutralize.

The derivatives market adds the final layer to this tragicomic opera. Healthy bullish trends require rising open interest, stable funding, and expanding long positioning-a trifecta as rare as a honest man in a bureaucracy. Instead, what we see is short covering and deleveraging, driving mechanical price bounces that are as genuine as a politician’s promise.
Technically, Ethereum is approaching support zones at approximately $1,984 and $1,937-levels that the report identifies as potentially significant, should macro conditions stabilize and real spot demand return. At these prices, the asset could be viewed as genuinely undervalued relative to its network fundamentals. Whether this reassessment arrives before a test of deeper levels depends entirely on whether the hidden selling pressure exhausts itself before the technical support does. It is a game of chicken, played out on the grand stage of the market, with Ethereum as the reluctant participant.
Ethereum’s Critical Support Test: A Drama in Three Acts
Ethereum continues to trade in a fragile structure, its price struggling to reclaim the key resistance zone between $2,250 and $2,350. After a brief recovery into this supply area earlier this month, ETH faced repeated rejections, triggering a steady decline back toward the $2,100 region. The chart now shows a market trapped between weakening bullish momentum and critical support levels that buyers must defend to avoid a deeper retrace. It is as if the market is a tightrope walker, teetering on the edge of a precipice, with the audience holding its breath.
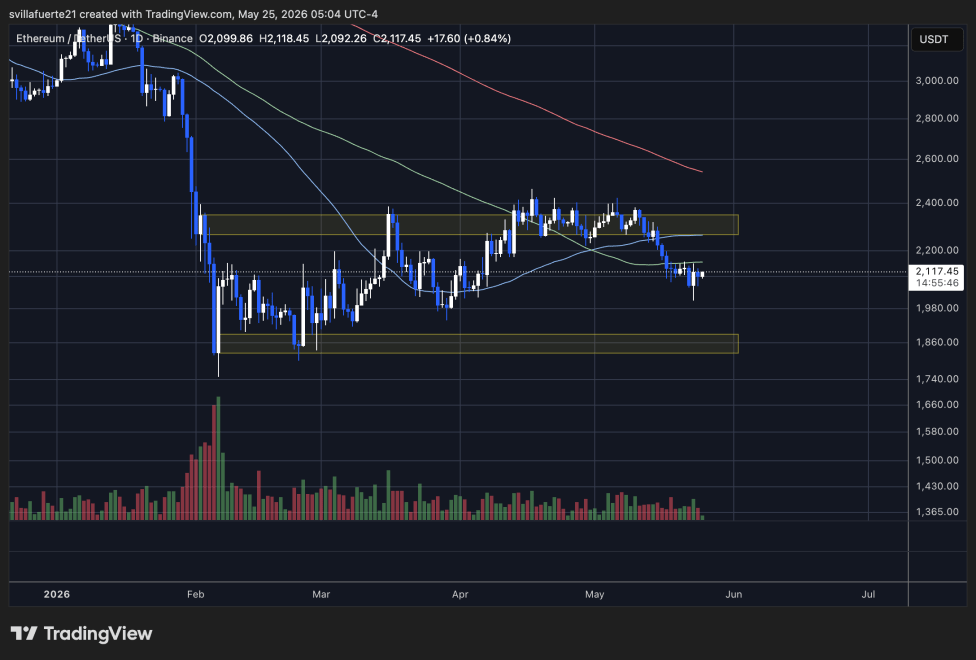
Technically, ETH is trading directly around the 50-day moving average, which has flattened after weeks of recovery. This level is acting as immediate short-term support, but the inability to establish acceptance above the 100-day moving average near $2,250 reflects continued weakness in broader market momentum. Meanwhile, the 200-day moving average remains far above current price action and continues sloping downward, confirming that Ethereum has not yet transitioned back into a confirmed macro bullish trend. It is as if the market is a clock, ticking inexorably toward an uncertain future.
The highlighted resistance zone around $2,300 has become structurally important. Every attempt to break above it has been absorbed by sellers, creating a sequence of lower highs that now pressures the market toward the lower support range between $1,820 and $1,880. Volume has also declined during the recent pullback, suggesting uncertainty rather than panic-driven capitulation. However, if ETH loses the $2,080-$2,100 region decisively, selling pressure could accelerate quickly toward the February demand zone. It is a game of musical chairs, and Ethereum is the last one standing, hoping for a seat.
Read More
- Forza Horizon 6: Find the Ohtani Treasure Chest Location
- NTE Drift Guide (& Best Car Mods for Drifting)
- Diablo 4 Best Loot Filter Codes
- Boruto: Ikemoto Has Already Hinted At Sasuke’s New Eye After Return
- LEGO Batman Legacy of the Dark Knight Batcave Minikits & WayneTech Caches
- USD RUB PREDICTION
- Where to Find Prescription in Where Winds Meet (Raw Leaf Porridge Quest)
- Top 10 Must-Watch Isekai Anime on Crunchyroll Revealed!
- Deltarune Chapter 1 100% Walkthrough: Complete Guide to Secrets and Bosses
- GBP CNY PREDICTION
2026-05-25 16:47