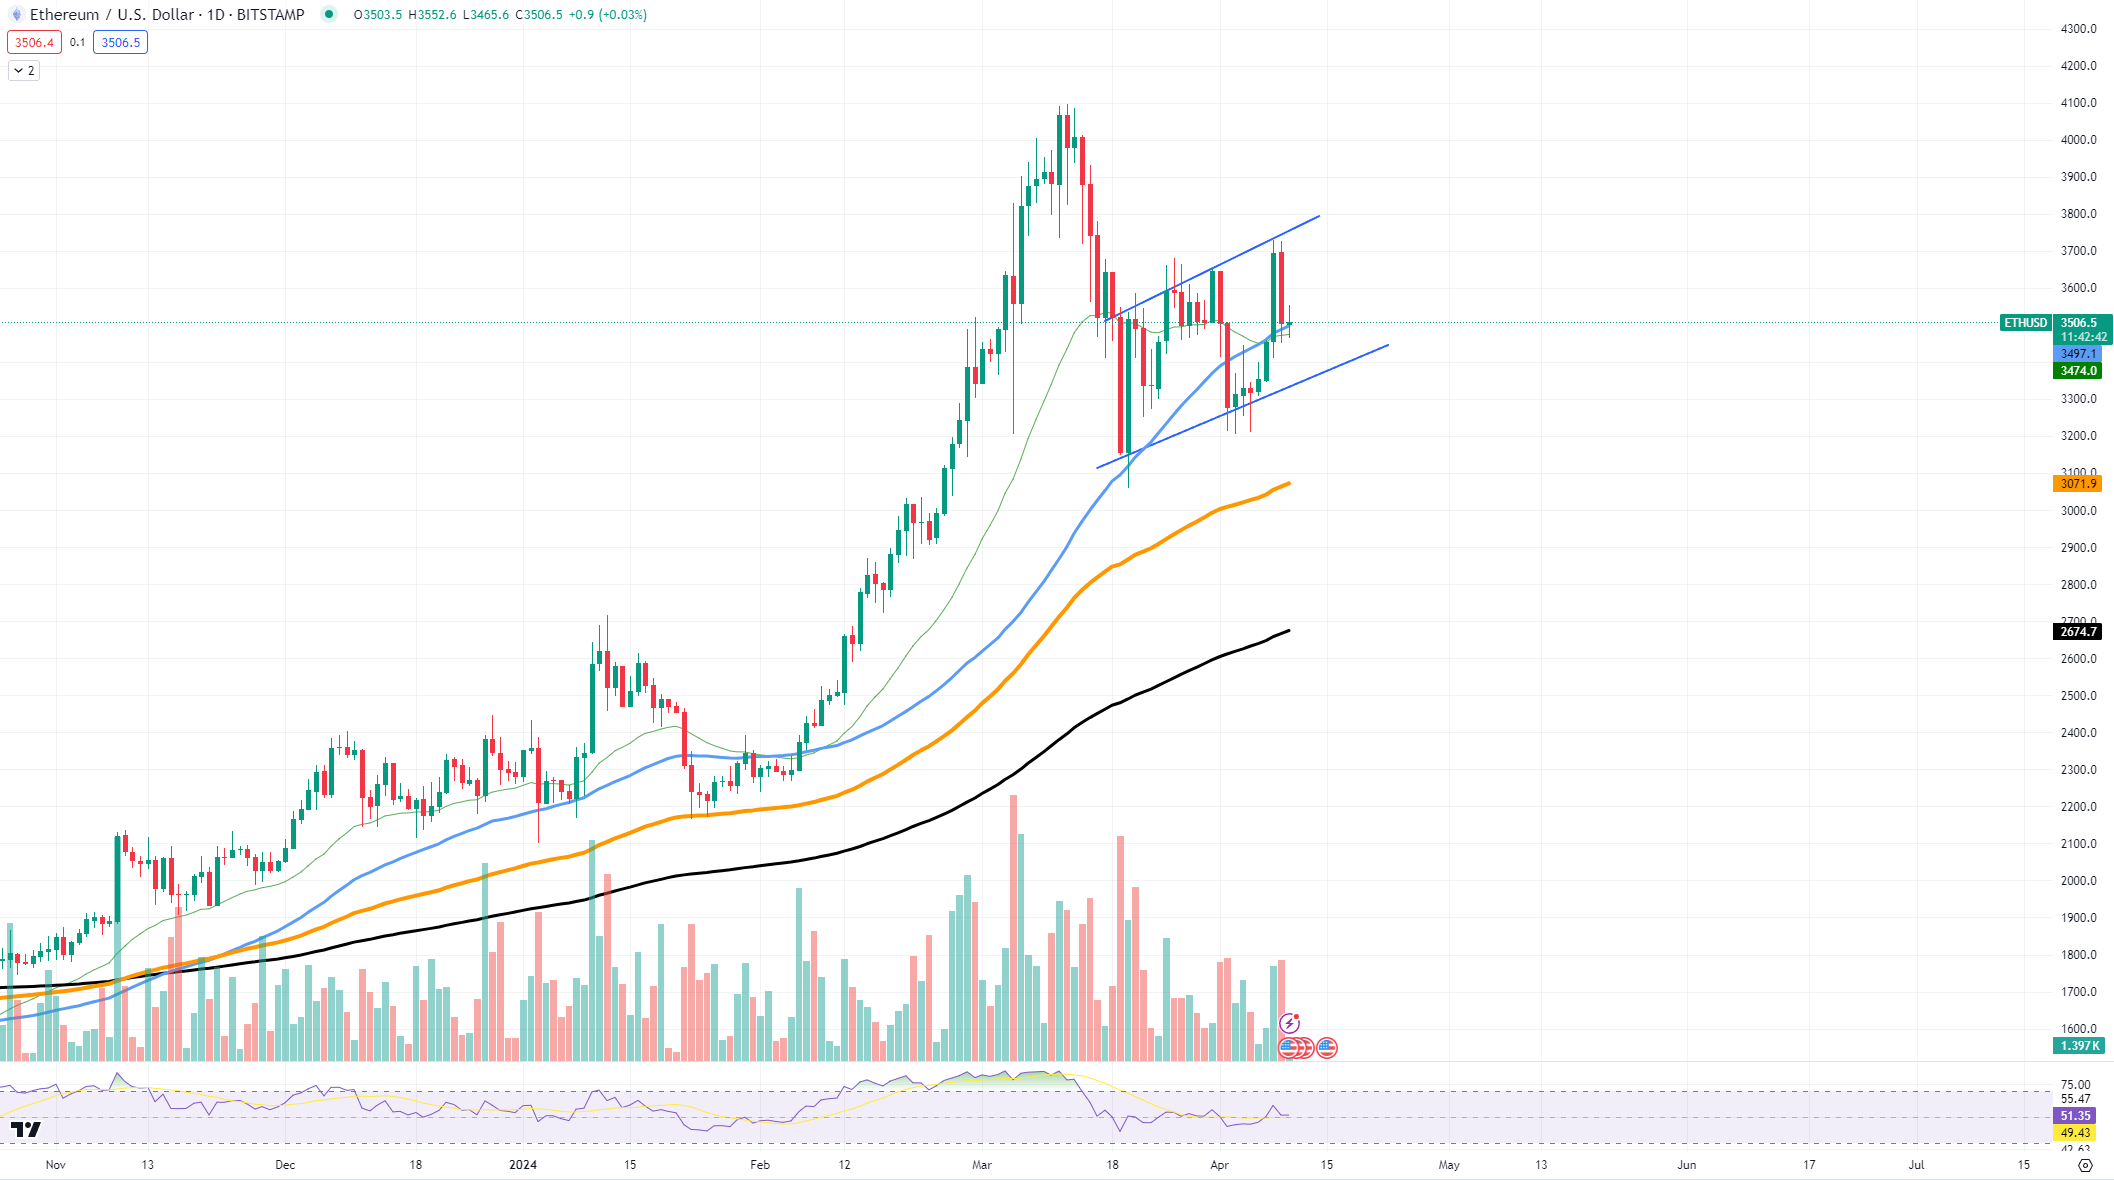
At the moment, Ethereum seems to be forming an uptrend pattern, which might indicate a gradual increase in price approaching $4,000.
An ascending channel on a chart can be identified by two lines that slope upwards and run parallel to each other. This pattern represents the price movements between successive higher highs and higher lows, conveying an uptrend that advances steadily yet consistently.
In simpler terms, the bottom line of Ethereum’s price channel acts as a support, helping the price rebound after a dip, while the top line marks the peak before a slight pullback occurs.

An important level to keep an eye on is the $3,500 mark where Ethereum has met resistance recently. If Ethereum manages to break through this barrier, it could lead to challenges of higher resistances and eventually reaching towards the upper limit of the channel around $4,000. At present, Ethereum is trading close to $3,500, which coincides with the midpoint of the channel – a critical point for bulls to protect.
From a supportive perspective, the $3,072 level is significant as the lowest point in the channel. The market outlook stays positive as long as the price stays within this range. However, if the price drops below it, there might be a reason to reconsider the bullish perspective.
Moving forward, Ethereum aims to continue its upward trajectory within the current rising trendline. Should it surpass this level, the bullish forces may gain more ground, potentially causing a substantial price increase. Conversely, if Ethereum fails to hold above the trendline, market sentiment could shift negatively.
Shiba Inu‘s positive dynamic
Shiba Inu could experience a big price swing as it approaches the peak of its current price range. This range forms when the asset’s price bounces between rising support and falling resistance lines, indicating that a notable price shift – be it an upward surge or a downward drop – is imminent.
As the peak of the pattern approaches, indicative of a major shift upcoming. However, beware of symmetrical triangles’ notoriety for their unclear directions. The ensuing breakout may result in a significant price increase if it heads upward or a decrease if it collapses.
At present, SHIB is confined to a narrow price range, and its crucial point of interest is the triangle’s peak, approximately at $0.00002776. If SHIB manages to sustainably surpass this threshold, it could trigger an uptrend, with potential resistance emerging around $0.00002987. Alternatively, if SHIB falls beneath the triangle’s lower support at $0.00002515, it might lead to a decline, and the next substantial support may be found around $0.00002236.
The outlook for SHIB inside this symmetric triangle is uncertain, as is the token’s potential direction and future. If the market continues to be bullish, SHIB could use this pattern to push through with a strong upward trend.
Cardano on reversal point
Based on Cardano‘s technical signals, there are indications of an imminent price change. Reaching this significant price mark in the asset’s history has previously initiated bullish trends.
The current price of ADA is approximately $0.57, which has been a noteworthy level in the past, serving as a turning point. In earlier trading periods, this price acted as a robust foundation, suggesting the possibility of a price rebound. To secure a meaningful reversal, ADA must surmount the resistance at $0.62. If this barrier is breached, ADA could potentially surge towards the subsequent resistance at $0.65.
If the price of ADA falls below its current support level, the next likely floor is around $0.5266. At this point, buyers might return to push up the price again. This area is important for bulls as they try to keep the price from dropping more, which could negatively impact ADA‘s short-term prospects.
If Cardano bounces back strongly from its current support level, this could be a sign that it is prepared to rise again. With higher trading volume and optimistic investor feelings, Cardano could push ADA upwards once more, allowing it to challenge previous highs and possibly set new records.
Read More
- LUNC PREDICTION. LUNC cryptocurrency
- BTC PREDICTION. BTC cryptocurrency
- SOL PREDICTION. SOL cryptocurrency
- USD COP PREDICTION
- BICO PREDICTION. BICO cryptocurrency
- USD ZAR PREDICTION
- VANRY PREDICTION. VANRY cryptocurrency
- USD PHP PREDICTION
- USD CLP PREDICTION
- WQT PREDICTION. WQT cryptocurrency
2024-04-11 03:40