Ethereum’s price is currently around $2,130, showing a 3.6% increase today and an 8.2% rise over the last month. Recent price gains have attracted large investors, and many are betting on further increases. However, looking at shorter-term price movements, a pattern is emerging that suggests these gains could be reversed, and potentially lead to further losses.
There’s a clear conflict right now: while many large Ethereum investors and traders are optimistic, the technical indicators suggest a possible 17% price decrease. The market is at a tipping point, and whether prices go up or down will likely depend on a key support level currently around the current price.
Whales and Derivatives Positioning Lean Heavily Bullish
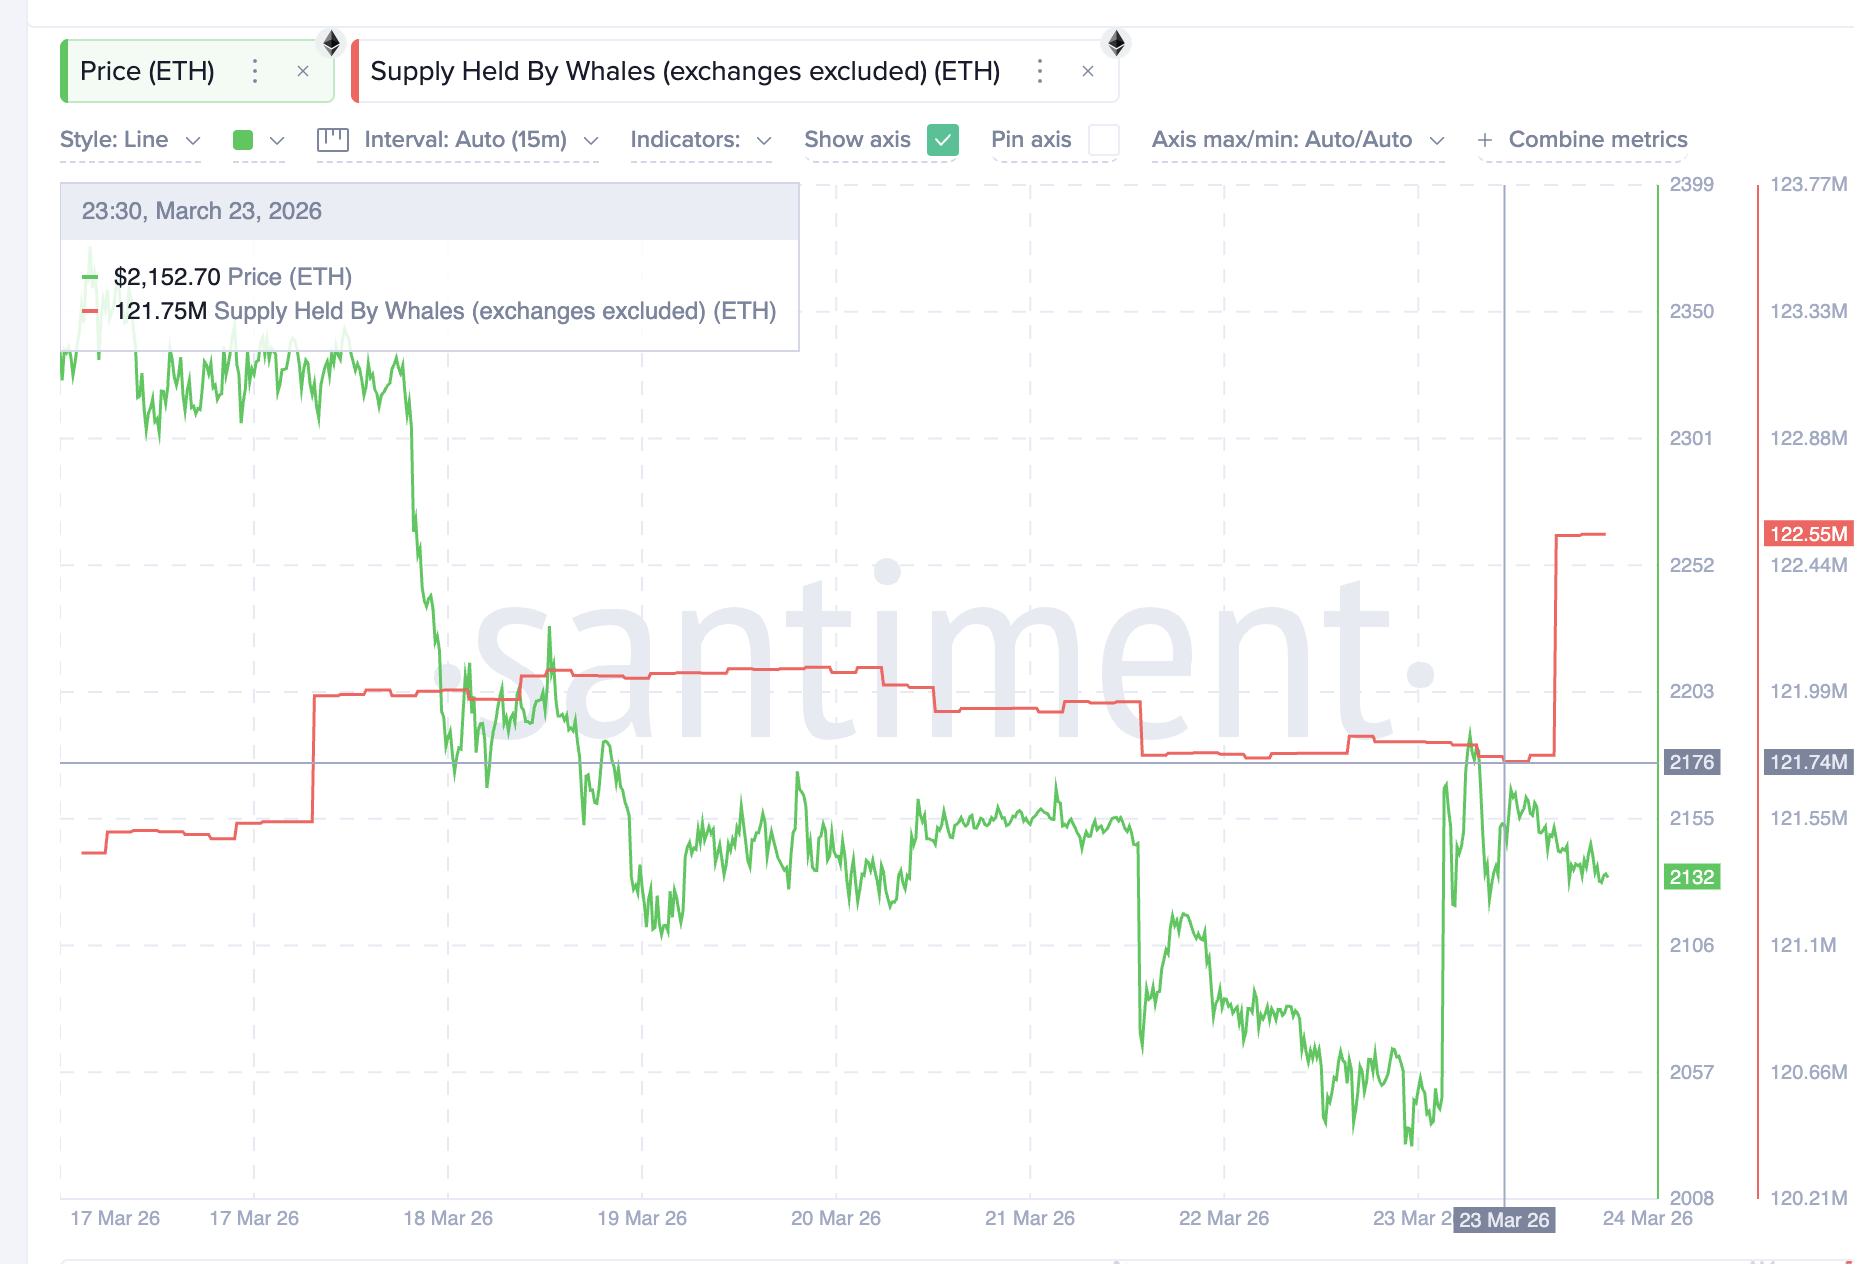
Large Ethereum holders, known as whales, have been making significant moves. Data from Santiment shows they increased their combined holdings by around 810,000 ETH in just 24 hours, from March 23rd. This adds up to roughly $1.7 billion worth of Ethereum at today’s prices. This accumulation happened at the same time the price of Ethereum started to rise, indicating these whales likely bought when the price showed signs of increasing.
Interested in getting more crypto insights? Subscribe to Editor Harsh Notariya’s Daily Crypto Newsletter here.
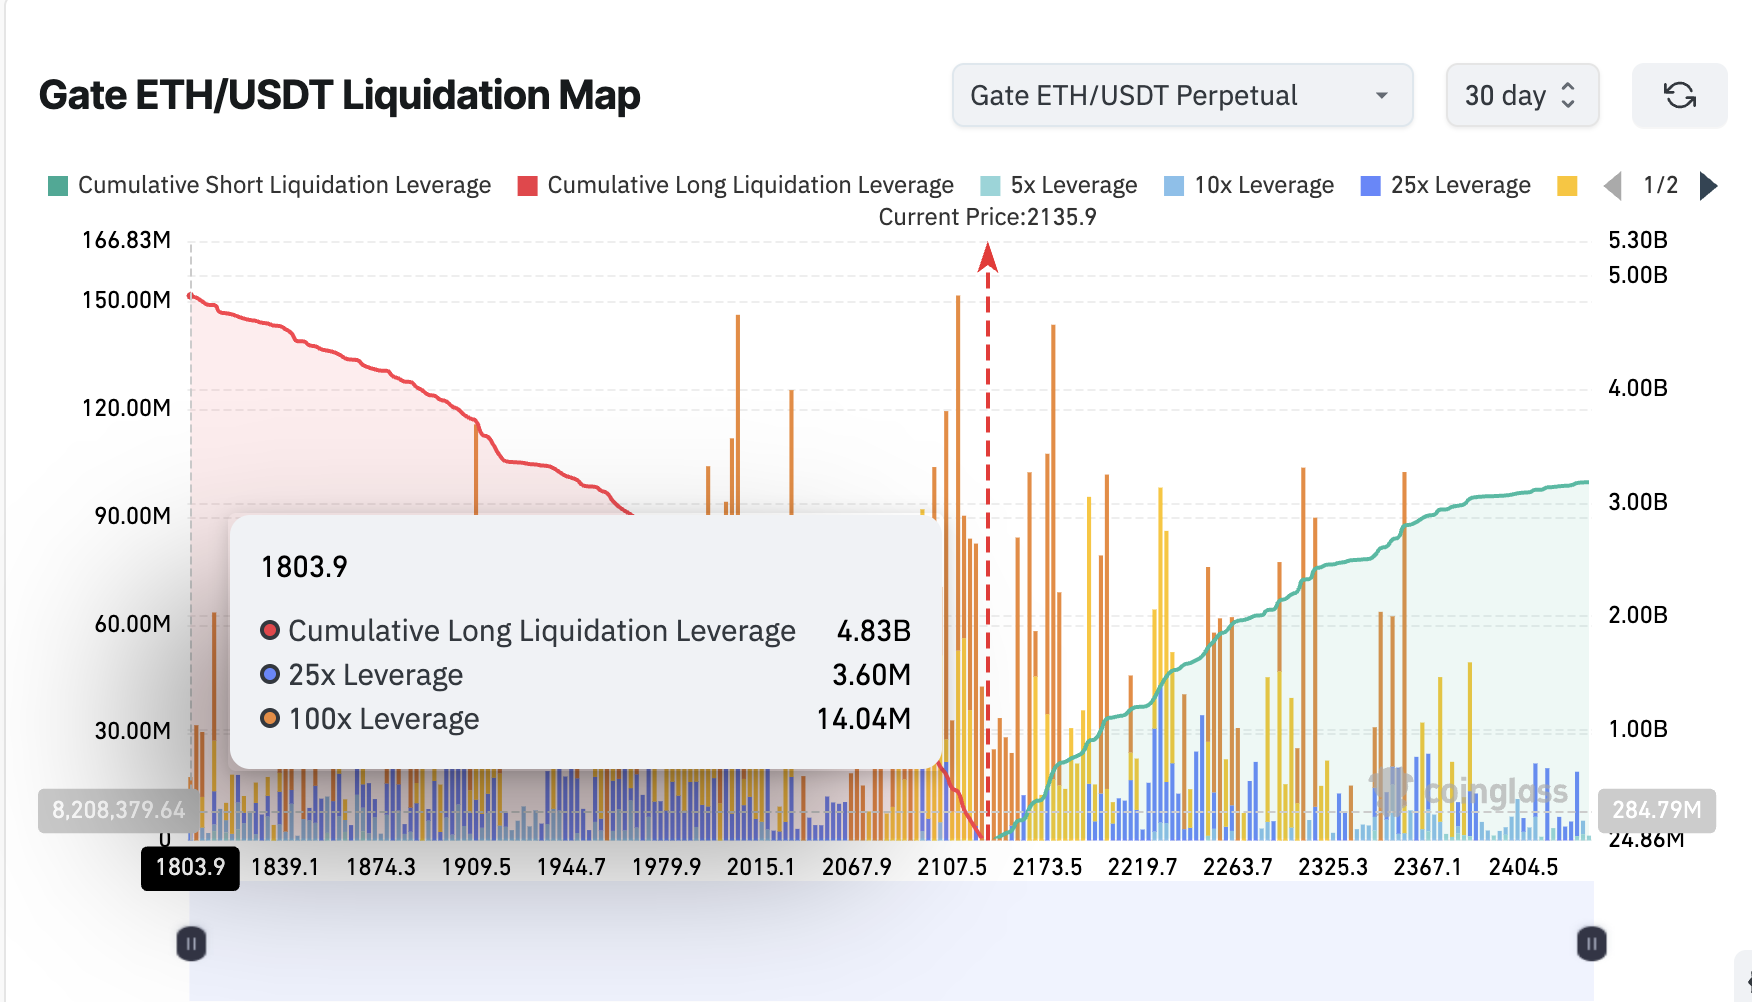
Current trading activity suggests strong confidence that the price of Ethereum will rise. Over the last month, traders have placed significantly more bets that the price will go up (long positions worth $4.83 billion) than bets that it will fall (short positions worth $3.18 billion). Long positions are about 52% larger, indicating a strong bias towards a price increase.
If large investors, often called ‘whales,’ are simultaneously buying both immediate contracts (spot) and future contracts (derivatives) with a bullish outlook, it generally signals they’re confident prices will rise soon. However, this confidence isn’t more important than the overall price pattern. The current pattern on the 8-hour chart is something those optimistic about price increases definitely need to pay attention to.
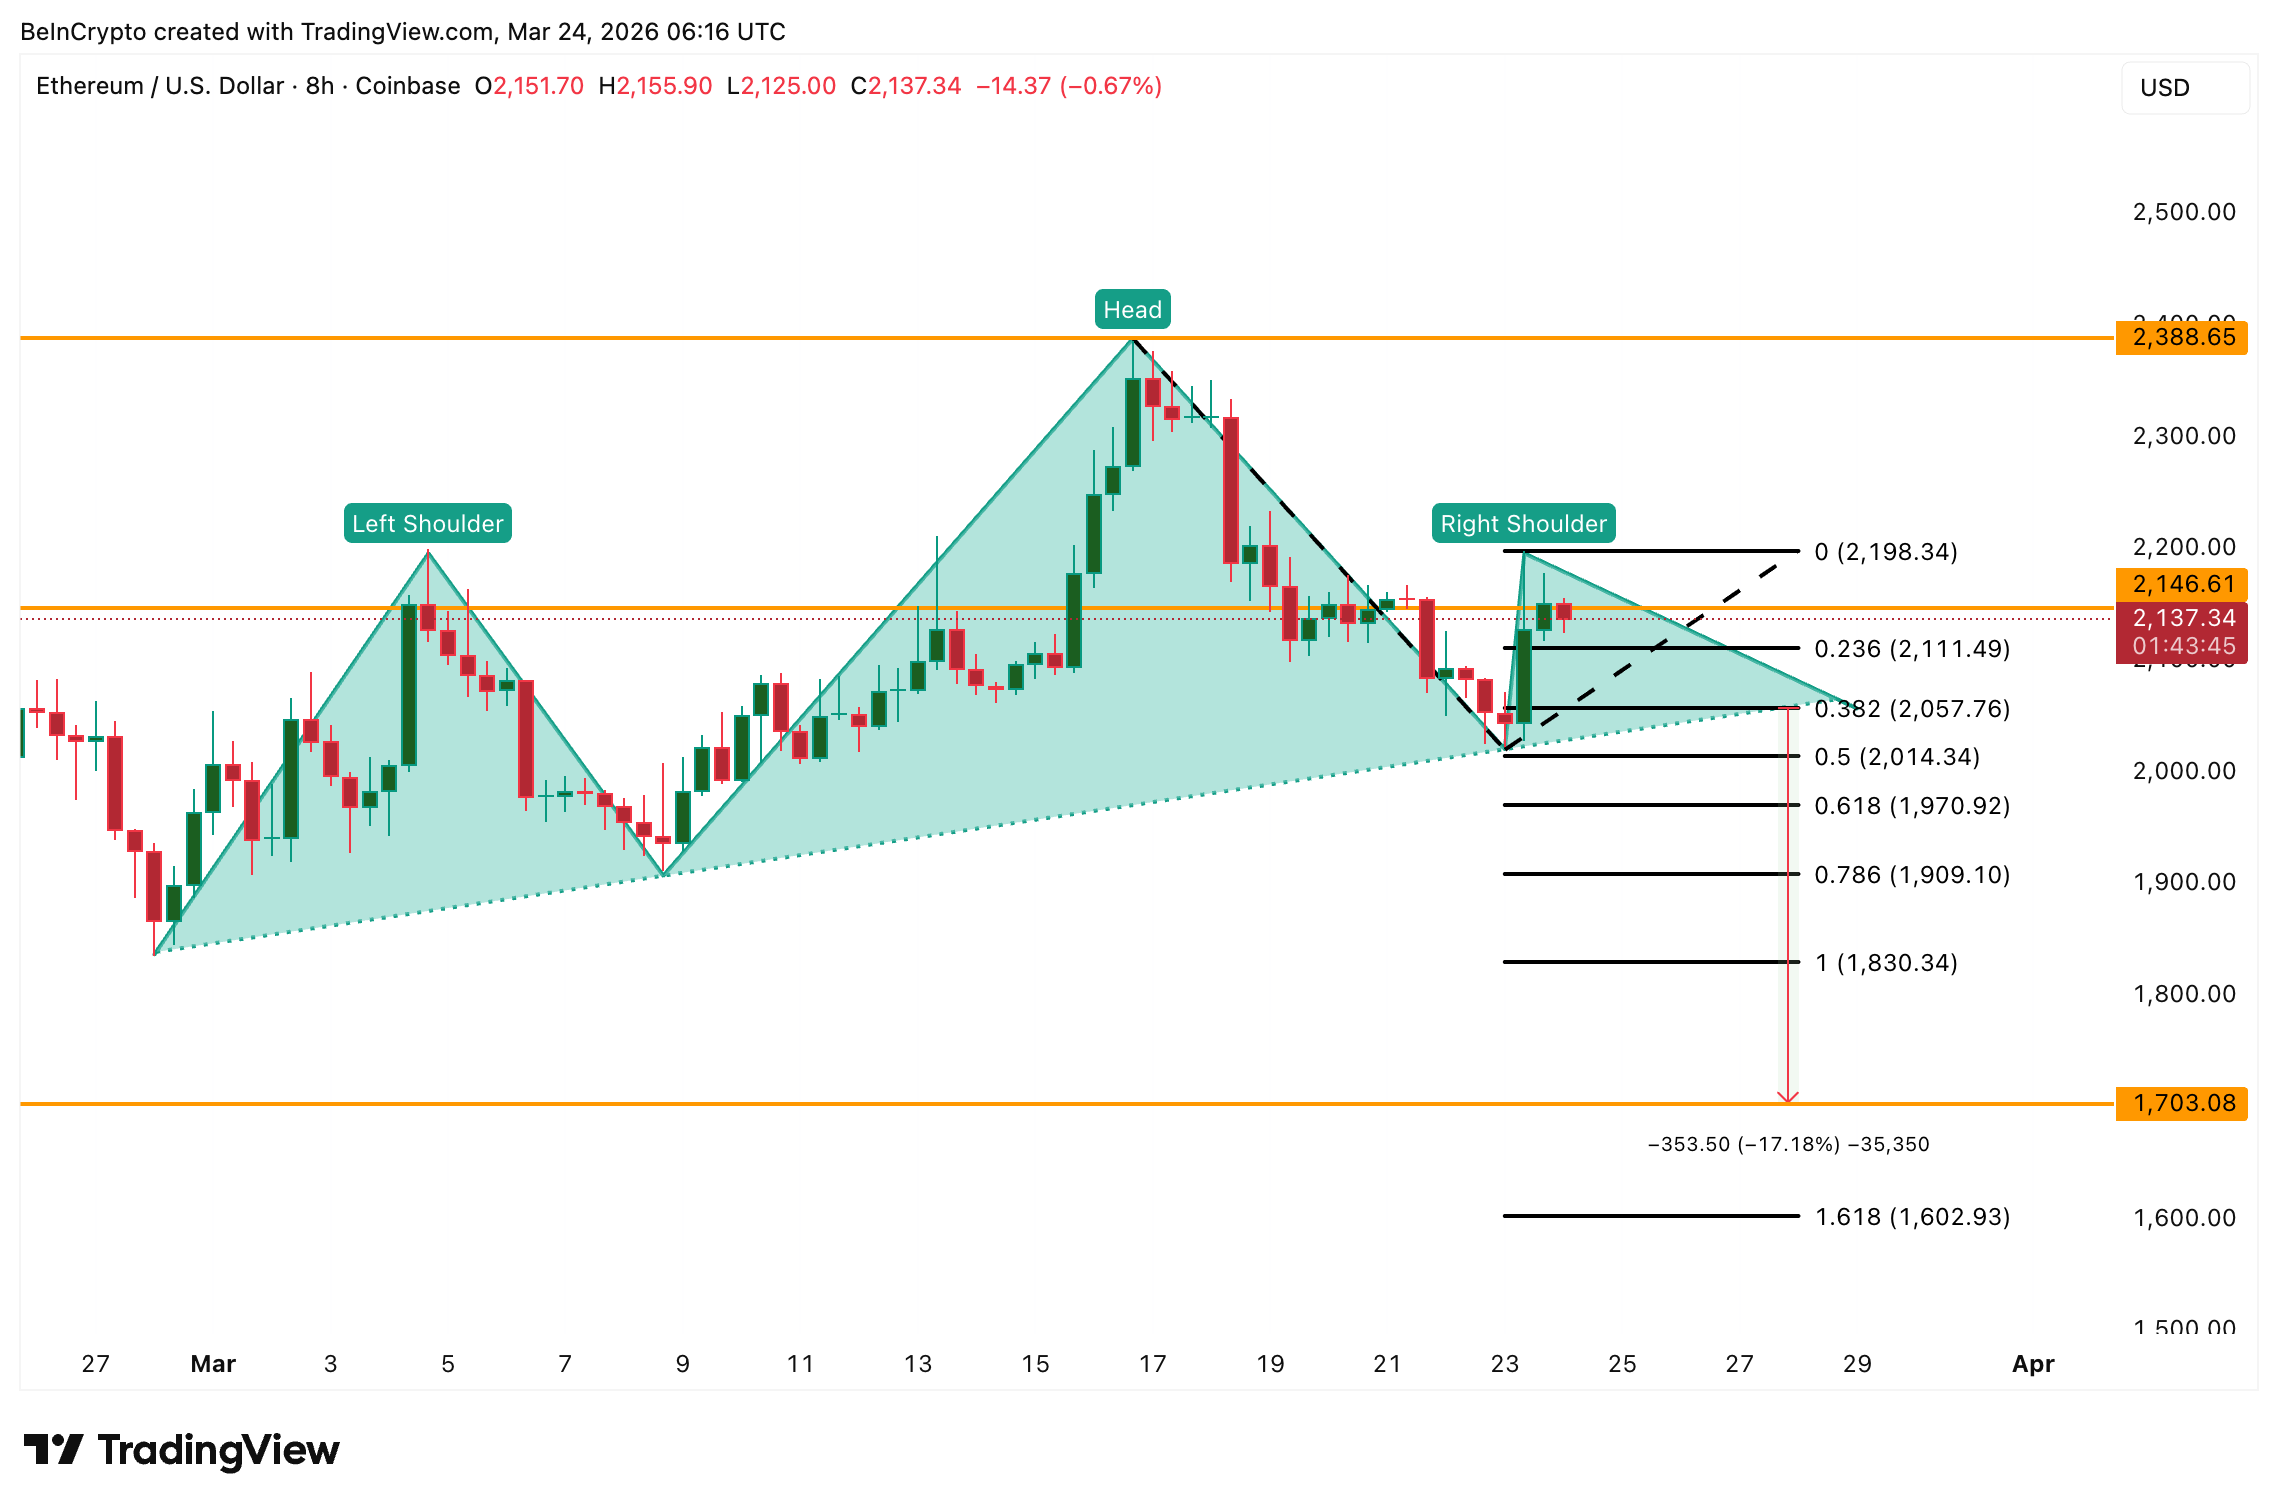
The 8-Hour Chart Builds a Pattern the Bulls May Be Missing
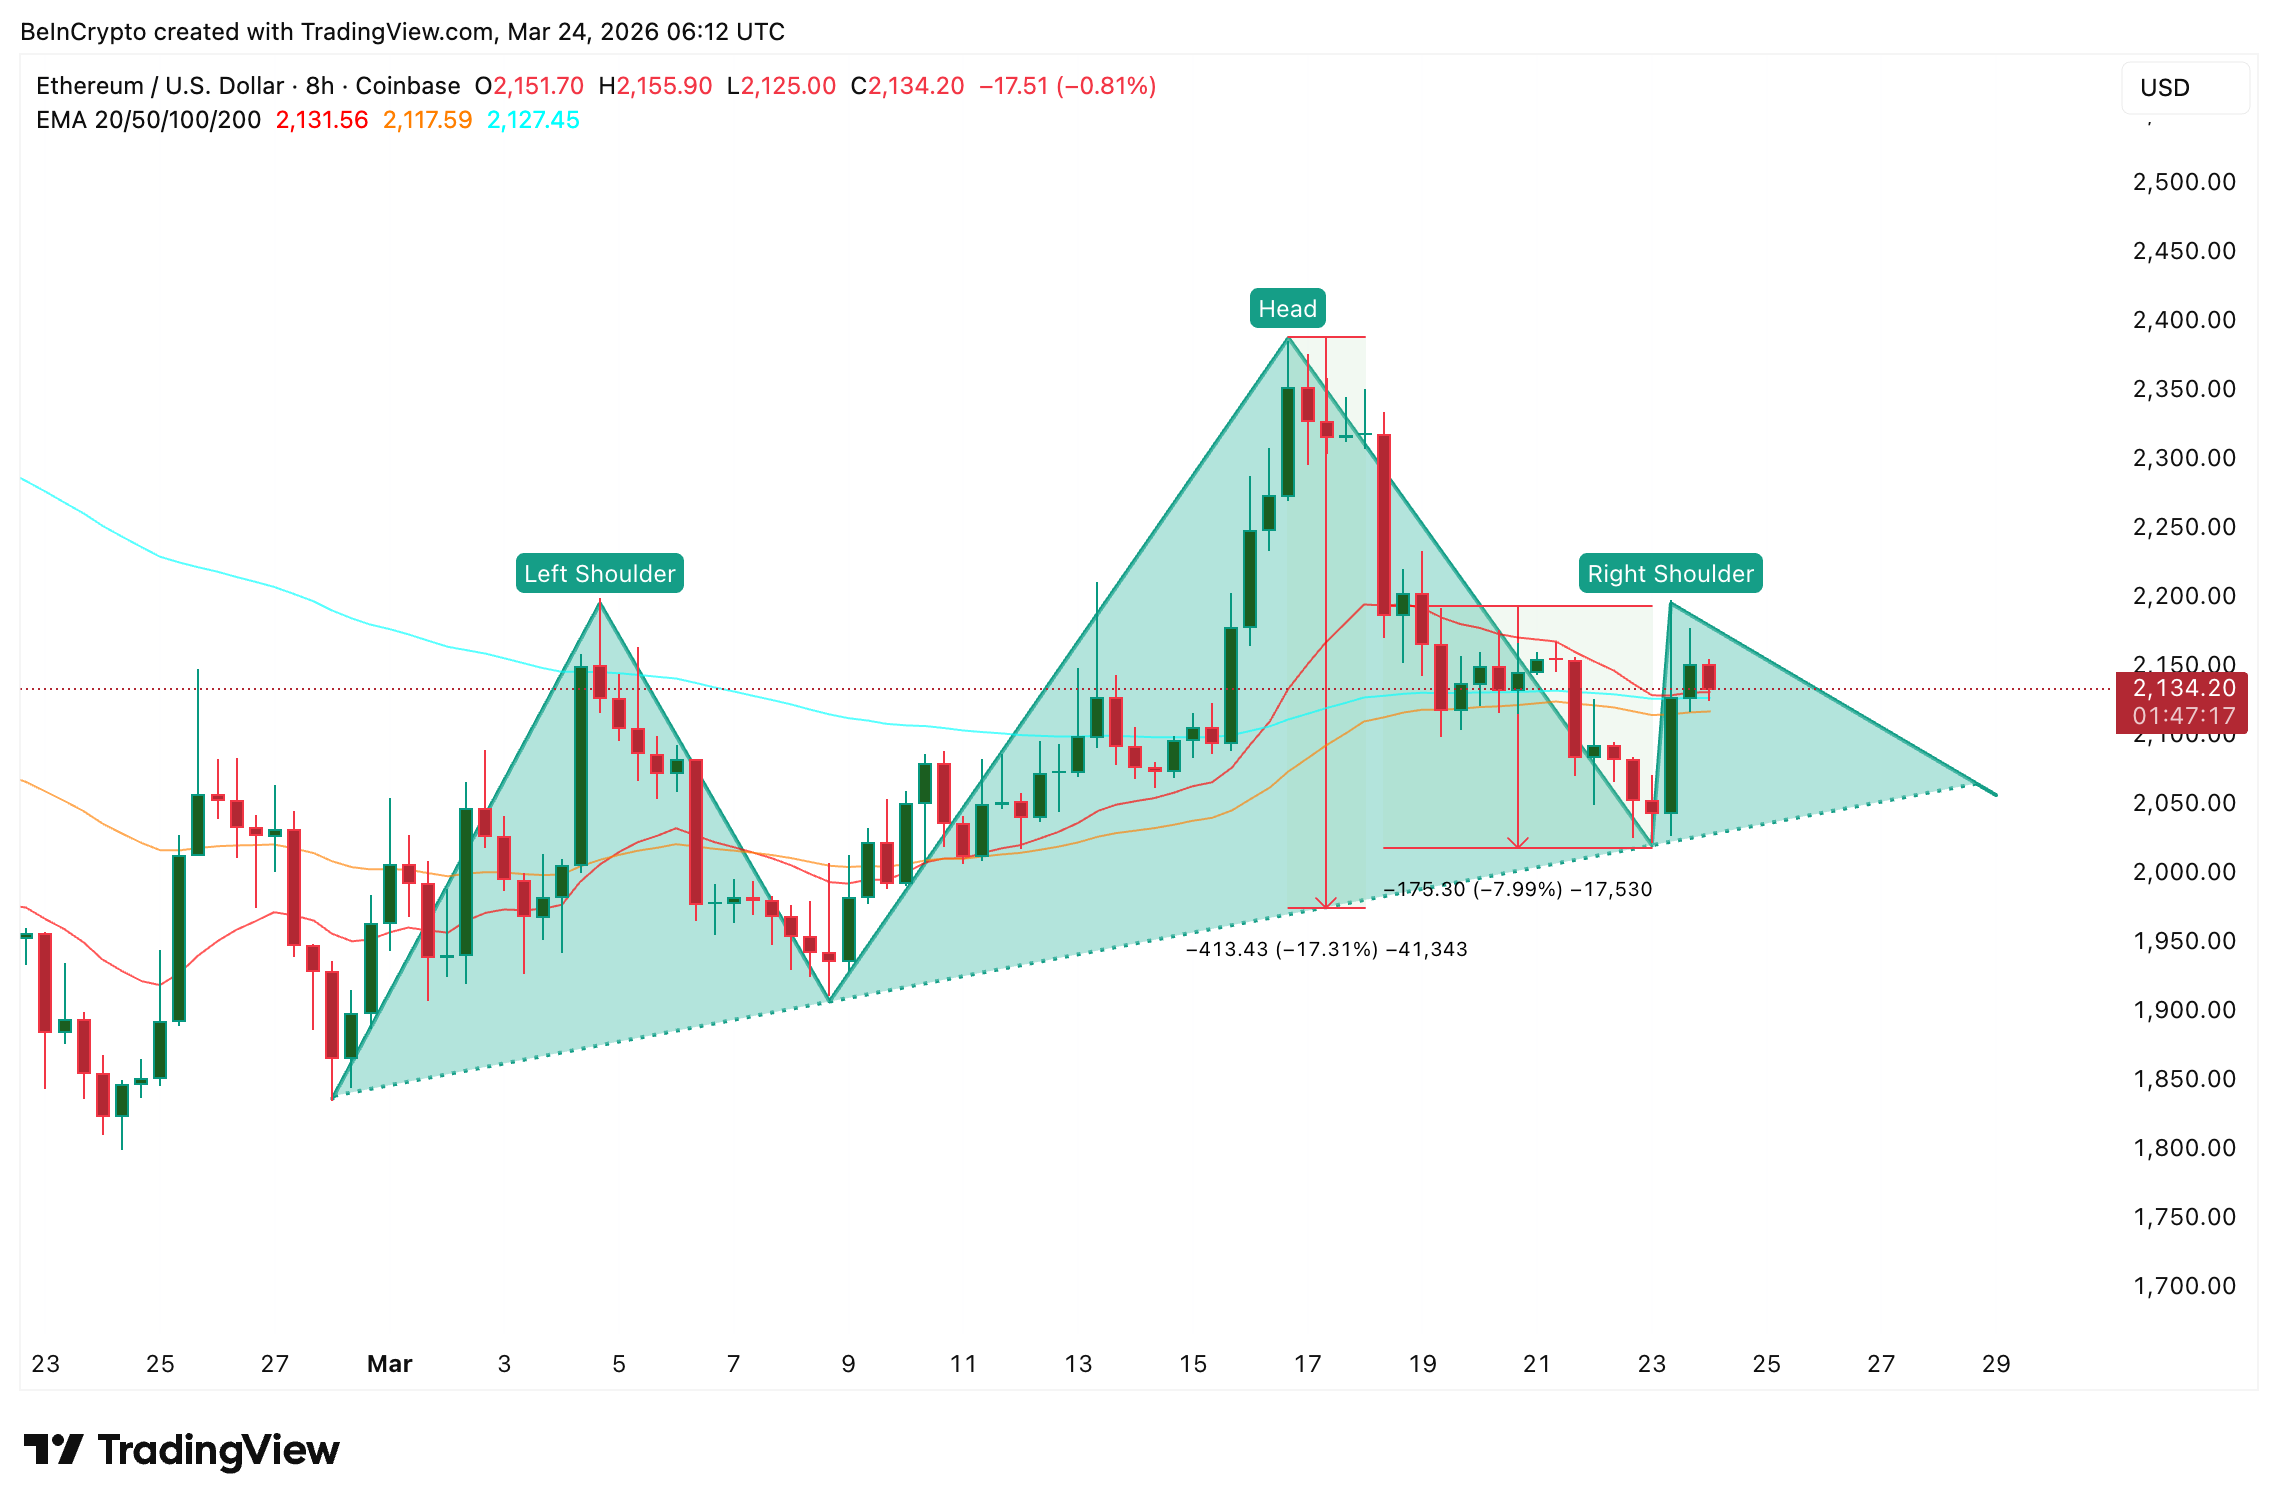
Looking at the 8-hour chart, a head and shoulders pattern is developing, suggesting a potential 17% price decrease. The upward-sloping neckline indicates continued buying interest, possibly from large investors building positions. However, if this buying support breaks down, the price could fall quickly, as the market loses the foundation it was depending on.
Ethereum’s price is currently facing increased risk because it’s right at a key technical level. Several important moving averages – the 20, 50, and 100-period Exponential Moving Averages (EMAs) – are all clustered between $2,110 and $2,130. When these averages converge, price movements tend to happen quickly in one direction. For example, when ETH fell below the 20-period EMA on March 18th, the price dropped about 8%.
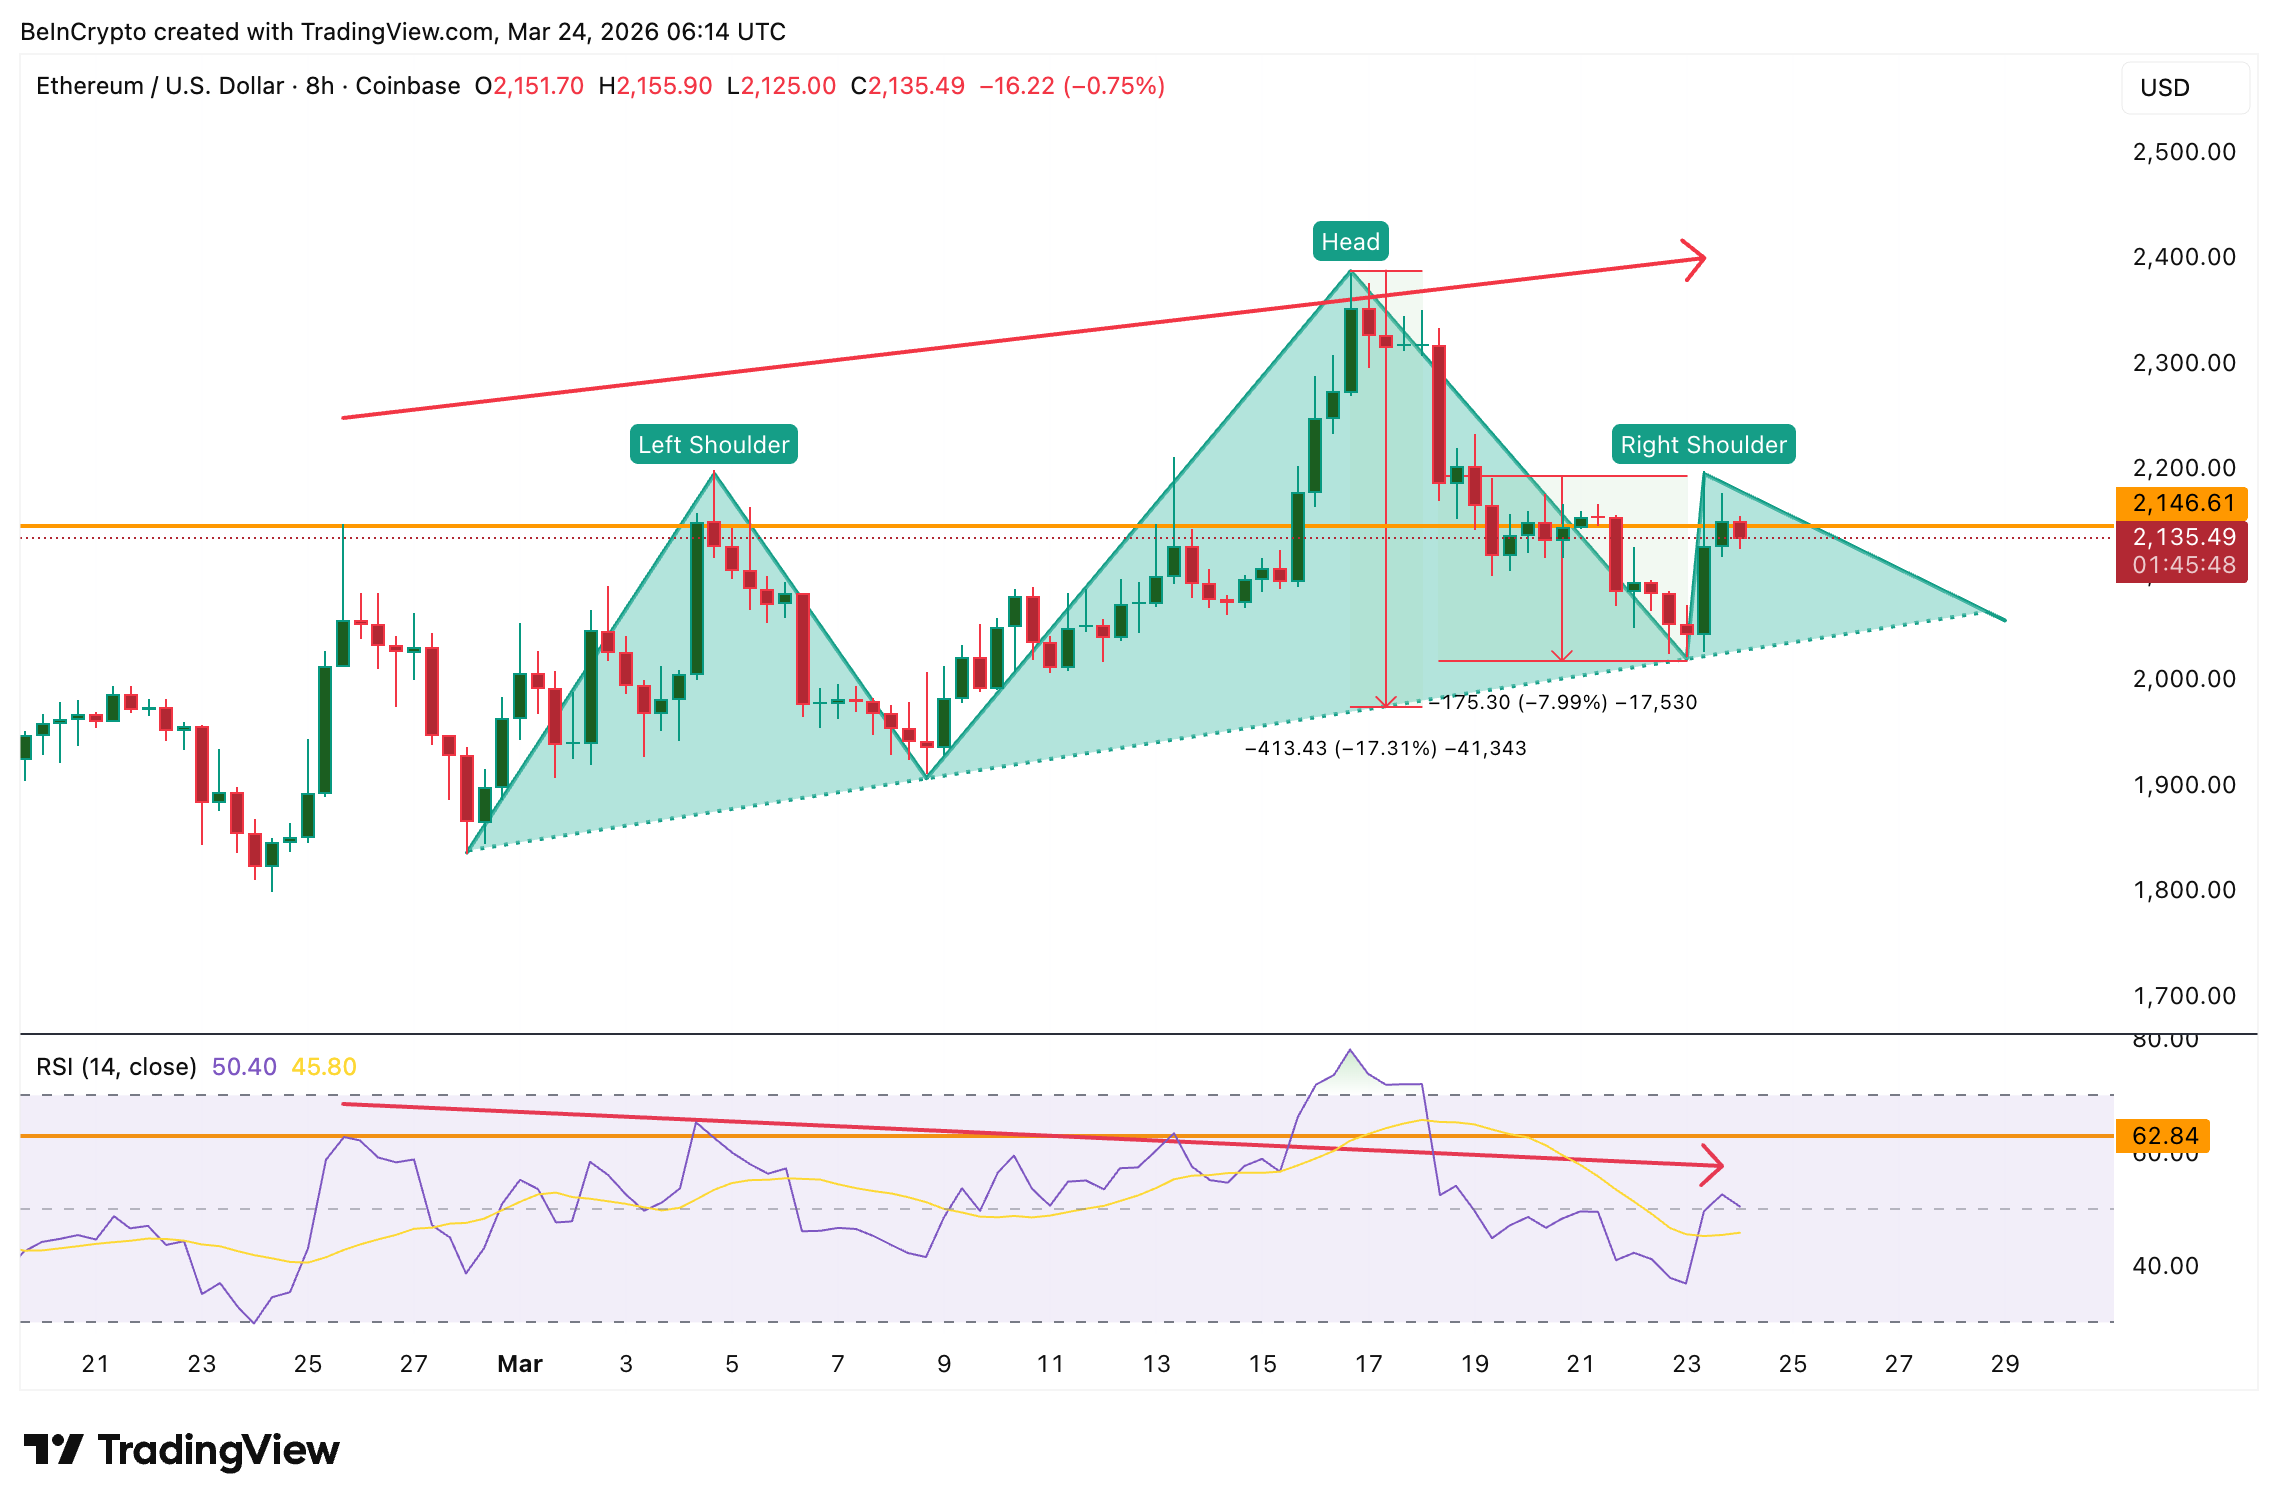
The risk is increased by a bearish divergence signal. Between February 25th and March 23rd, the price of Ether (ETH) went up to a new high, but the Relative Strength Index (RSI) – which measures how quickly prices are changing – actually went down. This typically means that even though the price is still rising, the strength of that upward movement is fading.
Several warning signs – a head and shoulders pattern, a concerning EMA crossover, and a bearish divergence in the RSI – suggest the recent positive outlook from whales and derivatives traders might be wrong. Ultimately, how the price behaves will tell us which viewpoint is correct.
Ethereum Price Sits Right On The Crash Site
Currently, the key price level to watch is $2,110, which coincides with a group of important moving averages. If the price falls below this level and stays there for eight hours, it could signal further price drops, potentially down to $2,050.
The price level of $2,050 is important because it coincides with a key Fibonacci retracement level and a significant chart pattern called a head and shoulders. If the price closes below $2,050 on an 8-hour chart, a potential downward move could begin. Based on this pattern, the price could fall around 17%, aiming for approximately $1,700. It might find some support around $1,970 and $1,830 during this decline, but the price could potentially drop as low as $1,600 in a worst-case scenario.
If the price of Ethereum (ETH) falls below $2,050, it could start a wave of forced selling. Currently, there’s $4.83 billion worth of leveraged bets that ETH will go up, and a price drop could force those making those bets to sell, which would drive the price down further. Essentially, the optimism currently supporting the price could become the reason for a price decline if this pattern holds true.
Ethereum needs to close above $2,190 on an 8-hour chart, and then break past $2,380, to avoid a potential price drop. Right now, the price is hovering around a key support level. If it holds, it suggests continued optimism from large investors; if it falls, a 17% price correction could occur, forming a ‘head and shoulders’ pattern.
Read More
- All Shadow Armor Locations in Crimson Desert
- Sega Reveals Official Sonic Timeline: From Prehistoric to Modern Era
- Genshin Impact Dev Teases New Open-World MMO With Realistic Graphics
- The Limits of Thought: Can We Compress Reasoning in AI?
- Where to Pack and Sell Trade Goods in Crimson Desert
- Dark Marksman Armor Locations in Crimson Desert
- How to Beat Antumbra’s Sword (Sanctum of Absolution) in Crimson Desert
- ARC Raiders Boss Defends Controversial AI Usage
- Who Can You Romance In GreedFall 2: The Dying World?
- Enshrouded: Giant Critter Scales Location
2026-03-24 21:27