Ah, the Pi Network (PI), that enigmatic little cryptocurrency that seems to be on a rollercoaster ride of emotions! It’s down nearly 6% over the past week, which is about as comforting as a wet sock. The technical indicators are sending mixed signals, like a confused traffic light. The DMI is hinting at a fading bearish momentum, while the CMF is waving a tiny flag of positive buying pressure. 🎢
Meanwhile, the EMA lines are suggesting a cozy little consolidation, with PI precariously perched just above a critical support level at $0.601. Will it break down like a cheap car or rebound like a bouncy ball? Only time will tell, but it’s going to be a nail-biter! 🥴
Pi Network DMI Signals Fading Bearish Momentum
Now, let’s talk about the Directional Movement Index (DMI). It’s like the weather forecast for trends, and right now, it’s showing a drop in the Average Directional Index (ADX) to 34, down from a rather alarming 44.59 just a day ago. Talk about a mood swing! 😱
This decline follows a sharp rise from 16.89 three days ago, suggesting a trend that’s now losing steam faster than a deflating balloon. The ADX measures the strength of a trend, regardless of direction, and right now, it’s still above 30, which means Pi is in a trending phase, albeit a cooling one. 🥶
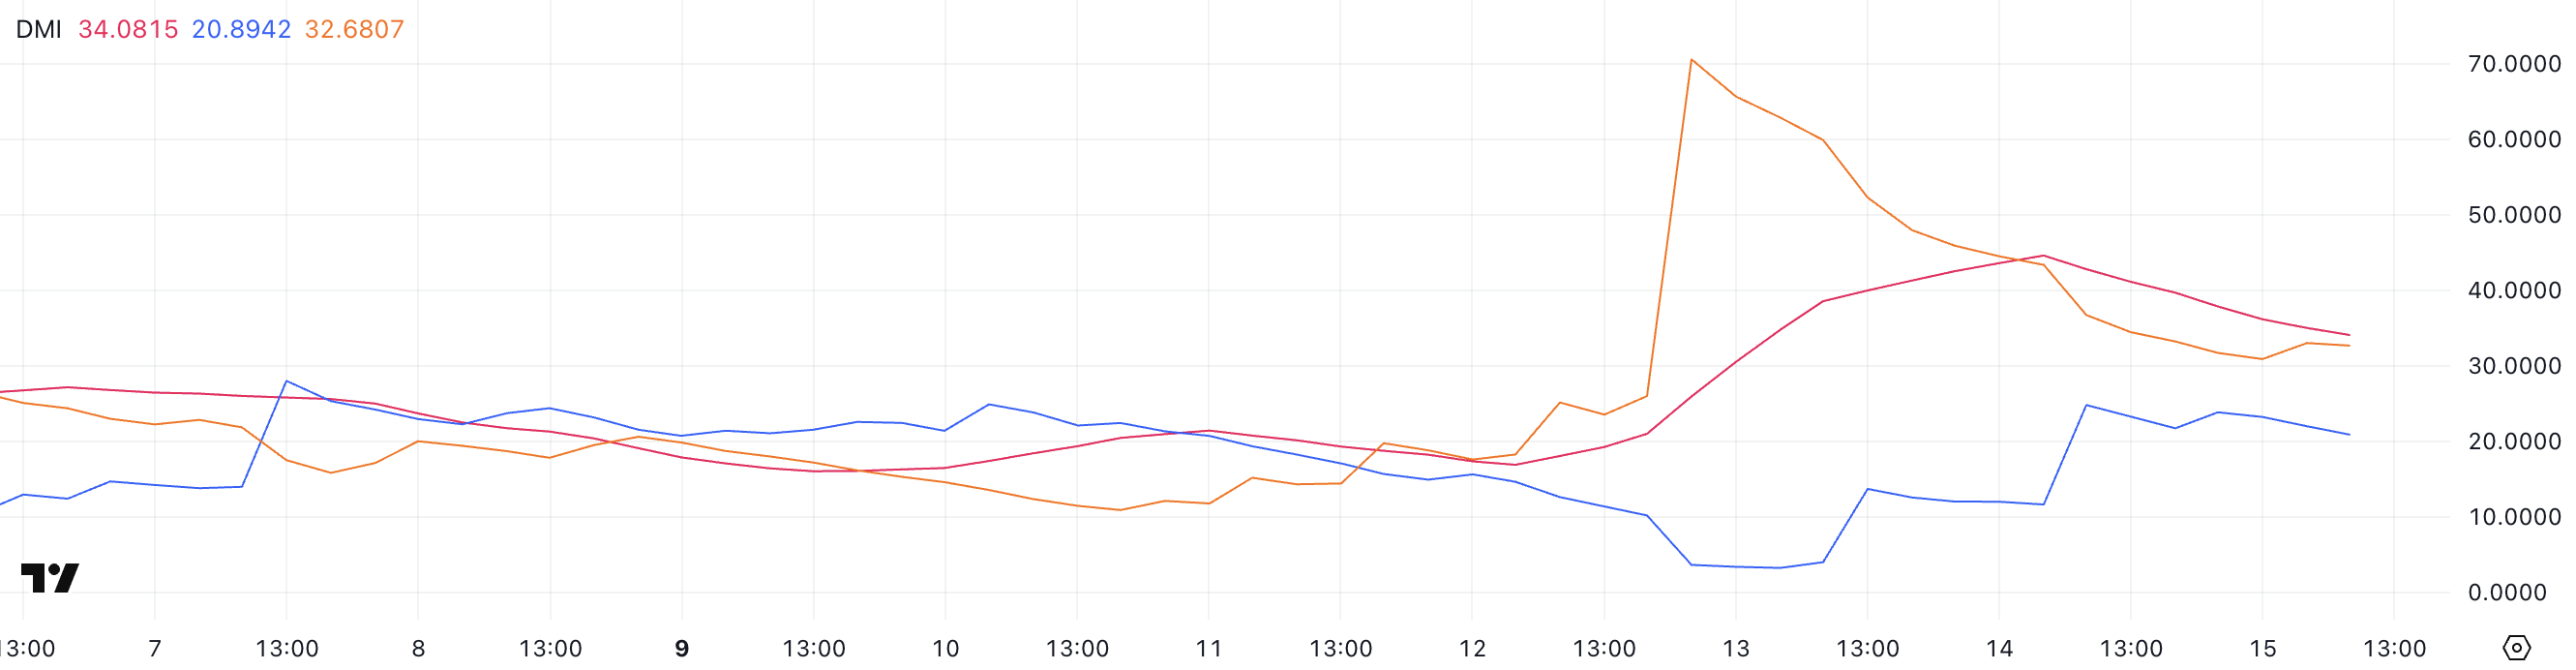
Looking at the directional indicators, +DI has climbed to 20.89 from a mere 4 two days ago, signaling that bullish pressure is trying to make a comeback. Meanwhile, -DI has plummeted to 32.68 after peaking at 70.57 three days ago, indicating that bearish momentum is fading faster than my will to exercise. 🏃♂️💨
This crossover in directional strength could hint at a potential shift in sentiment. If +DI keeps rising while -DI declines, Pi’s price might just start recovering or at least enter a more neutral phase after a period of intense selling. Fingers crossed! 🤞
PI CMF Shows Light Buying Pressure After Recent Spike
Now, let’s check in on the Chaikin Money Flow (CMF), which is currently at 0.07. That’s down from 0.19 two days ago but still higher than -0.05 three days ago. It’s like watching a soap opera where the characters just can’t make up their minds! 📺
The CMF measures the flow of money into or out of an asset over time, using price and volume data. Values above 0 suggest buying pressure, while values below 0 indicate selling pressure. So, if you’re keeping score, we’re still in the positive, but just barely. 🥳

PI’s current CMF level at 0.07 suggests mild but positive buying pressure. While it’s not strong enough to confirm aggressive accumulation, it shows that capital is still trickling into the asset, albeit less intensely than two days ago. If CMF can hold above zero, we might see a stabilization or gradual recovery in price. But if it dips back below zero, well, that could spell trouble. 🚨
Breakout or Breakdown? PI Trades Near Crucial Levels
As for the EMA lines, they’re currently suggesting a period of consolidation, following a recovery from the sharp drop triggered by the Israel-Iran conflict escalation. Price action is hovering just above a key support at $0.601. If this level is broken, PI could drop to $0.542, and if bearish momentum builds, it might plummet further toward $0.40. Yikes! 😬
This structure reflects uncertainty, with no clear bullish or bearish control at the moment. It’s like watching a game of tug-of-war where neither side is winning. 🏋️♂️

On the upside, if PI manages to break through the resistance levels at $0.647 and $0.658, it could trigger a new uptrend. A successful breakout above these zones might open the door for a move toward $0.796. But for now, the EMA setup supports a neutral stance, just waiting for a decisive move in either direction. It’s like being stuck in traffic, just waiting for the light to change! 🚦
Read More
- All Shadow Armor Locations in Crimson Desert
- Dark Marksman Armor Locations in Crimson Desert
- Jujutsu Kaisen Season 3 Episode 12 Release Date
- Keeping AI Agents on Track: A New Approach to Reliable Action
- How to Beat Antumbra’s Sword (Sanctum of Absolution) in Crimson Desert
- Top 5 Militaristic Civs in Civilization 7
- Sega Reveals Official Sonic Timeline: From Prehistoric to Modern Era
- How to Get the Sunset Reed Armor Set and Hollow Visage Sword in Crimson Desert
- Sakuga: The Hidden Art Driving Anime’s Stunning Visual Revolution!
- How To Beat Ator Archon of Antumbra In Crimson Desert
2025-06-16 04:51