PEPE, the meme coin that’s been making waves, has seen a 3.5% climb in the past 24 hours, trading at $0.00001110 at press time, according to CoinMarketCap data. But don’t get too excited, folks! 😜
This bullish sentiment is overshadowed by larger bearish signals looming over the asset, as a whale’s recent massive CEX deposit hints at potential downside, coupled with a more than 40% drop in the trading volume. 🐳💰
Bull Flag or Bear Trap?
On the daily chart, PEPE has been trading inside a descending channel since May 10. This setup eventually led to a bull flag, a continuation pattern that often follows a strong upward move.
In PEPE’s case, the price spiked from $0.0000079 to $0.000015 before consolidating within the flag between $0.000010 and $0.000014. Notably, indicators suggest that any such breakout won’t come easily.
The Chaikin Money Flow (CMF) currently sits below the zero line, signaling increased selling pressure. This hints that smart money is exiting positions rather than accumulating.
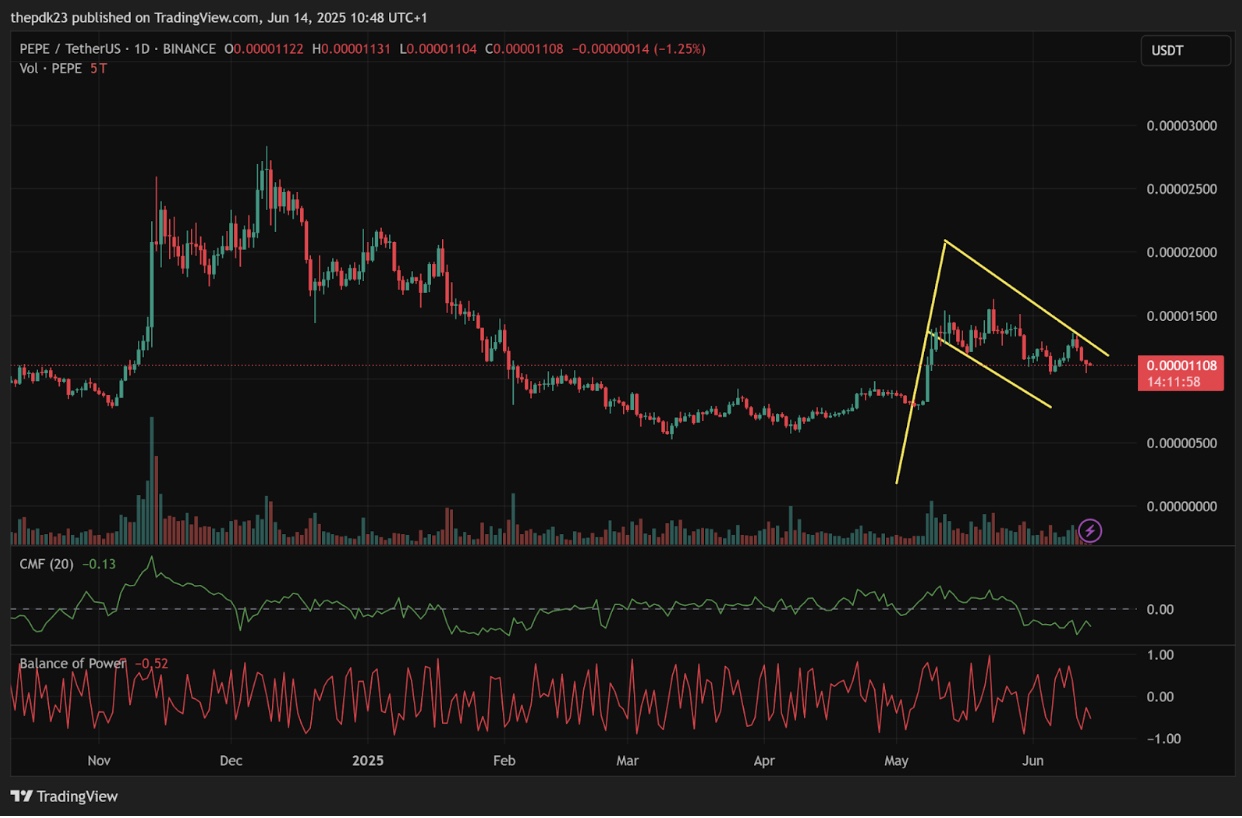
PEPE CMF and BoP Indicators | Source: TradingView
Adding to this bearish weight is the Balance of Power (BoP) reading of -0.52, which underscores a dominance of sellers.
A negative BoP in conjunction with a declining CMF indicates that downward momentum is still very much in play, and bulls will need to defend the critical support at $0.000010 to avoid deeper losses.
Furthermore, a death cross has formed with the 50-day exponential moving average (EMA) dropping below the 20-day EMA, as the dominance of buyers has disappeared from the PEPE price action.
Whale Moves Raise Red Flags
According to TheDataNerd, a wallet labeled 0x6ea deposited 609 billion PEPE tokens (~$6.43 million) into Binance. Despite this large move, the whale still holds a staggering 1.21 trillion PEPE (~$12.77 million).
1 hour ago, a whale 0x6ea deposited 609B $PEPE (~$6.43M) into #Binance
Just now, he still owns 1.21T $PEPE (~$12.77M)
Address:
— The Data Nerd (@OnchainDataNerd) June 13, 2025
Such centralized exchange deposits from whales often precede profit-taking or distribution events. This could explain the over 40% drop in trading volume.
RSI, MACD & Fib Levels Paint Mixed Outlook
According to the daily chart below, the Relative Strength Index (RSI) is currently at 47, hovering just below the neutral 50 zone. This suggests lackluster buying momentum and hints at potential continuation of consolidation.
The MACD indicator is also turning neutral to bearish, with the MACD line recently crossing below the signal line. No clear bullish crossover has occurred yet, indicating that any upward thrust could be delayed.
The Fibonacci extension levels show that the price currently rests between the 0.382 level ($0.00001325) and 0.236 level ($0.00001202). A breach below the $0.000010 support could drag PEPE back toward $0.00000888 (Fib 0.5) or even $0.0000079, the start of the last rally.
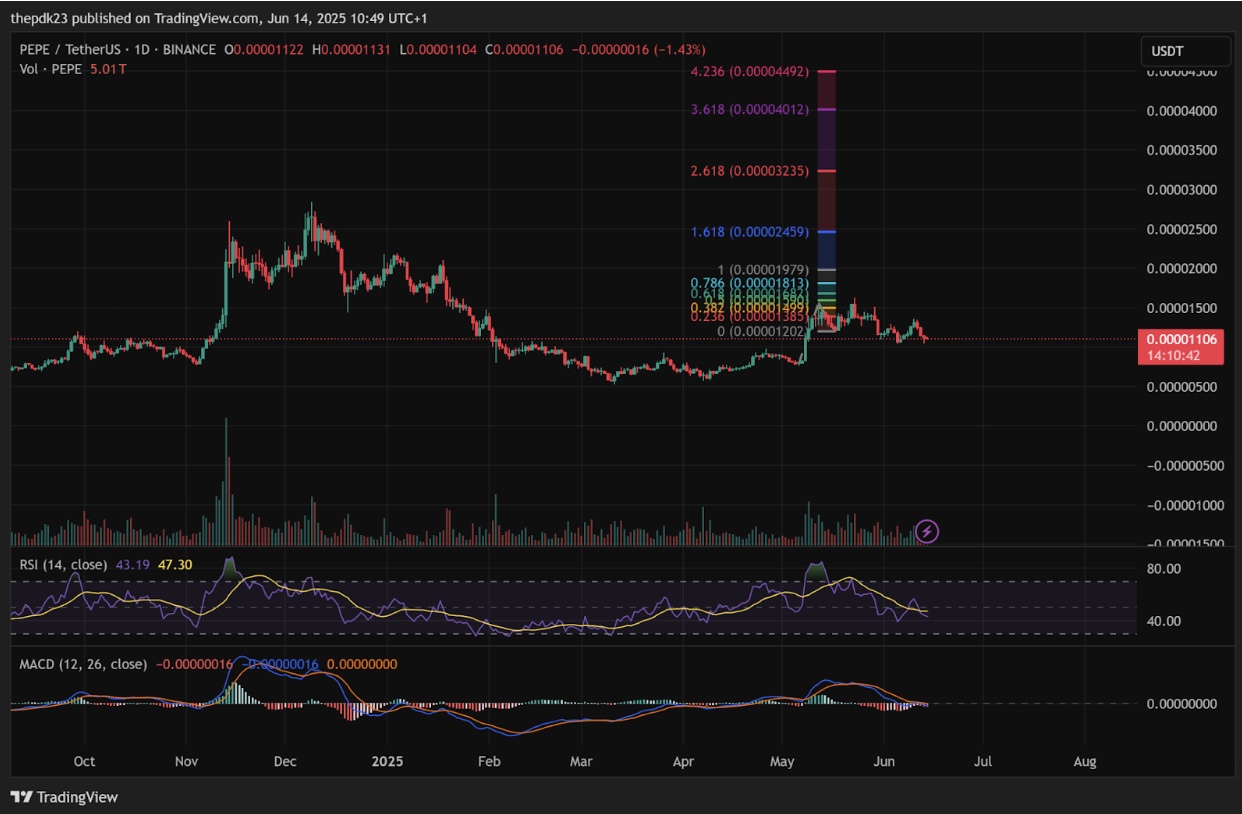
PEPE RSI, MACD, and Fib levels | Source: TradingView
On the upside, a bullish breakout above the flag could lead to a retest of $0.000016, with Fibonacci extension targets of $0.0000245 (1.618) and $0.0000323 (2.618) on the horizon if momentum picks up.
Read More
- All Shadow Armor Locations in Crimson Desert
- How to Get the Sunset Reed Armor Set and Hollow Visage Sword in Crimson Desert
- Best Bows in Crimson Desert
- All Golden Greed Armor Locations in Crimson Desert
- Wings of Iron Walkthrough in Crimson Desert
- All Skyblazer Armor Locations in Crimson Desert
- All Helfryn Armor Locations in Crimson Desert
- How to Craft the Elegant Carmine Armor in Crimson Desert
- Marni Laser Helm Location & Upgrade in Crimson Desert
- How To Beat Ator Archon of Antumbra In Crimson Desert
2025-06-14 21:21