The market’s recent downward trend can’t continue indefinitely. We’re seeing signs that sellers are losing steam across many assets. This could lead to a quick price increase that catches traders off guard and ends the current bearish trend faster than expected.
Shiba Inu’s downtrend exhausted
Based on recent price movement, Shiba Inu’s downward trend may be nearing an end, though it’s been stuck in a prolonged correction that has caused its value to fall roughly 50% from its recent peak.
As I’ve been observing the market recently, I’ve noticed something interesting about SHIB. It’s been going down, but not with the usual speed you’d expect in a strong downturn. Typically, when prices are falling sharply, you see a lot of selling pressure and panic. However, with SHIB, it feels like the downward momentum is losing steam, almost like it’s compressing and pausing before the next move.
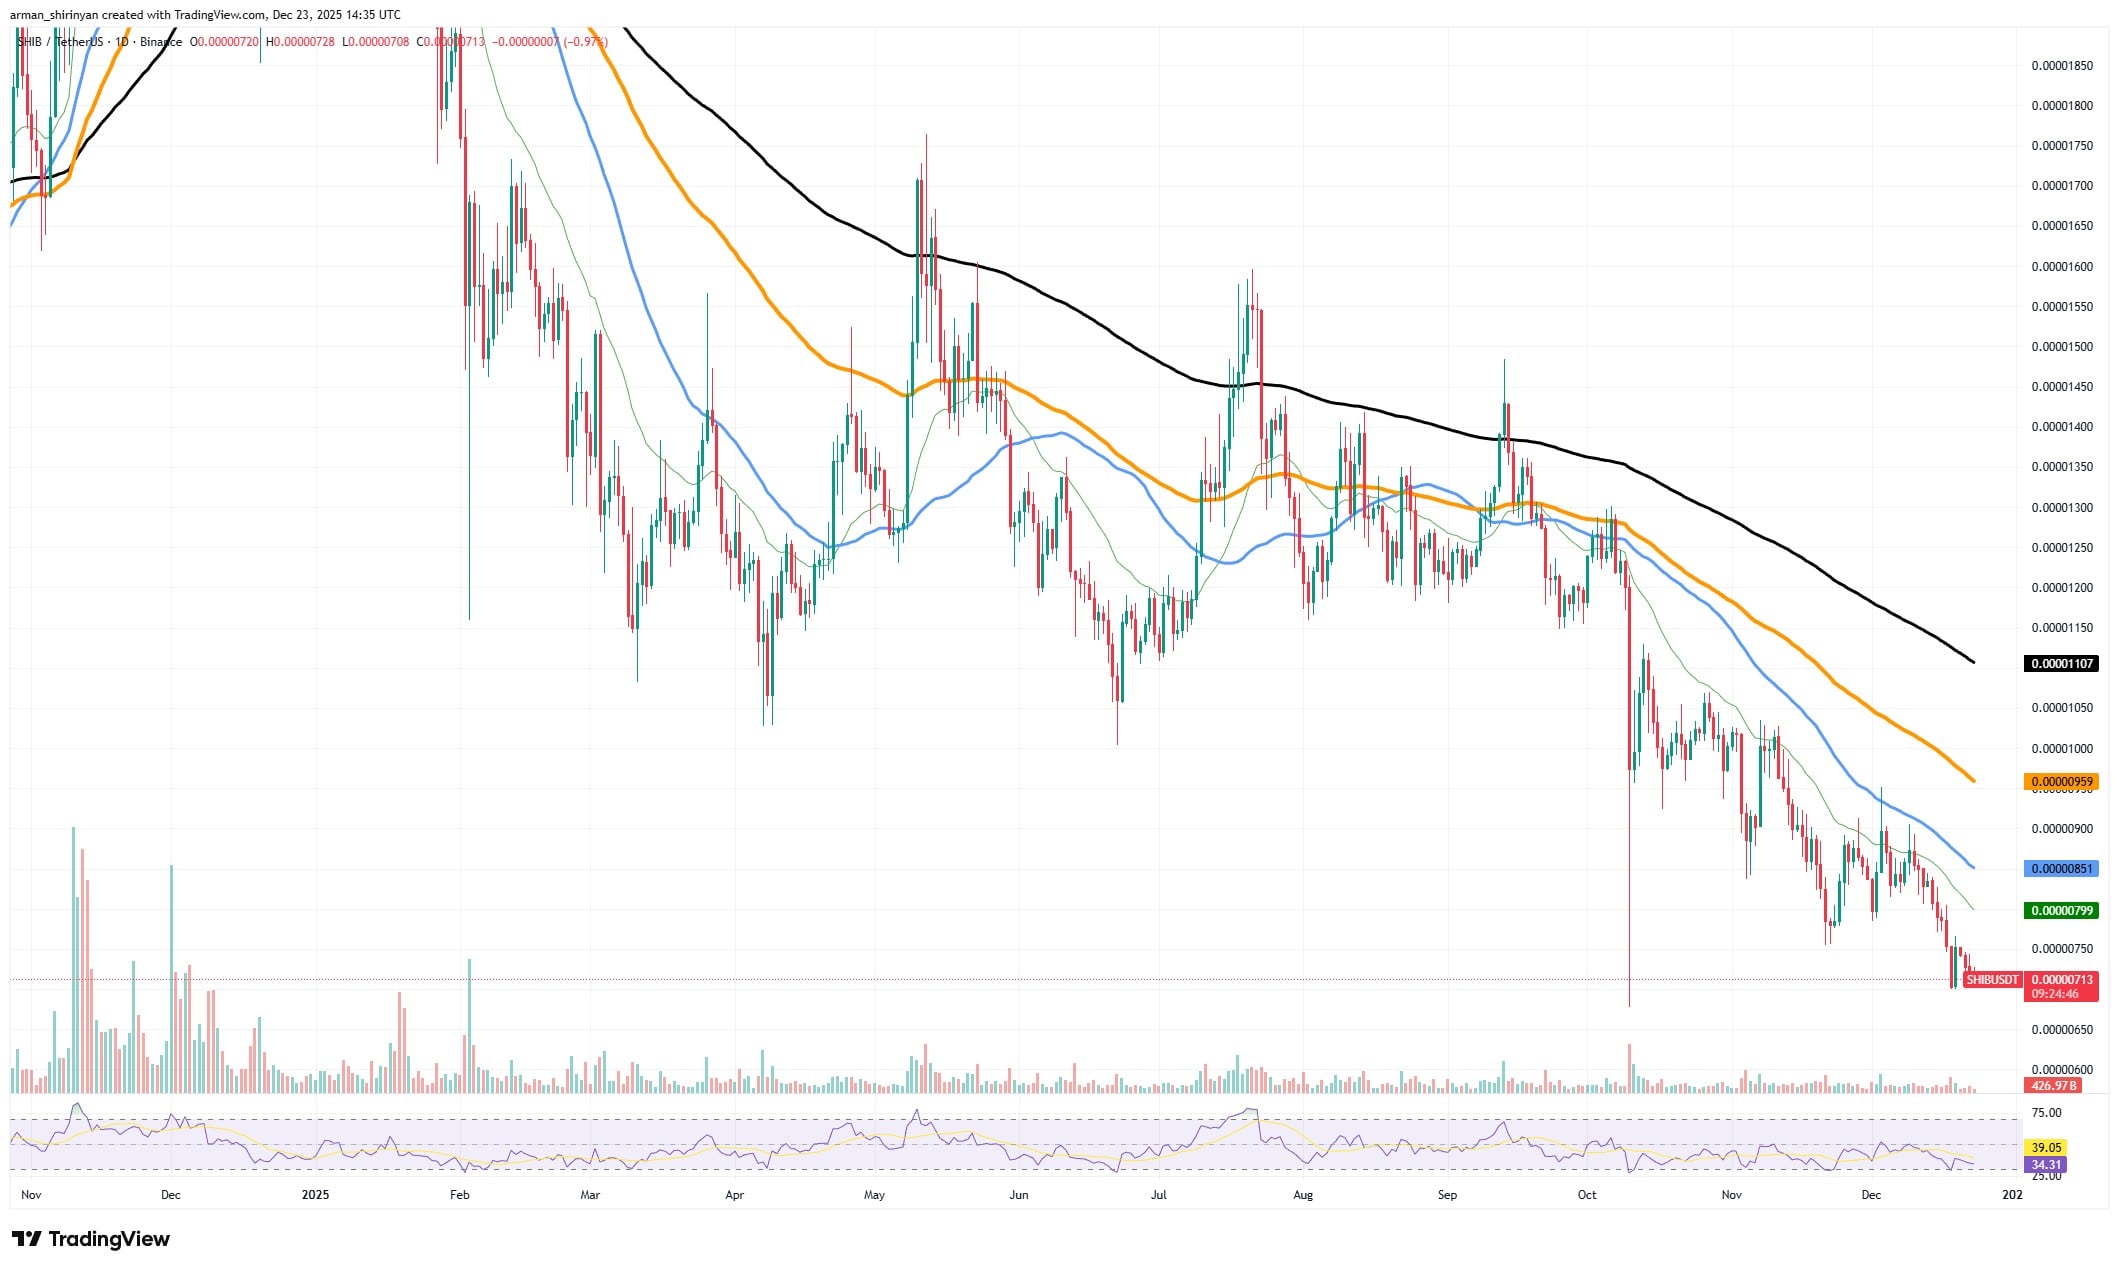
Currently, SHIB’s price remains below its key moving averages, suggesting a continuing downward trend. However, the distance between the price and these averages isn’t increasing as much as it was before. Previously, any price increases were quickly met with selling pressure, pushing the price back down. This selling pressure seems to be easing up.
Sellers aren’t pushing prices down as aggressively anymore, and recent price drops haven’t been very large. This is backed up by trading volume, which shows fewer big sell-offs and more declines happening when fewer people are trading. This suggests there’s less and less available to sell, rather than people losing interest in buying.
Honestly, the recent price drops haven’t felt like everyone’s rushing to sell. It seems more like a lack of new money coming *in*. That’s a big difference, and something I’ve been watching closely. Typically, markets fall when people just stop buying, not necessarily because of a huge wave of selling. It’s when the demand dries up that things really start to dip.
Momentum is also starting to flatten out. The Relative Strength Index (RSI) has been near oversold levels for a while now without falling further. Typically, when an asset is in a downtrend and stays oversold for an extended period, it often signals that the price is about to stabilize and potentially reverse direction, rather than continuing to fall.
This Ethereum signal is nothing
Ethereum’s price chart recently showed a ‘death cross’ – when a short-term moving average drops below a longer-term one. While this sounds alarming, it doesn’t automatically mean Ethereum is about to crash. In fact, this signal isn’t as severe as its name suggests.
This isn’t a typical “death cross” signaling a major market downturn. It’s a smaller, temporary pattern that appeared after a recent price increase, during a period where prices were moving sideways or slightly down. These patterns usually happen *during* a correction, not at the start of a large market decline. Often, most of the price drop has already occurred by the time this pattern forms.
Currently, there’s no real reason to panic about the price of ETH. While the price is being squeezed between a downward-trending average and an upward local trendline, this isn’t a sign of a major collapse. If the market were truly heading for a significant downturn, we’d see strong selling, large price drops, and increased trading volume. Instead, downward movements are weak and selling pressure seems to be under control.
Looking at the trading volume, I’m seeing something important. Typically, when a ‘death cross’ appears – a bearish signal – we’d expect to see a jump in selling activity. But that didn’t happen here. This is key because strong downward trends are usually confirmed by increased participation from sellers. Right now, Ethereum’s quiet trading suggests this isn’t a robust bearish signal – it’s lacking the confirmation we’d normally need.
Momentum indicators aren’t signaling a strong sell-off. The Relative Strength Index (RSI) isn’t showing any extreme conditions or a pattern suggesting a downward trend, and Ethereum isn’t falling any faster than before. It’s currently pausing and moving sideways, which suggests a period of consolidation rather than panicked selling.
Could Ethereum’s price continue to fall? It might, if the price drops below its current upward-trending support level. However, simply pointing to a recent ‘death cross’ as the reason for a potential drop is an oversimplification. This ‘death cross’ isn’t *causing* a future price decline; it’s just showing what has already happened with the price.
Bitcoin has to decide
Although Bitcoin recently dropped toward $80,000, the technical analysis doesn’t show as steep a decline as it might seem. This has, however, sparked the usual debate: is this a major downturn, or simply a temporary pause before prices start rising again?
As an analyst, I observed the downturn beginning when Bitcoin couldn’t sustain its momentum after hitting the $100,000-$105,000 level. The rejection wasn’t gradual; it was a clear signal of weakness, especially as it broke below key moving averages. This triggered a cascade of liquidations for highly leveraged traders, which quickly eroded price support and caused Bitcoin to fall rapidly.
The origins of Bitcoin aren’t important right now. What matters is its current behavior as it approaches a lower price range. The $80,000 level isn’t just a random number; it represents areas where there’s strong buying interest, a key psychological price point, and a previous period where the price stabilized.
As the price has fallen, selling has eased off. The initial price drop saw a surge in trading volume, but later declines haven’t been matched by similar activity, suggesting a lack of strong downward momentum. This doesn’t look like a typical, decisive trend reversal; instead, it appears to be a temporary correction within a broader trading range, and we can expect a bounce back.
The price action is backed up by momentum indicators. While the Relative Strength Index (RSI) is decreasing, it’s starting to stabilize, and isn’t indicating an extreme sell-off. This suggests that sellers are losing steam rather than taking charge, meaning the market may have already passed the point of panicked selling.
The future of Bitcoin hinges on whether it can hold its current price level. If the price remains above $80,000-$82,000 and starts to show increasing lows, the market outlook could shift from a decline to a potential rebound, possibly reaching $90,000.
Read More
- All Skyblazer Armor Locations in Crimson Desert
- All Shadow Armor Locations in Crimson Desert
- How to Get the Sunset Reed Armor Set and Hollow Visage Sword in Crimson Desert
- Marni Laser Helm Location & Upgrade in Crimson Desert
- All Golden Greed Armor Locations in Crimson Desert
- All Helfryn Armor Locations in Crimson Desert
- Keeping Large AI Models Connected Through Network Chaos
- Best Bows in Crimson Desert
- All Icewing Armor Locations in Crimson Desert
- How to Craft the Elegant Carmine Armor in Crimson Desert
2025-12-24 04:01