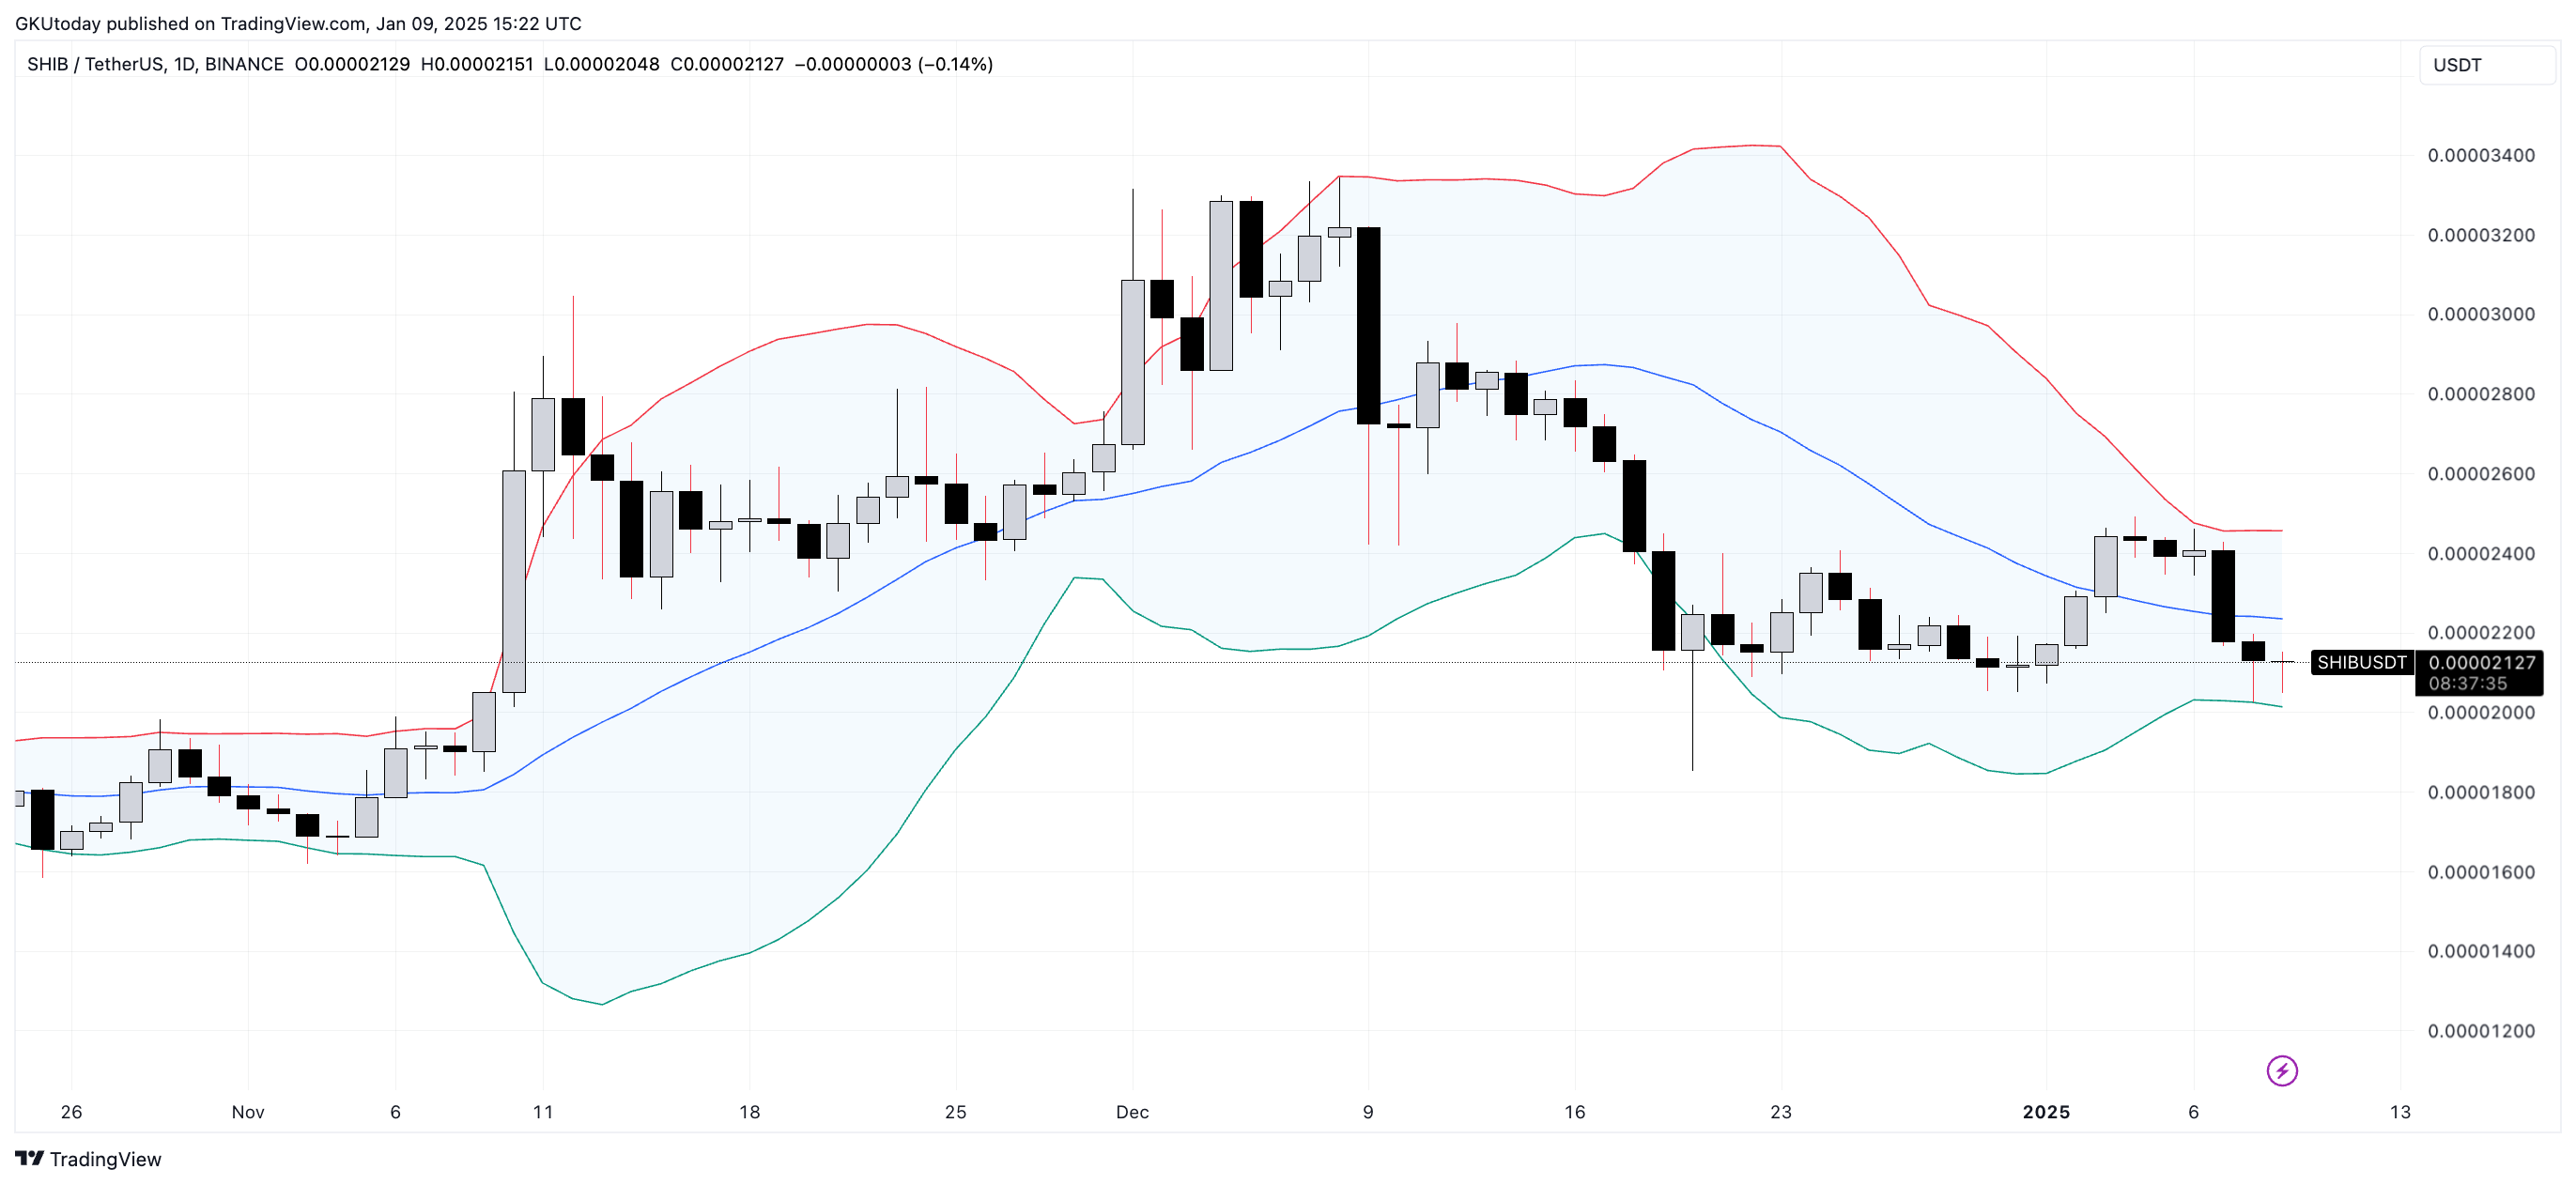
right now, Shiba Inu (SHIB), the well-known cryptocurrency inspired by memes, is seeing a decrease in price and is being traded at approximately $0.0000208. Based on the Bollinger Bands analysis, this value is quite near to the “oversold” region – a significant point for traders to closely watch over.
Bollinger Bands consist of three lines: the upper, middle, and lower bands. The middle line represents the 20-day moving average of a security, while the upper and lower lines are located two standard deviations above and below this average, respectively. Currently, SHIB is nearing the lower band, which is approximately 3.58% below its current price level.
When an asset nears its lower limit, it might indicate that the market could be overly pessimistic or oversold. For Shiba Inu (SHIB), this could imply that its price drop has been excessive and rapid. This observation can lead some investors to exercise caution, as it may reflect widespread negativity towards the market.

However, an over-sold market situation may indicate that positive changes are imminent. In other words, if there are enough buyers entering the market, it might lead to a recovery or rebound.
Should the Shiba Inu token hold its ground and see an increase in purchases, a key resistance point to focus on would be around $0.0000223, as this is where the 20-day moving average currently lies. If the token can push past this, the next significant level to monitor is the upper band at approximately $0.0000246.
Despite SHIB’s current downtrend, there’s a possibility of positive developments ahead. Dipping into the oversold territory might trigger a market rebound, so it’s wise for traders to stay alert and prepared to make moves.
Read More
- REPO: How To Fix Client Timeout
- UNLOCK ALL MINECRAFT LAUNCHER SKILLS
- Unaware Atelier Master: New Trailer Reveals April 2025 Fantasy Adventure!
- 10 Characters You Won’t Believe Are Coming Back in the Next God of War
- 8 Best Souls-Like Games With Co-op
- Top 8 UFC 5 Perks Every Fighter Should Use
- All Balatro Cheats (Developer Debug Menu)
- Unlock Wild Cookie Makeovers with Shroomie Shenanigans Event Guide in Cookie Run: Kingdom!
- How to Reach 80,000M in Dead Rails
- BTC PREDICTION. BTC cryptocurrency
2025-01-09 19:21