Oh, Solana (SOL), you’re down over 11% in just a week! It’s like watching a sad puppy in a rainstorm. 🌧️ Multiple technical indicators are waving red flags, signaling that the momentum is about as strong as a wet noodle. The Relative Strength Index (RSI) has taken a nosedive, and it’s not looking good for our crypto friend.
Meanwhile, the Ichimoku Cloud and EMA structures are throwing a pity party for SOL, showing bearish setups that are as firm as my resolve to avoid the gym. Key resistance levels are holding strong, and support zones are looking shakier than a tightrope walker on a windy day. Unless we see a miracle reversal, SOL might just keep sliding down the slope of despair.
Solana RSI Drops Below 45 as Momentum Fades
So, the RSI has plummeted to 40.77, down from a peppy 64.25 just two days ago. Talk about a dramatic fall from grace! 😬 This sharp decline is like a reality check for SOL, suggesting that sellers are outpacing buyers faster than I can say “crypto crash.”
This downward spiral indicates a potential shift from a neutral or bullish vibe to a more cautious or downright bearish mood. Traders are reassessing their life choices—err, I mean, Solana’s short-term outlook.
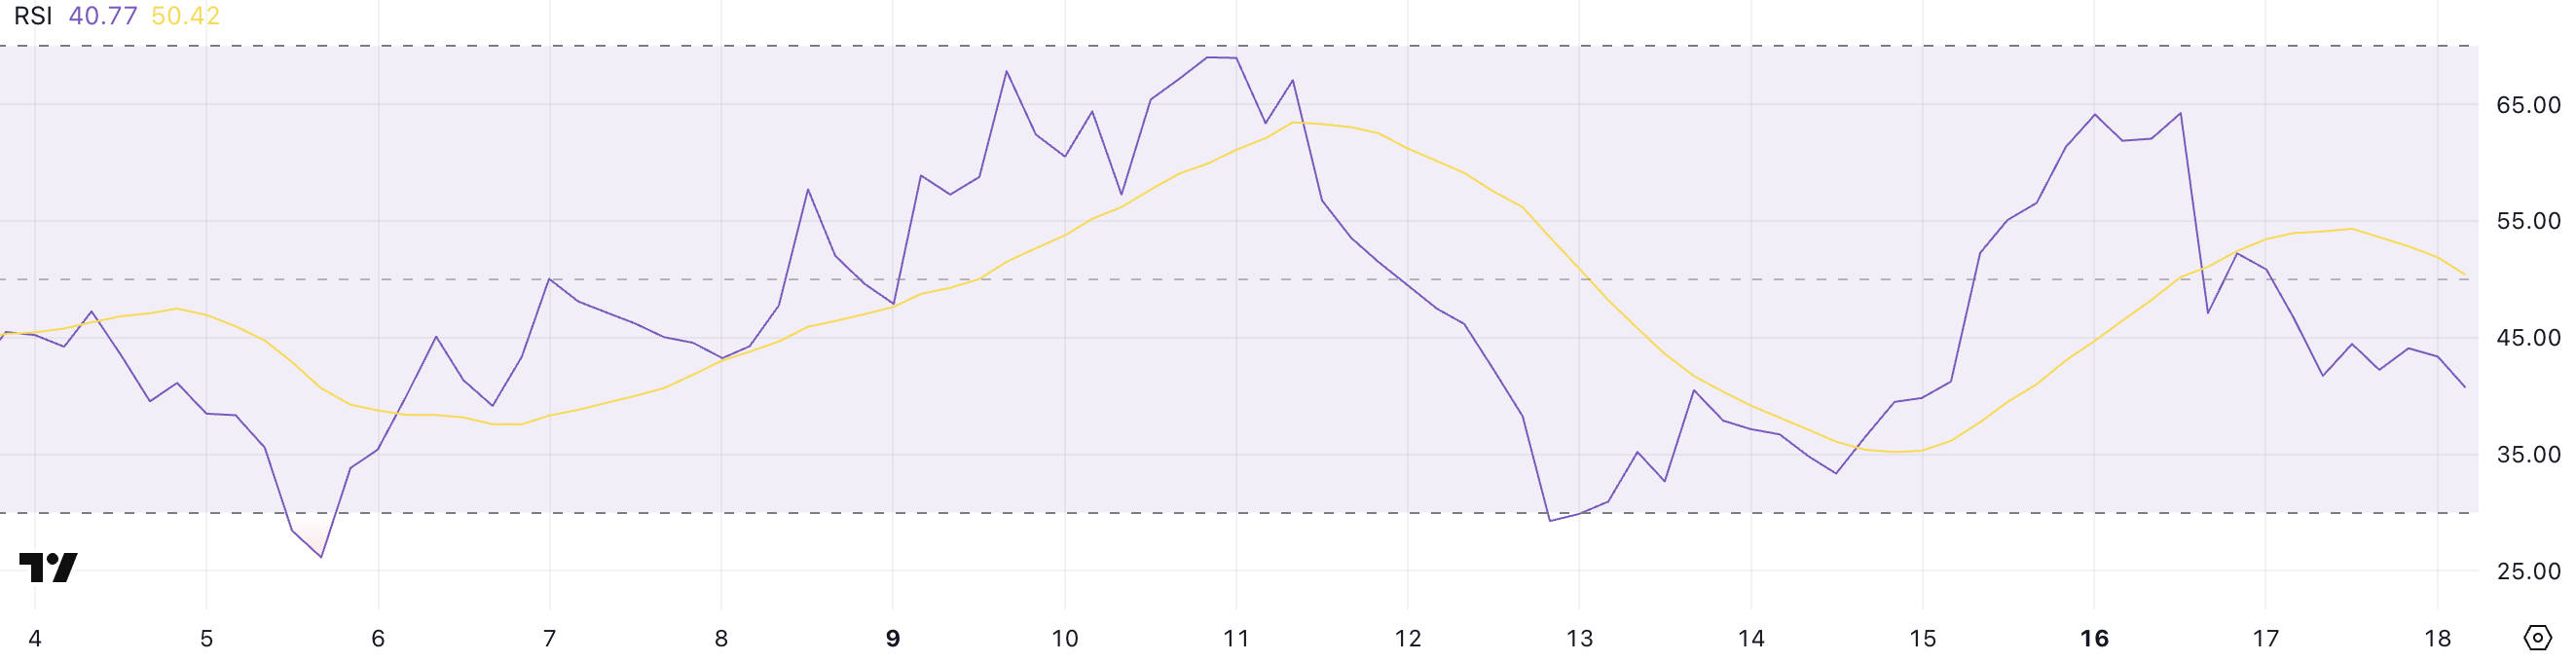
The RSI is like that friend who tells you the truth when you don’t want to hear it. It measures the speed and magnitude of price changes, ranging from 0 to 100. Readings above 70 usually mean “overbought” (cue the price pullbacks), while below 30 suggests “oversold” (hello, potential rebounds!).
At 40.77, Solana is in a neutral-to-weak zone, losing its upward momentum but not quite in the oversold territory yet. If the RSI keeps dropping, we might be in for more downside risk. Stabilization above 40 could mean we’re just taking a breather before the next rollercoaster ride.
Bearish Ichimoku Structure Keeps SOL Under Pressure
Now, let’s talk about the Ichimoku Cloud chart, which is looking as gloomy as a Monday morning. Price action is trading below the Kumo (cloud), which is sporting a lovely shade of red. This red cloud is like a warning sign saying, “Danger! Proceed with caution!”
The Leading Span A (green line) is hanging out below Leading Span B (red line), reinforcing the bearish vibes. The cloud ahead is thick and red, suggesting strong overhead resistance. It’s like trying to break through a wall of marshmallows—good luck with that!
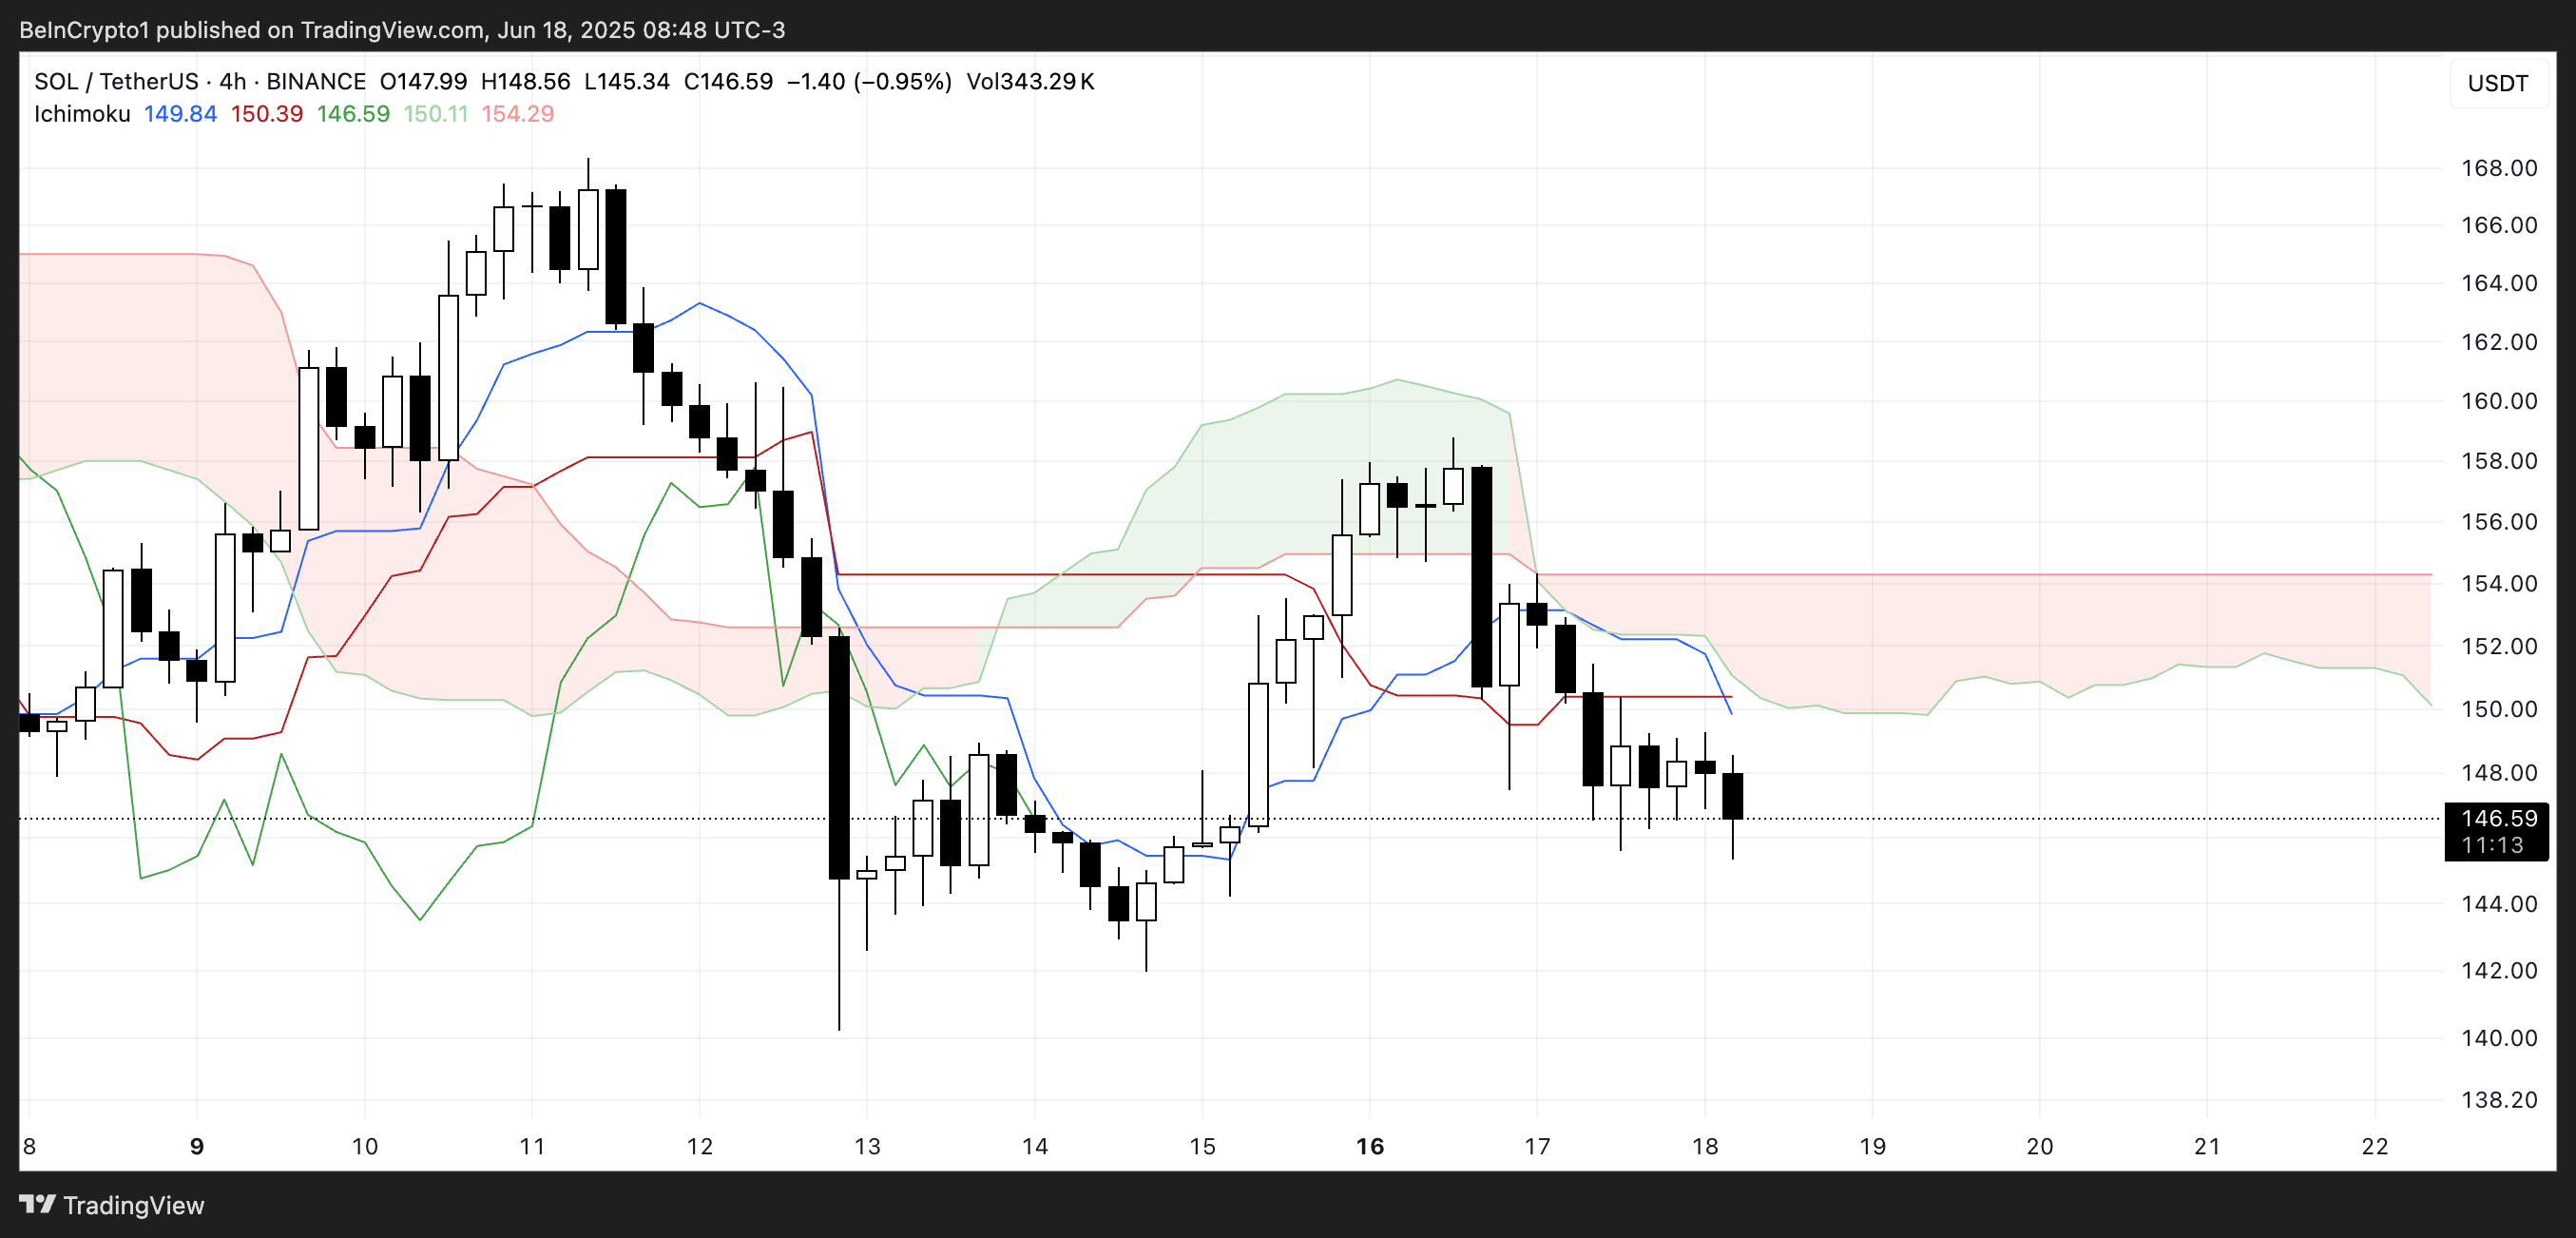
The Tenkan-sen (blue line) is below the Kijun-sen (red line), another classic bearish signal. These lines have flattened out, signaling that we’re in a consolidation phase rather than a strong directional movement.
With candles struggling to break above the Tenkan-sen, short-term momentum looks weaker than my willpower at a dessert buffet. Unless we see a bullish crossover or a price action miracle, Solana is stuck under bearish pressure.
Solana EMA Structure Remains Bearish Despite Recent Rebound Attempt
In case you were wondering, Solana’s EMA structure is still bearish, with shorter-term moving averages hanging out below the longer-term ones—like a sad little brother. This setup emerged after a failed bullish attempt two days ago, where SOL tried to turn things around but got rejected harder than a bad date.
If this bearish alignment holds, we could see SOL testing its immediate support level at $141.53. A breakdown below that could open the floodgates to further downside, potentially pushing SOL below $140 for the first time since April 21. Yikes! 😱
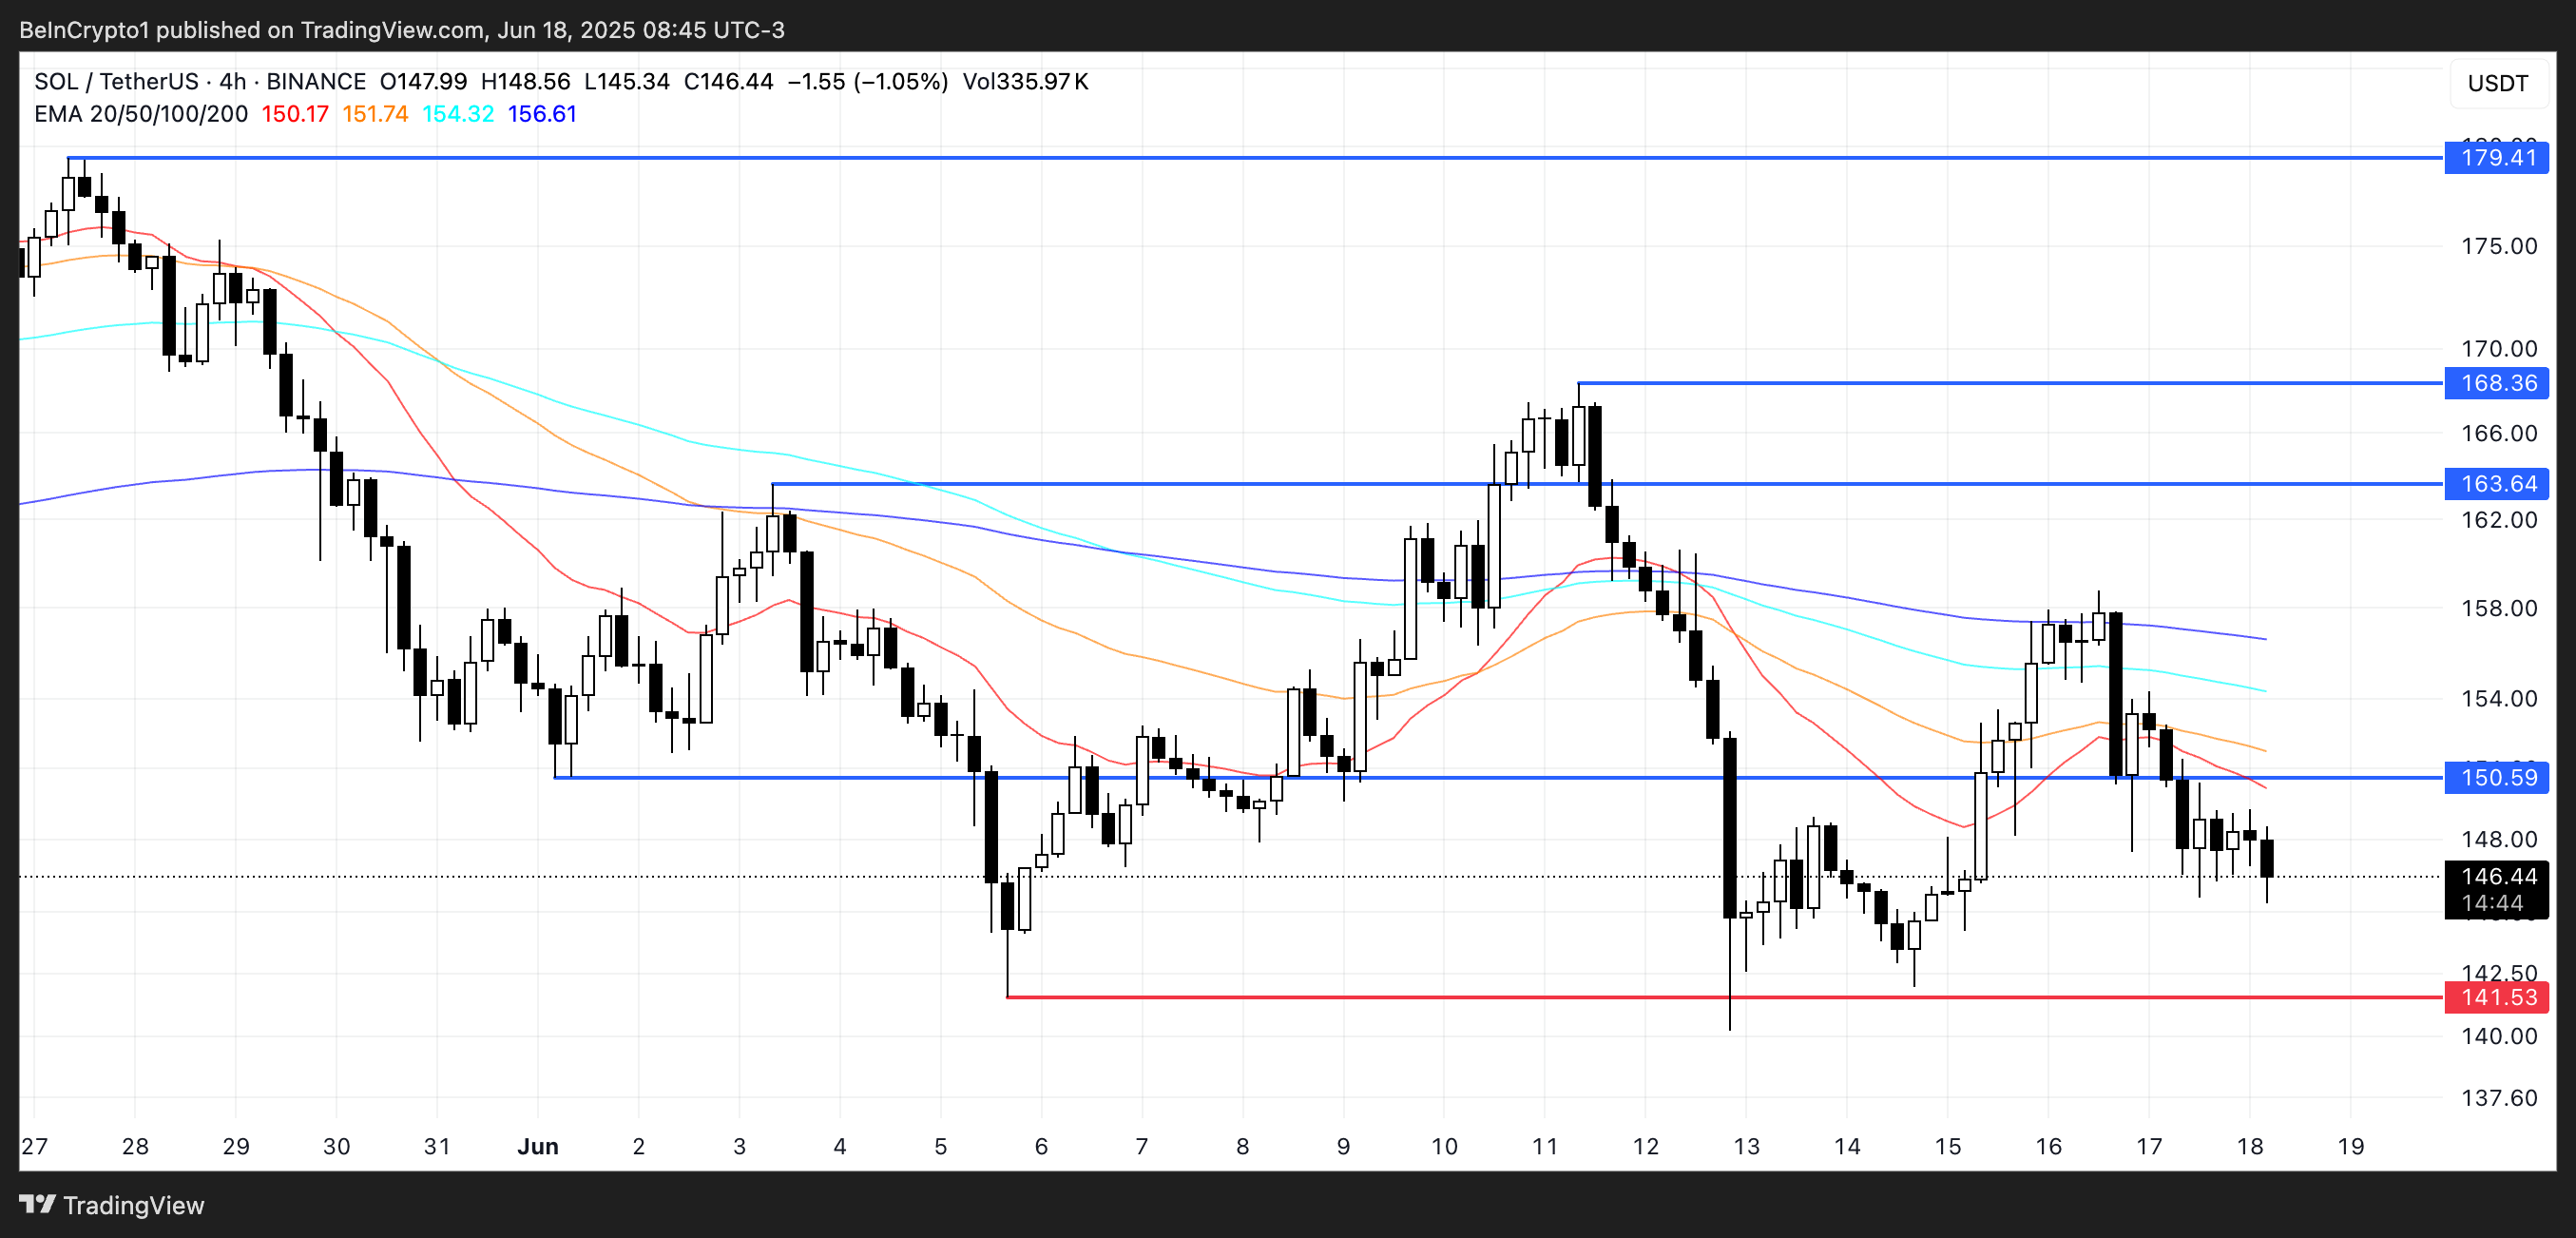
On the bright side, if the trend reverses and short-term EMAs start curving upward, Solana could retest the resistance zone around $150.59. A clean break above this level would be the first sign of a potential trend shift. If buying momentum strengthens, we might even see higher resistance targets at $163.64 and $168.36.
And if we’re really lucky, SOL might aim for $179.41 as the next major upside level. But let’s not get ahead of ourselves—first, we need to find a way out of this bearish mess!
Read More
- All Shadow Armor Locations in Crimson Desert
- Sega Reveals Official Sonic Timeline: From Prehistoric to Modern Era
- Genshin Impact Dev Teases New Open-World MMO With Realistic Graphics
- The Limits of Thought: Can We Compress Reasoning in AI?
- Dark Marksman Armor Locations in Crimson Desert
- Where to Pack and Sell Trade Goods in Crimson Desert
- How to Beat Antumbra’s Sword (Sanctum of Absolution) in Crimson Desert
- Enshrouded: Giant Critter Scales Location
- Who Can You Romance In GreedFall 2: The Dying World?
- Best Weapons, Armor, and Accessories to Get Early in Crimson Desert
2025-06-18 22:21