Despite brief bouts of intraday stability, sentiment remains fragile as traders hesitate to commit to new positions, waiting instead for a stronger signal to confirm direction. 🐢✨
Open Interest Signals Caution as Price Slides Below Key Levels
XLM/USD is trading around $0.2483, posting a mild 0.23% hourly uptick, but this move does little to disguise the broader downtrend. The pair continues to print a consistent pattern of lower highs and lower lows, suggesting sellers remain firmly in control. Attempts to push higher have repeatedly fizzled, with quick rejections keeping price stuck beneath the important $0.26 resistance level. 🧙♂️💸
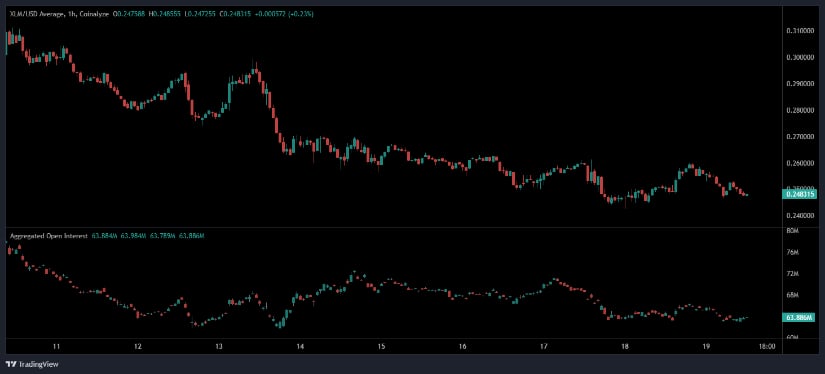
Open interest in the coin derivatives stands near 63.9 million, a level that reflects activity but not conviction. The absence of a meaningful spike in open interest points to a market unwilling to take aggressive positions. Traders appear to be waiting for clarity rather than speculating on potential reversals. With neither bulls nor bears showing dominant leverage interest, the current movement reflects hesitation rather than trend expansion. 🤷♂️🌀
Short-Term Strength but Long-Term Fragility
Data from BraveNewCoin places XLM at $0.26, up 3.89% over the past 24 hours. While this recovery offers some momentary relief, it contrasts with the intraday weakness observed on shorter timeframes, highlighting the asset’s ongoing volatility. Stellar now holds a market capitalization of $8.23 billion, with $184.4 million in trading volume. This steady liquidity shows interest remains present, even as sentiment wavers. 🧠📉
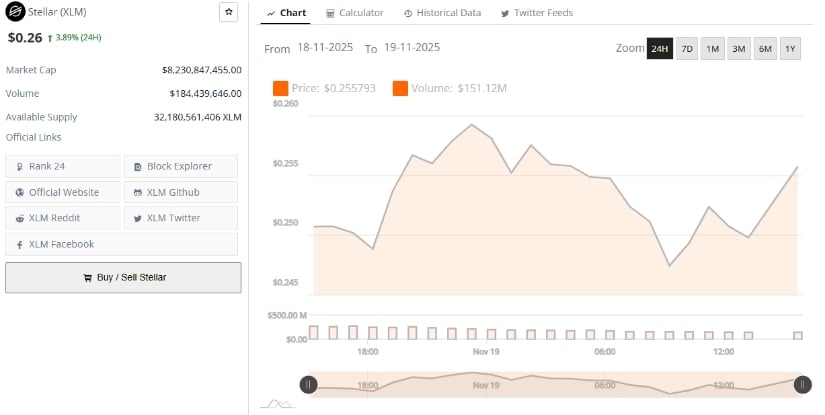
The available supply of 32.18 billion tokens continues to place pressure on demand, especially during periods of declining momentum. On multi-term charts, price fluctuations between $0.245 and $0.260 illustrate a tight consolidation range, with buyers and sellers both probing for control. While the daily gains appear encouraging, they do not override the structural weakness witnessed in recent sessions. 🧱📉
Analysts note that the broader picture suggests Stellar is still searching for a stable support floor. The market’s choppy behavior implies uncertainty, making it difficult to determine whether the latest bounce is the start of a recovery or simply a temporary relief within a continuing downtrend. 🌀🧭
TradingView Indicators Highlight Mounting Downside Pressure
On the TradingView daily chart, XLM shows a more concerning view. The asset is trading at $0.2484, down nearly 2.9% on the day and extending its multi-week decline. The coin remains firmly below the Bollinger Band basis at $0.2762, signaling that bearish control persists. With price now gravitating toward the lower band at $0.2395, downside pressure continues to build. 🐍📉
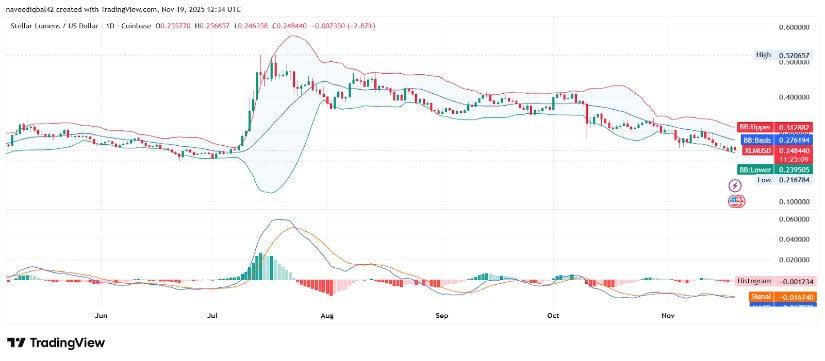
Attempts to rally have consistently failed; each bounce has been met with renewed selling. Momentum indicators reinforce this outlook: the MACD remains below the signal line, with the histogram at -0.0012 and the signal line at -0.0167. These readings indicate fading buyer interest and no clear signs of a bullish reversal. Additionally, narrowing Bollinger Bands points to suppressed volatility, typically a precursor to either consolidation or the next impulsive breakdown. 🧠💣
Read More
- Top 10 Must-Watch Isekai Anime on Crunchyroll Revealed!
- How to Unlock & Visit Town Square in Cookie Run: Kingdom
- Deltarune Chapter 1 100% Walkthrough: Complete Guide to Secrets and Bosses
- Top 8 UFC 5 Perks Every Fighter Should Use
- 10 Best Indie Games With Infinite Replayability
- All Carcadia Burn ECHO Log Locations in Borderlands 4
- Best PSP Spin-Off Games, Ranked
- Multiplayer Games That Became Popular Years After Launch
- Enshrouded: Giant Critter Scales Location
- Scopper’s Observation Haki Outshines Shanks’ Future Sight!
2025-11-20 02:53