On March 30, 2026, at 8:30 a.m. Eastern time, Bitcoin’s price recovered to $67,625, fluctuating between $65,112 and $67,777. This increase followed comments from U.S. President Donald Trump, who suggested possible talks with a new Iranian government but warned of potential attacks on Iran’s energy facilities if negotiations fall apart. This geopolitical development gave crypto markets a boost, but the overall price trend still indicates a period of stability rather than a strong, definitive move.
Bitcoin Chart Outlook
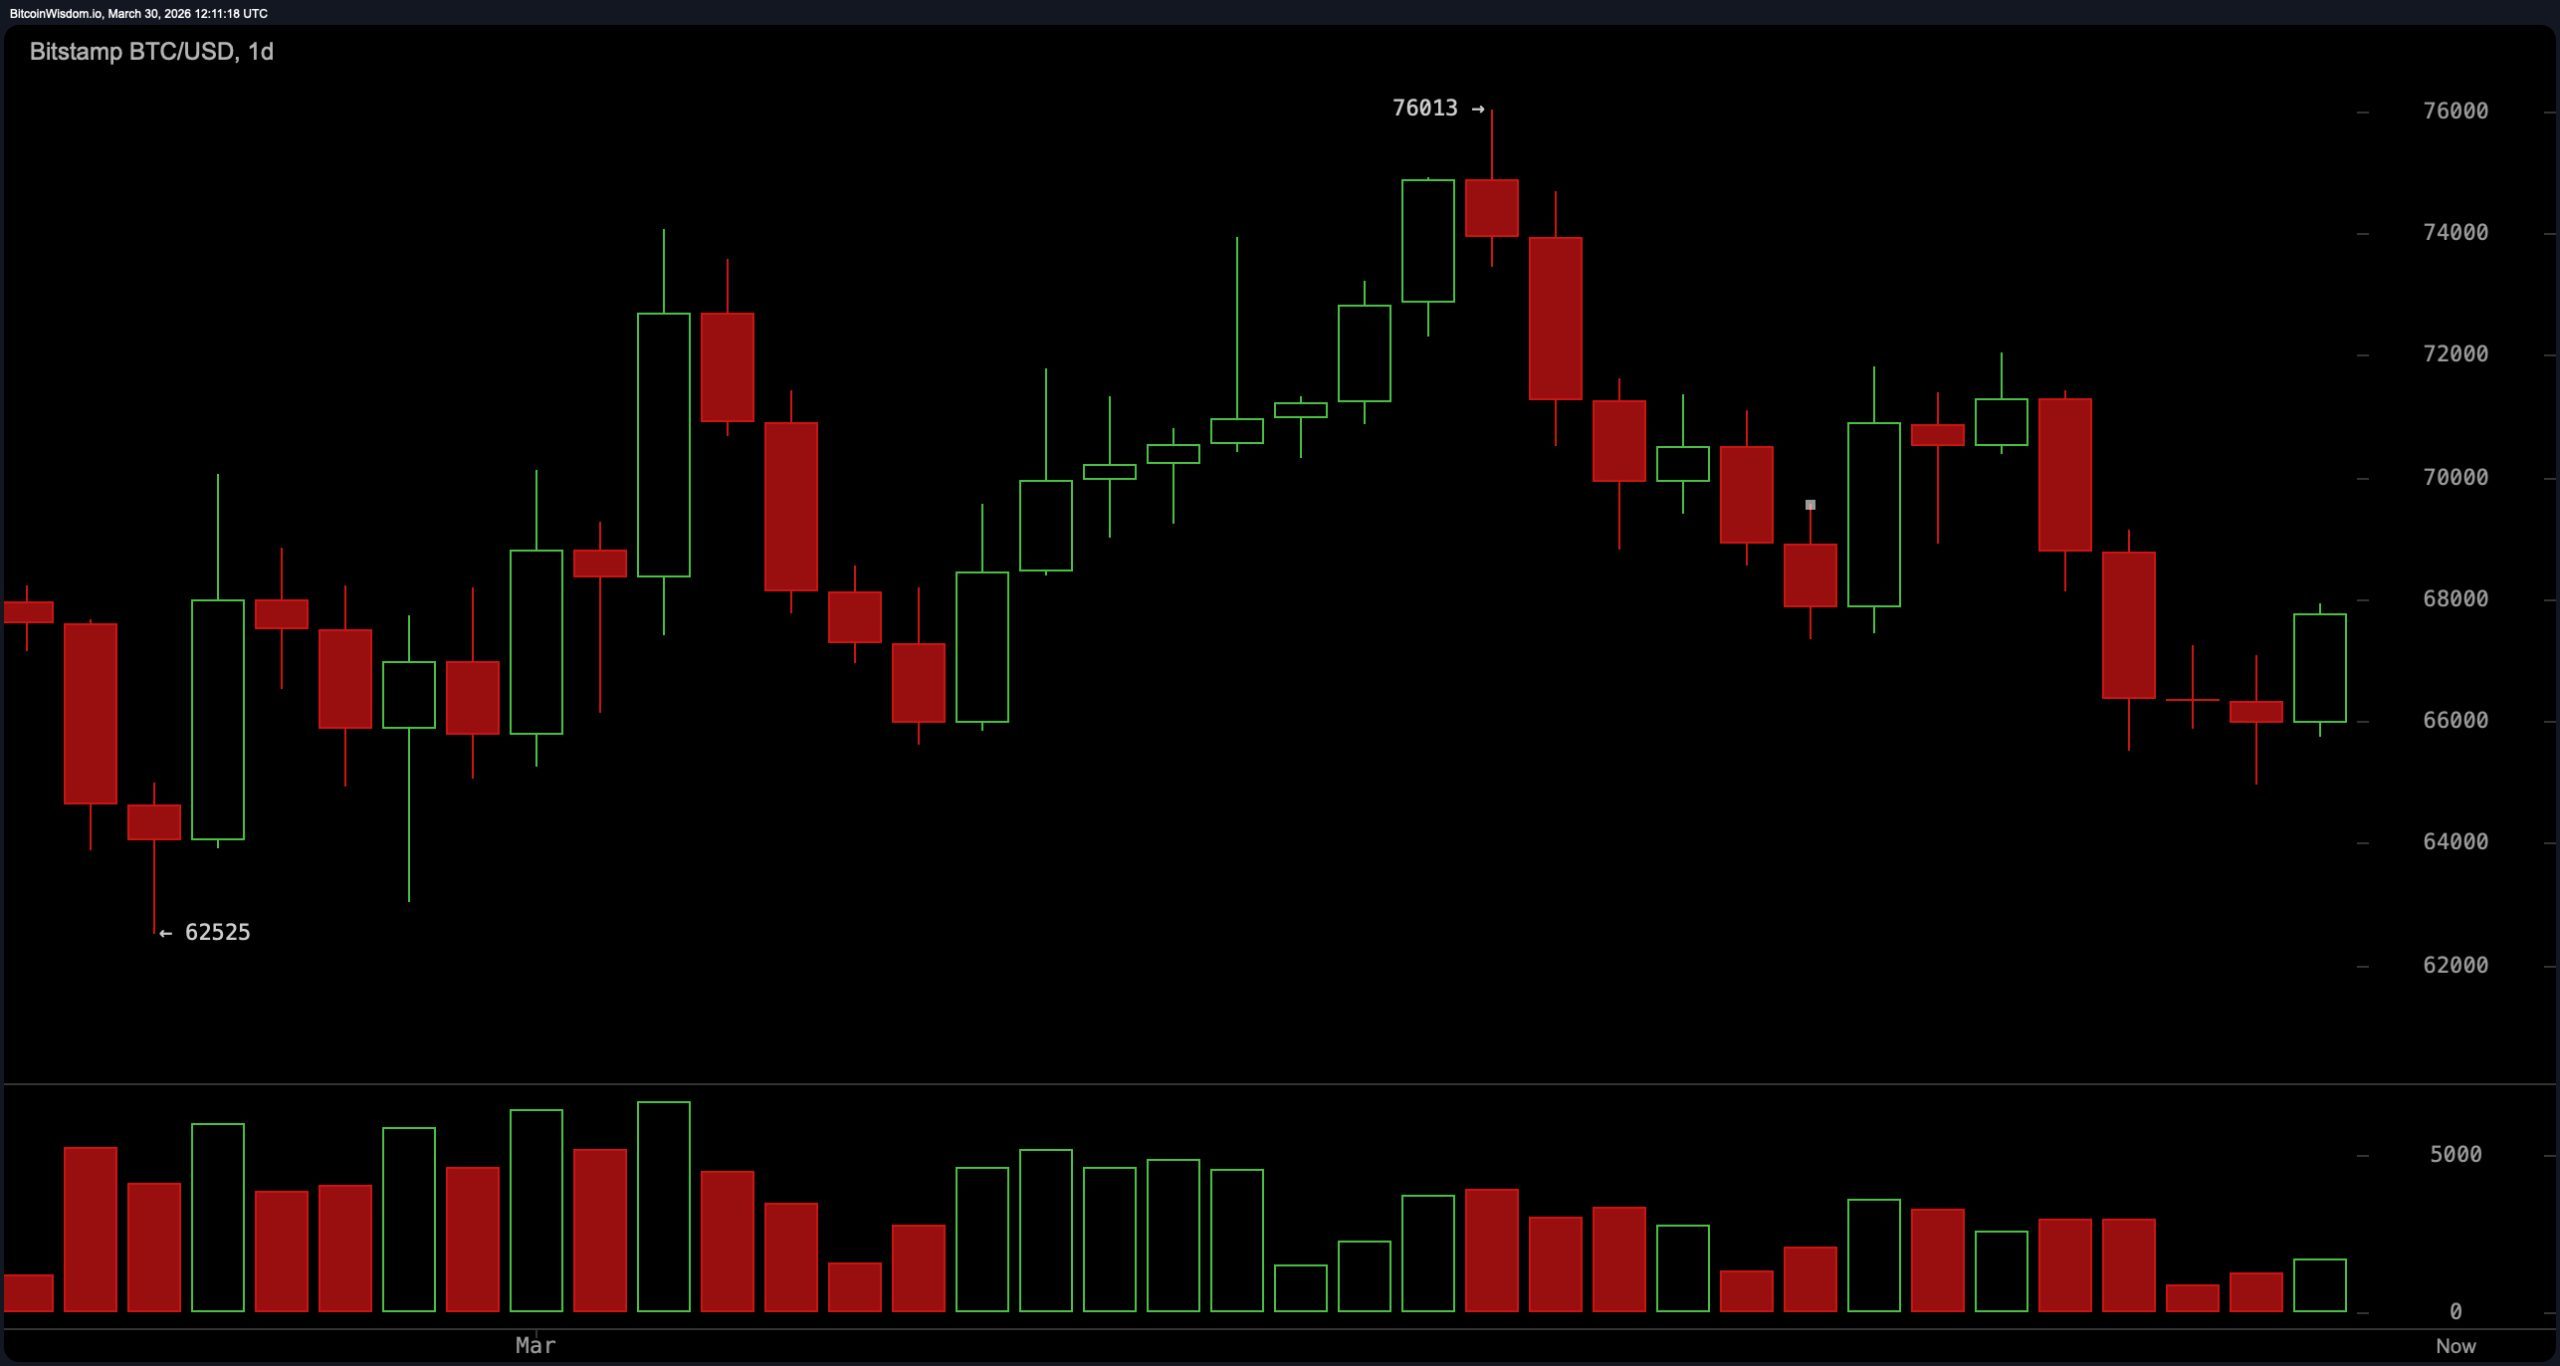
The daily bitcoin chart continues to reflect a market stuck between recovery and fatigue, with BTC hovering in a broader $65,000 to $70,000 band following rejection near the $76,000 region. Lower highs remain intact, suggesting lingering downward pressure despite recent stabilization.
The price isn’t falling sharply, but rather seems to be stabilizing around $65,000. While there’s resistance around $70,000, the market is currently pausing, not crashing. However, it still needs to demonstrate it can start climbing consistently again.
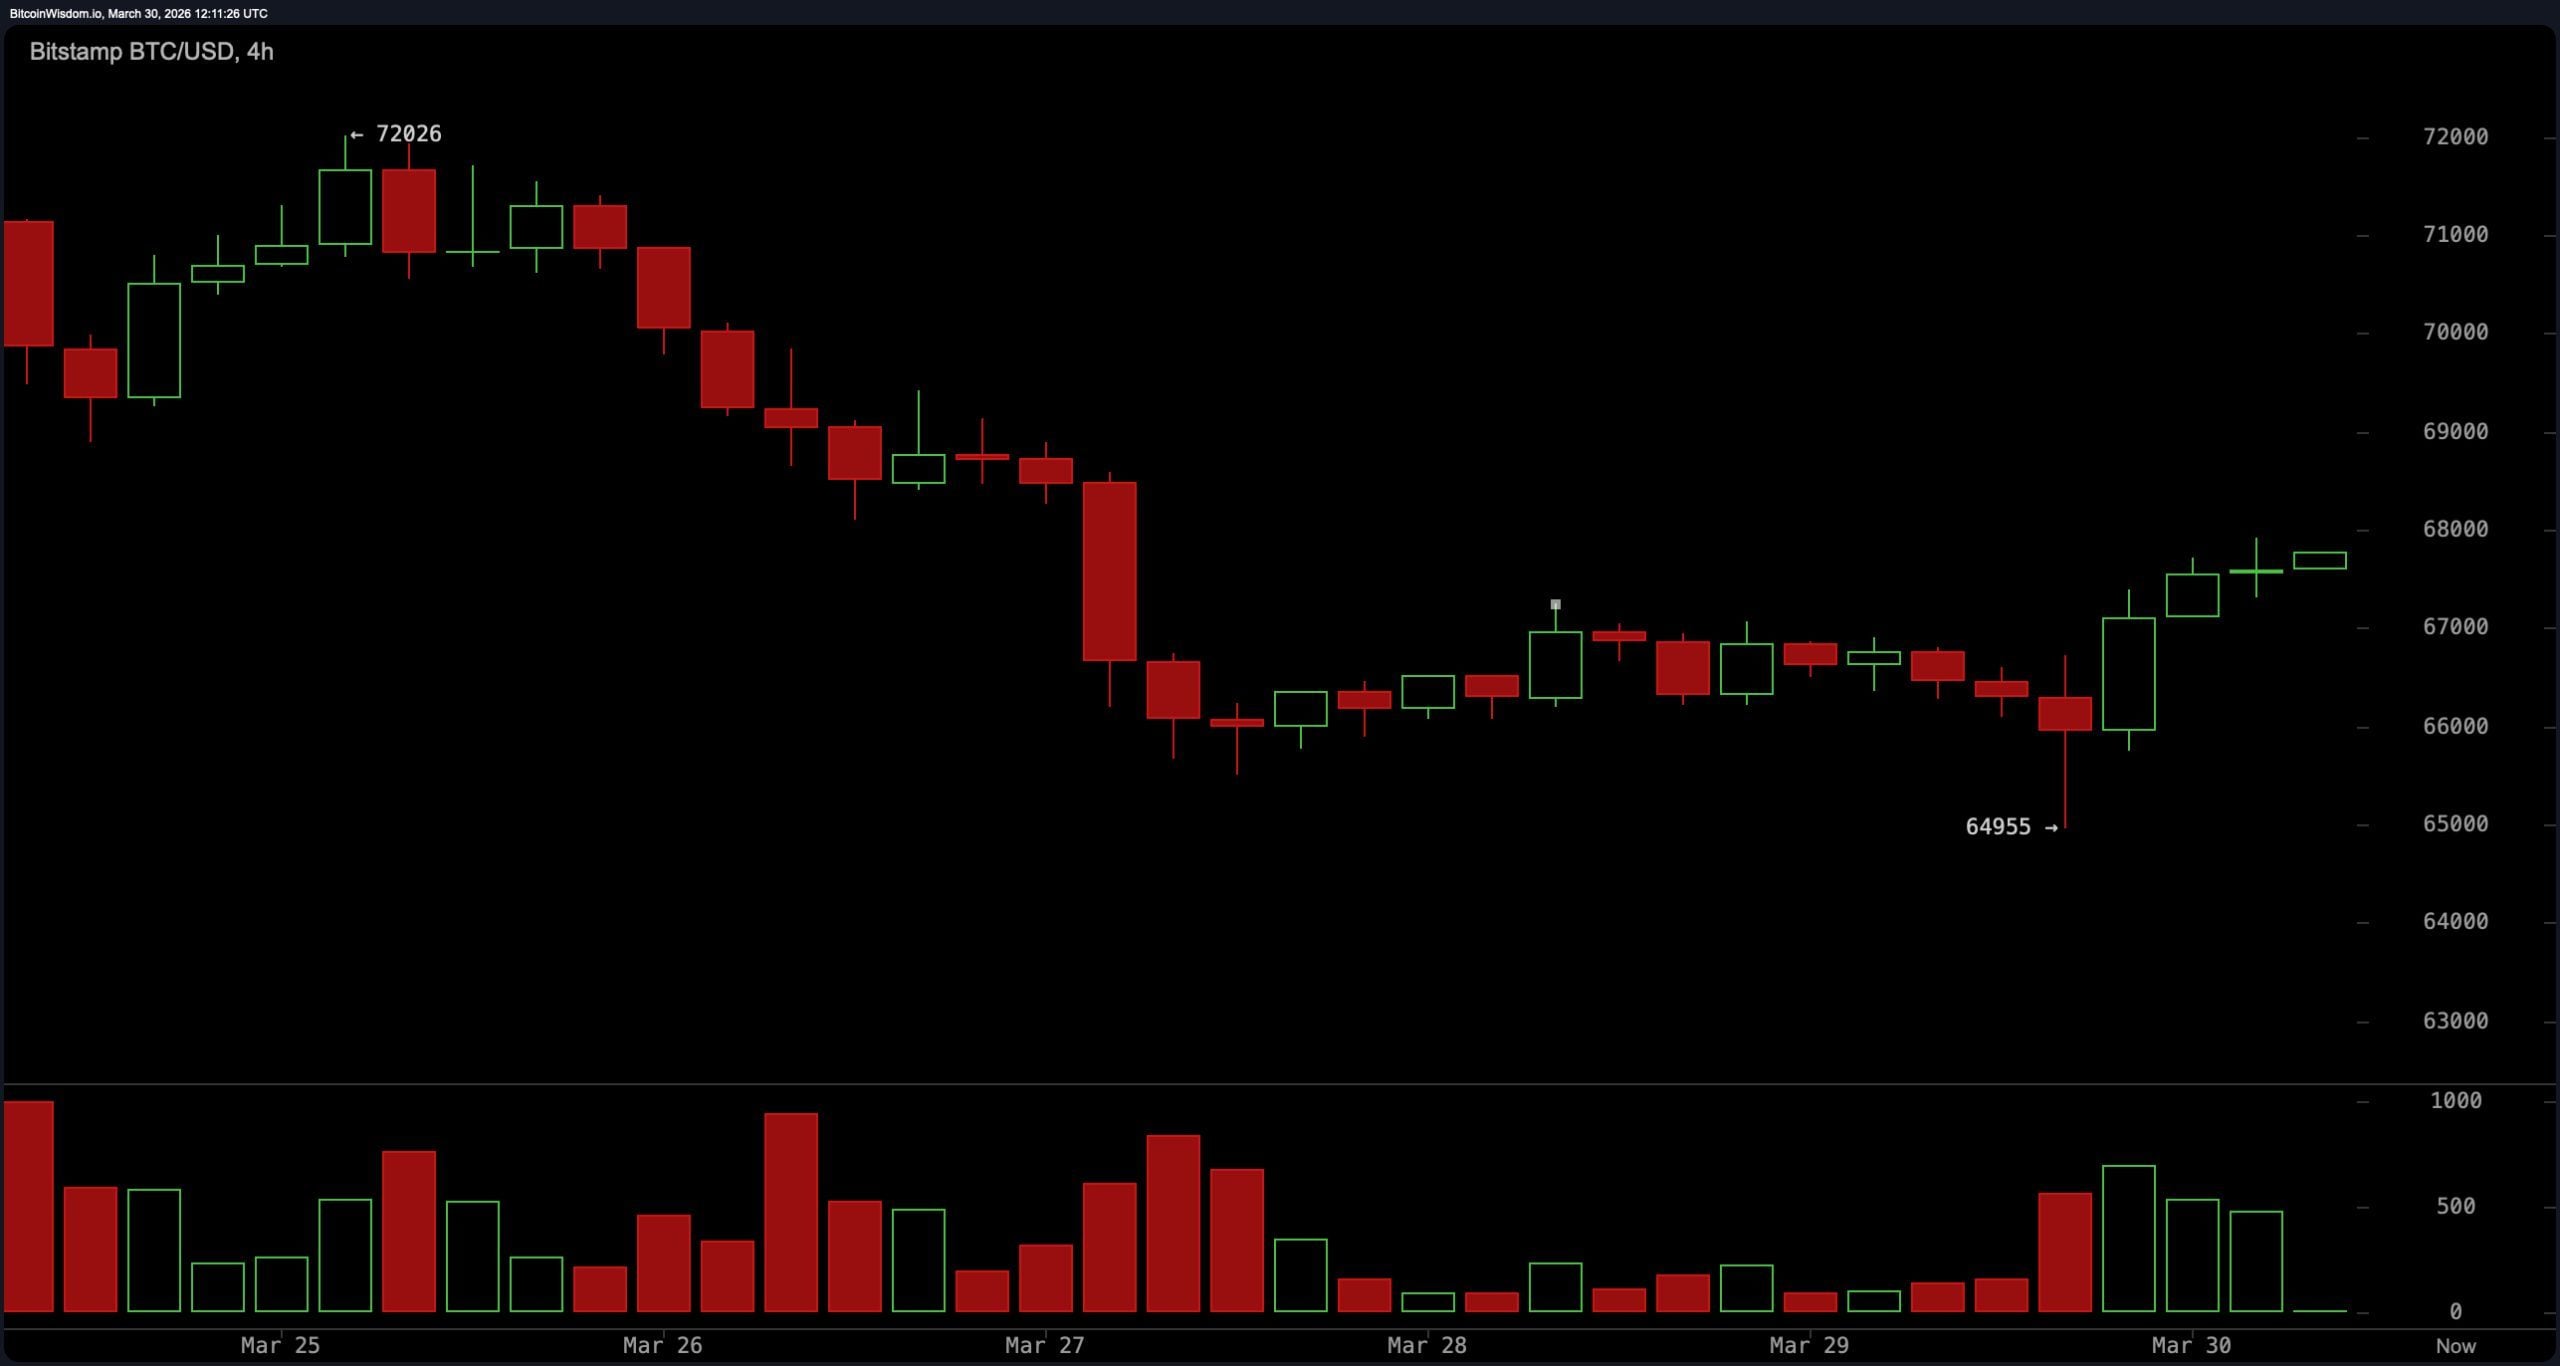
On the 4-hour chart, the tone shifts slightly more constructive, though not decisively so. Bitcoin has transitioned from a clear downtrend into a basing structure, with higher lows forming after a reaction near $64,900. This suggests early-stage recovery behavior, but price is now pressing into resistance between roughly $68,500 and $70,000, an area that previously rejected advances. The structure hints at a possible reversal attempt, but without a clean break higher, it remains just that—an attempt, not a confirmed shift.
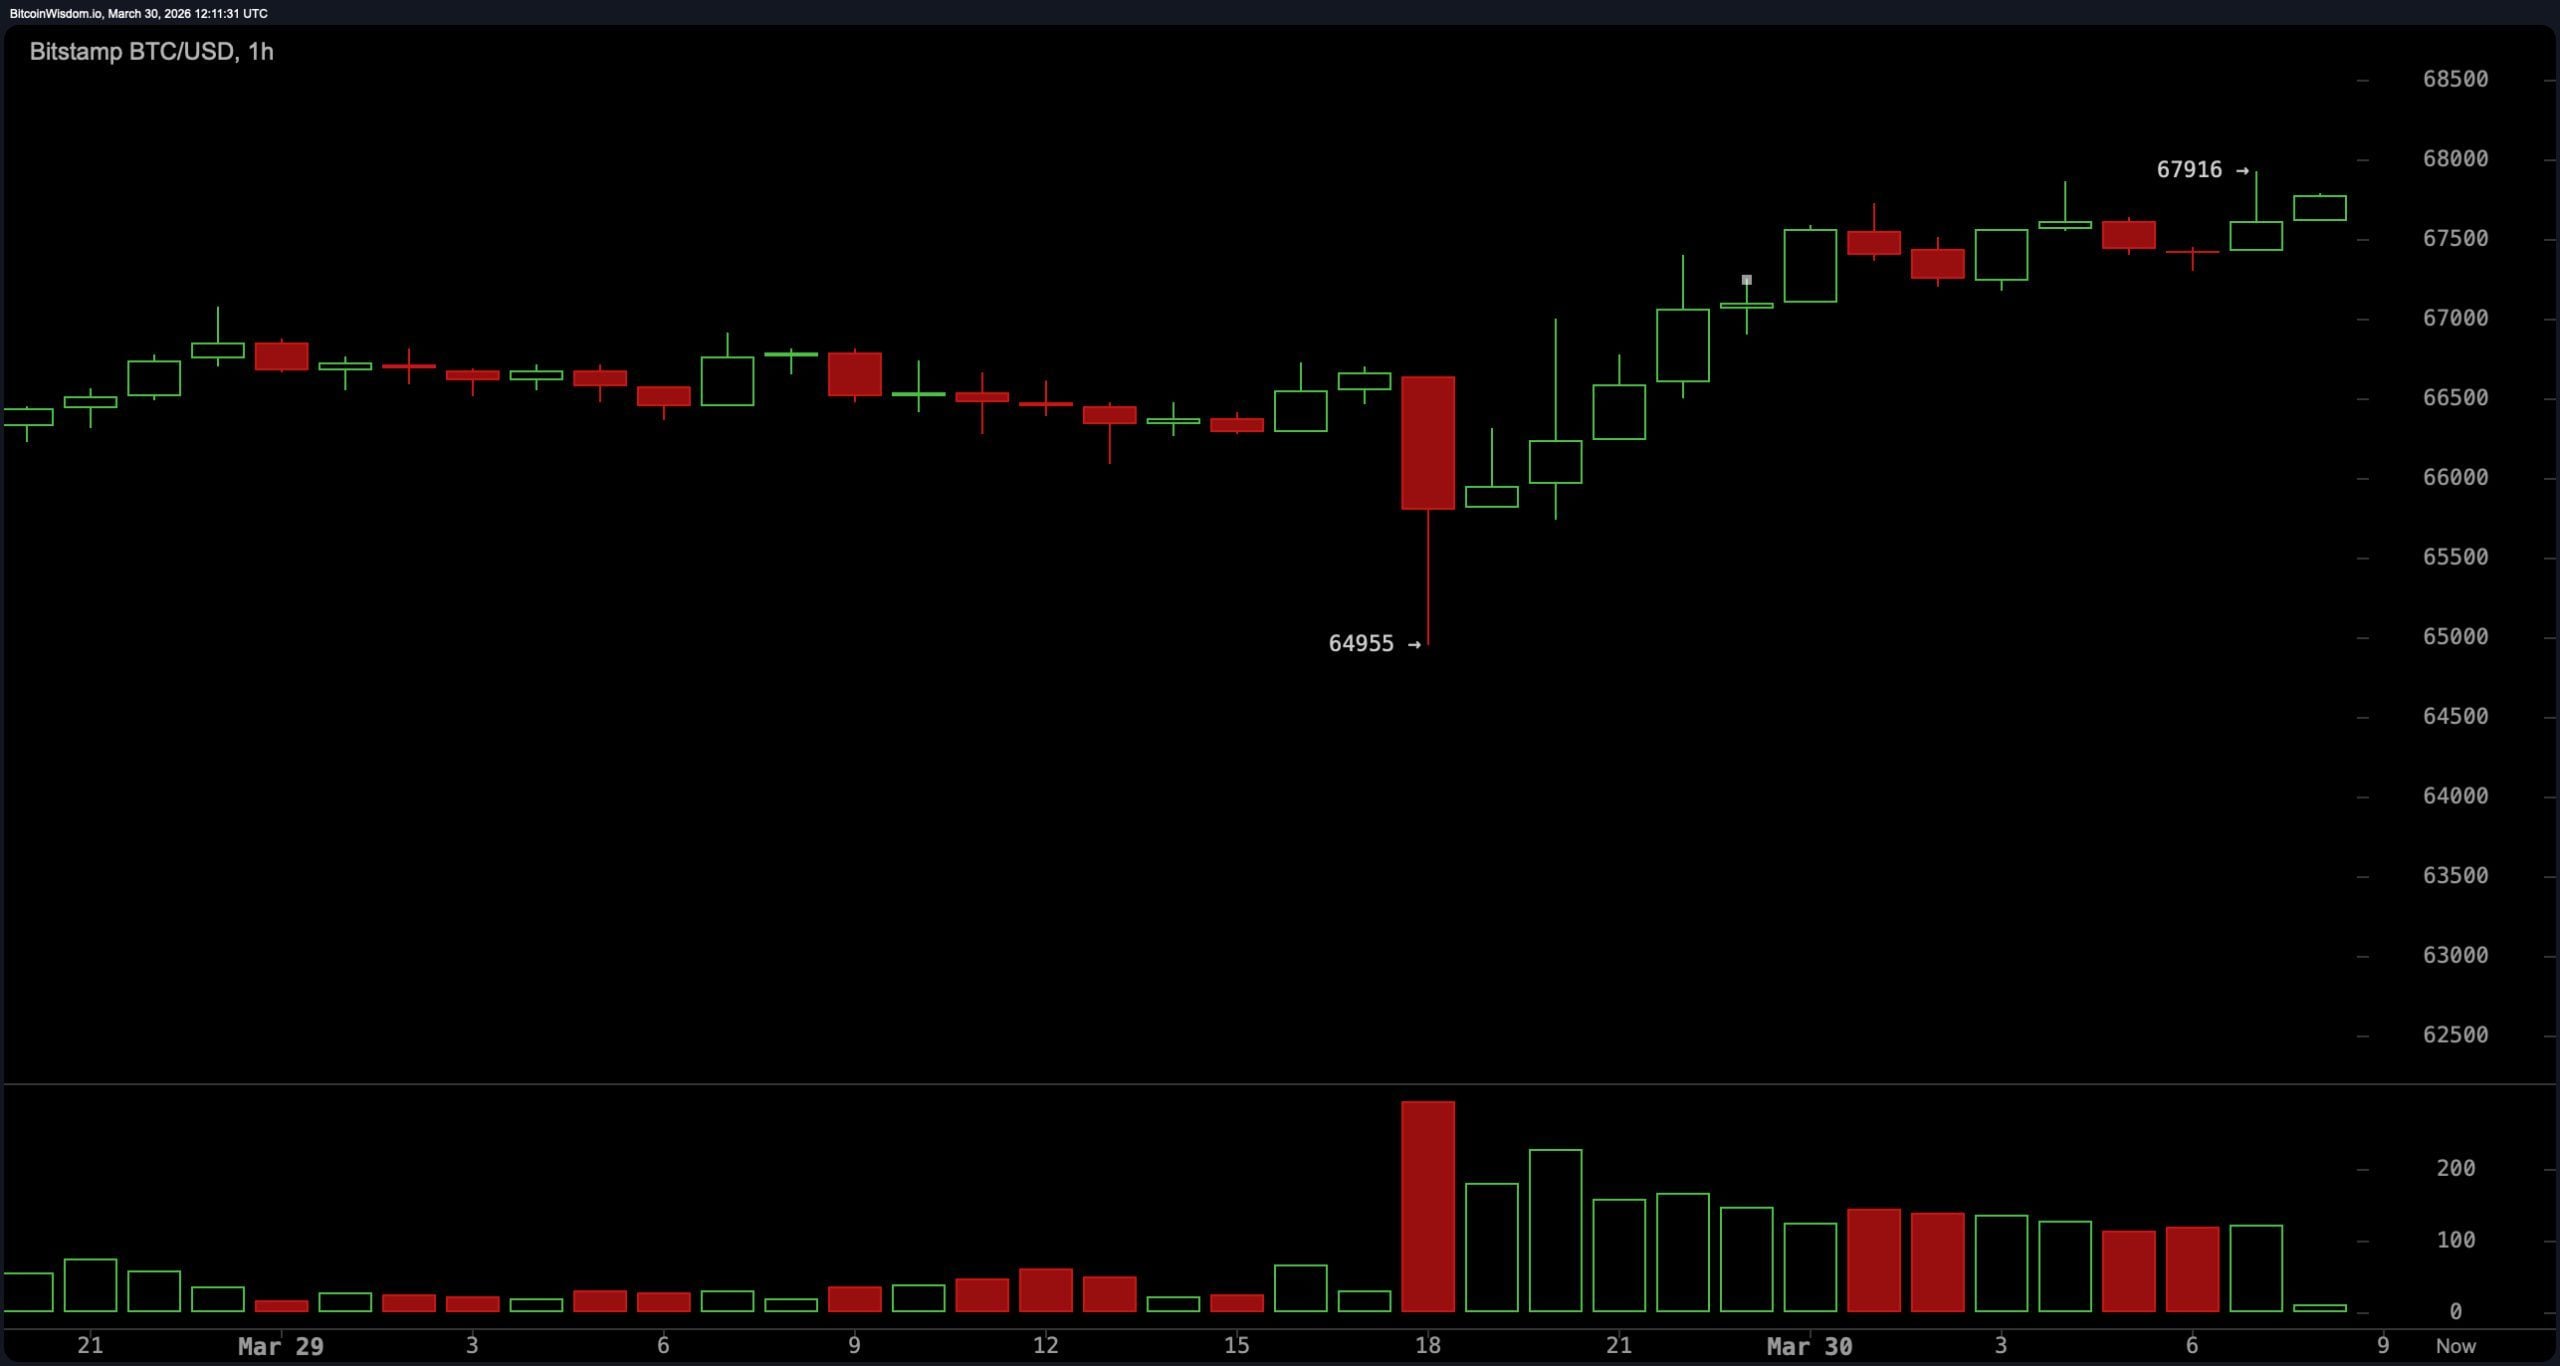
Zooming into the 1-hour bitcoin chart, short-term momentum has been notably stronger, characterized by higher highs and higher lows following a push from roughly $65,000 toward the upper $67,000s. However, momentum appears to be slowing as price approaches the $67,500 to $68,000 region, where minor exhaustion signals are emerging. The tight intraday range between approximately $66,265 and $66,312 reinforces the idea of consolidation, suggesting the market is catching its breath rather than launching into a fresh directional move.
Oscillators present a mixed, slightly conflicted picture that aligns with the broader “wait-and-see” tone. The relative strength index ( RSI) sits at 45, firmly in neutral territory, while the Stochastic oscillator at 14 and the commodity channel index (CCI) at −118 both lean toward upward pressure.
Momentum (10) also points higher, yet the moving average convergence divergence ( MACD) remains negative at −807, offsetting bullish signals. The average directional index (ADX) at 17 confirms weak trend strength, reinforcing the idea that this market is drifting rather than trending.
Moving averages (MAs), meanwhile, are about as encouraging as a rainy beach vacation. Across the board, exponential moving averages (EMA) and simple moving averages (SMA) signal downside pressure, with price trading below nearly every key level: the 10 EMA at $68,252 and 10 SMA at $68,450, the 20 EMA at $69,009 and 20 SMA at $70,035, and extending all the way to the 200 EMA at $85,289 and 200 SMA at $90,829.
This uniform positioning underscores a broader bearish bias in trend structure, even as short-term price action attempts to stabilize. Until price reclaims at least a portion of these averages, rallies may continue to look more like reactions than regime changes.
Bull Verdict:
As a researcher, I’m observing some encouraging signs of upward momentum on shorter-term charts. Indicators like stochastic, CCI, and momentum are all confirming this potential shift, and the price is currently holding above a key support level around $65,000. If we see a decisive break above the $68,500 to $70,000 range, it could suggest that this period of sideways movement is ending and a larger recovery is beginning.
Bear Verdict:
The higher-timeframe trend remains under pressure, with bitcoin trading below all major exponential moving averages (EMA) and simple moving averages (SMA), while the moving average convergence divergence ( MACD) stays negative and trend strength remains weak. Failure to reclaim $70,000 alongside a breakdown below $65,000 would reinforce the existing lower-high structure and suggest continuation of the broader corrective phase.
FAQ 🔎
- Why did bitcoin rise on March 30, 2026? Bitcoin moved higher after Donald Trump signaled potential Iran negotiations while threatening oil infrastructure, boosting risk assets.
- What is bitcoin’s current price and range? Bitcoin is trading near $67,625 within a 24-hour range of $65,112 to $67,777, reflecting ongoing consolidation.
- What do bitcoin technical indicators show right now? Indicators are mixed, with RSI neutral, MACD negative, and stochastic and CCI suggesting short-term upward pressure.
- Is bitcoin trending up or down? Bitcoin remains range-bound with a slight bearish bias on higher timeframes despite short-term recovery signals.
Read More
- All Shadow Armor Locations in Crimson Desert
- Dark Marksman Armor Locations in Crimson Desert
- Jujutsu Kaisen Season 3 Episode 12 Release Date
- How to Get the Sunset Reed Armor Set and Hollow Visage Sword in Crimson Desert
- Best Bows in Crimson Desert
- Wings of Iron Walkthrough in Crimson Desert
- All Golden Greed Armor Locations in Crimson Desert
- How To Beat Ator Archon of Antumbra In Crimson Desert
- Keeping AI Agents on Track: A New Approach to Reliable Action
- Top 5 Militaristic Civs in Civilization 7
2026-03-30 15:59