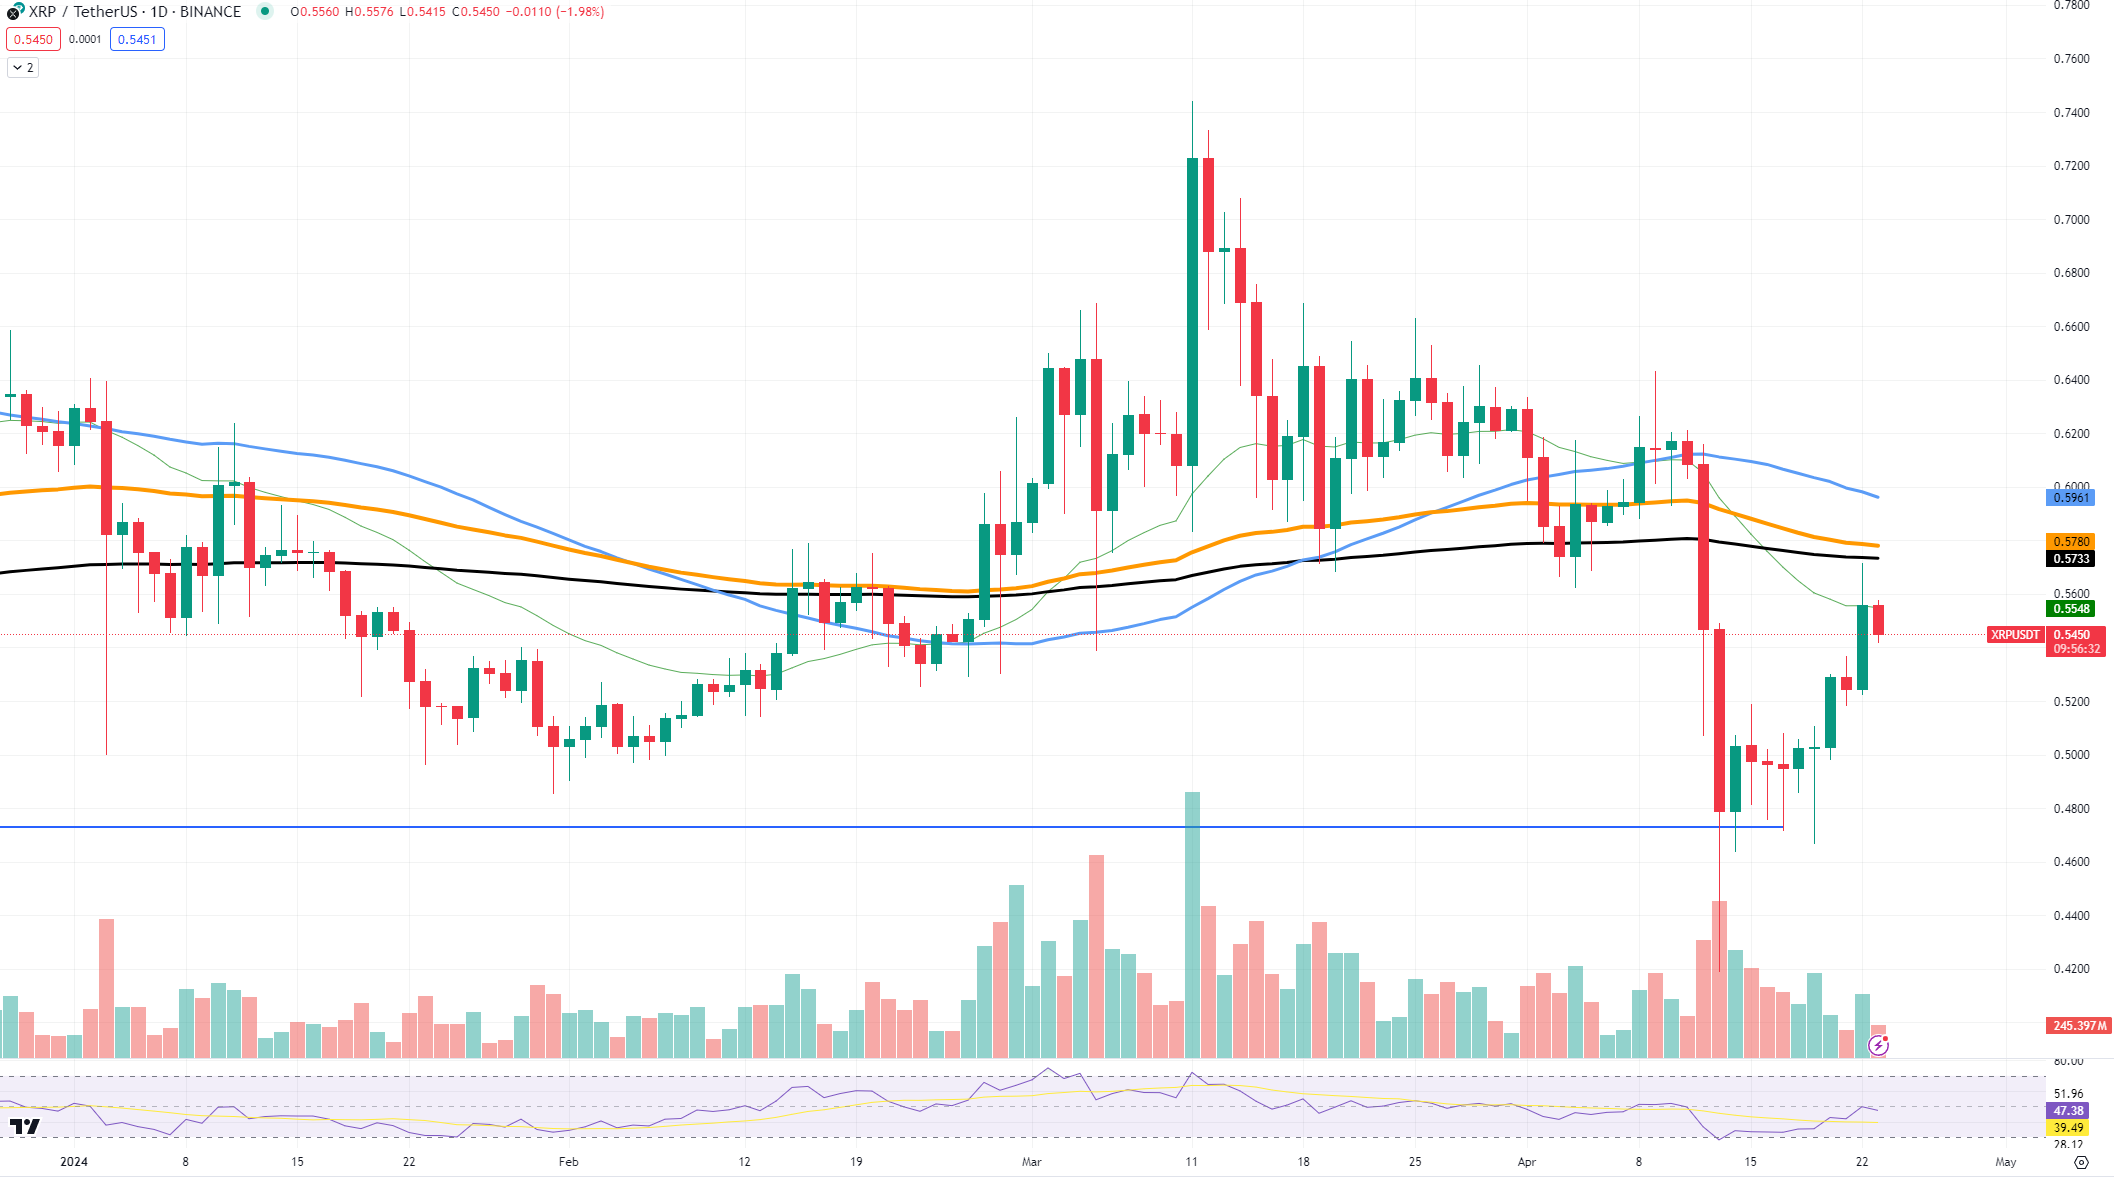
XRP has been making an effort to break past the resistance at $0.57, but hasn’t managed to do so yet. There was a strong surge in price, rising by approximately 16% from its recent low. It aimed to reach the 200-day moving average, but the current demand failed to carry it through.
Despite briefly surpassing the mentioned threshold represented by the green line on the chart (26-day EMA for XRP), it was unable to sustain that position.

In spite of recent setbacks, XRP has outperformed several other cryptocurrencies, surging over 6% and peaking at $0.57. The excitement stems from a noticeable increase in large XRP holders. Over the past six weeks, this figure has grown by 3.1%, nearing an all-time high for significant wallets.
When discussing potential future directions for XRP, it’s essential to consider significant levels. A supportive level exists around $0.55, where the price tends to bounce back due to its proximity to a cushion. However, for substantial growth, we focus our attention on the $0.57 resistance, which intersects with the 200 Exponential Moving Average (EMA). Breaking above this threshold could serve as an optimistic sign, potentially triggering further price increases. Nevertheless, conquering that hurdle remains a formidable challenge at present.
Shiba Inu under pressure
Shiba Inu is currently at a significant point on the price graph. The token has been consistently exchanging hands near the $0.000028 value, with intentions of surpassing the 50-day moving average. This important mark could dictate its future trend.
Shib is currently sandwiched between two significant moving averages, the 50 and 26 EMAs. In this tight range, it’s undecided which way to trend next. The increasing trading activity suggests an imminent increase in market swings.
Moving forward, the significant aspect to consider is whether SHIB can surpass its 50-day moving average (50 EMA). If it does, we may witness a sharp increase in price. Conversely, if there’s a downturn, the cryptocurrency could find some support around $0.000022 and potentially pause for a while.
If the trading activity continues to increase subtly, it’s probable that the price will respond in some way. Will the price surge past resistance or encounter setbacks and require a bounce back? The answer depends on the market conditions and the unfolding events within the cryptocurrency sphere.
Solana stays strong
Solana’s price has surpassed $150, marking a significant achievement. Yet, there’s a small hitch: the moving average over the past 26 days is proving to be a tenacious barrier that Solana finds hard to overcome.
With SOL inching up towards $150, the 26-day moving average acts as a hurdle, implying potential bumps in the road ahead. Simultaneously, the trading volume for SOL has been trending downwards.
A concern arises when trading volumes are large, as this could signal robust backing for the current price. Conversely, minimal trading activity may suggest insufficient demand or pressure to sustain a rally or drive prices upward.
Based on the data, the significant resistance level to focus on is approximately $160, where the 26-day moving average (EMA) is currently situated. If Solana (SOL) can surpass this barrier, it could potentially lead to substantial growth. However, if it falls short, there’s a possibility of a decline towards the support at around $139. This level has historically provided Solana with a solid base for recuperation.
If there’s sufficient market excitement for SOL to surmount its current resistance level, we may witness an uptrend. However, should it fall short, the result could be extended stagnation or even a fresh decline, which could pose challenges for the cryptocurrency.
Read More
- LUNC PREDICTION. LUNC cryptocurrency
- BTC PREDICTION. BTC cryptocurrency
- SOL PREDICTION. SOL cryptocurrency
- USD COP PREDICTION
- BICO PREDICTION. BICO cryptocurrency
- USD ZAR PREDICTION
- VANRY PREDICTION. VANRY cryptocurrency
- USD PHP PREDICTION
- USD CLP PREDICTION
- WQT PREDICTION. WQT cryptocurrency
2024-04-24 03:37