Ah, Bitcoin, the digital sphinx, perched precariously between $64,000 and $70,000, like a tightrope walker pondering whether to take the next step or simply plummet into the abyss. On March 2, 2026, it stood at $66,372, a market capitalization of $1.32 trillion, and a 24-hour trading volume of $45.14 billion-numbers that, like a Chekhov’s gun, promise drama but deliver only indecision.
Bitcoin Chart Outlook: A Symphony of Hesitation
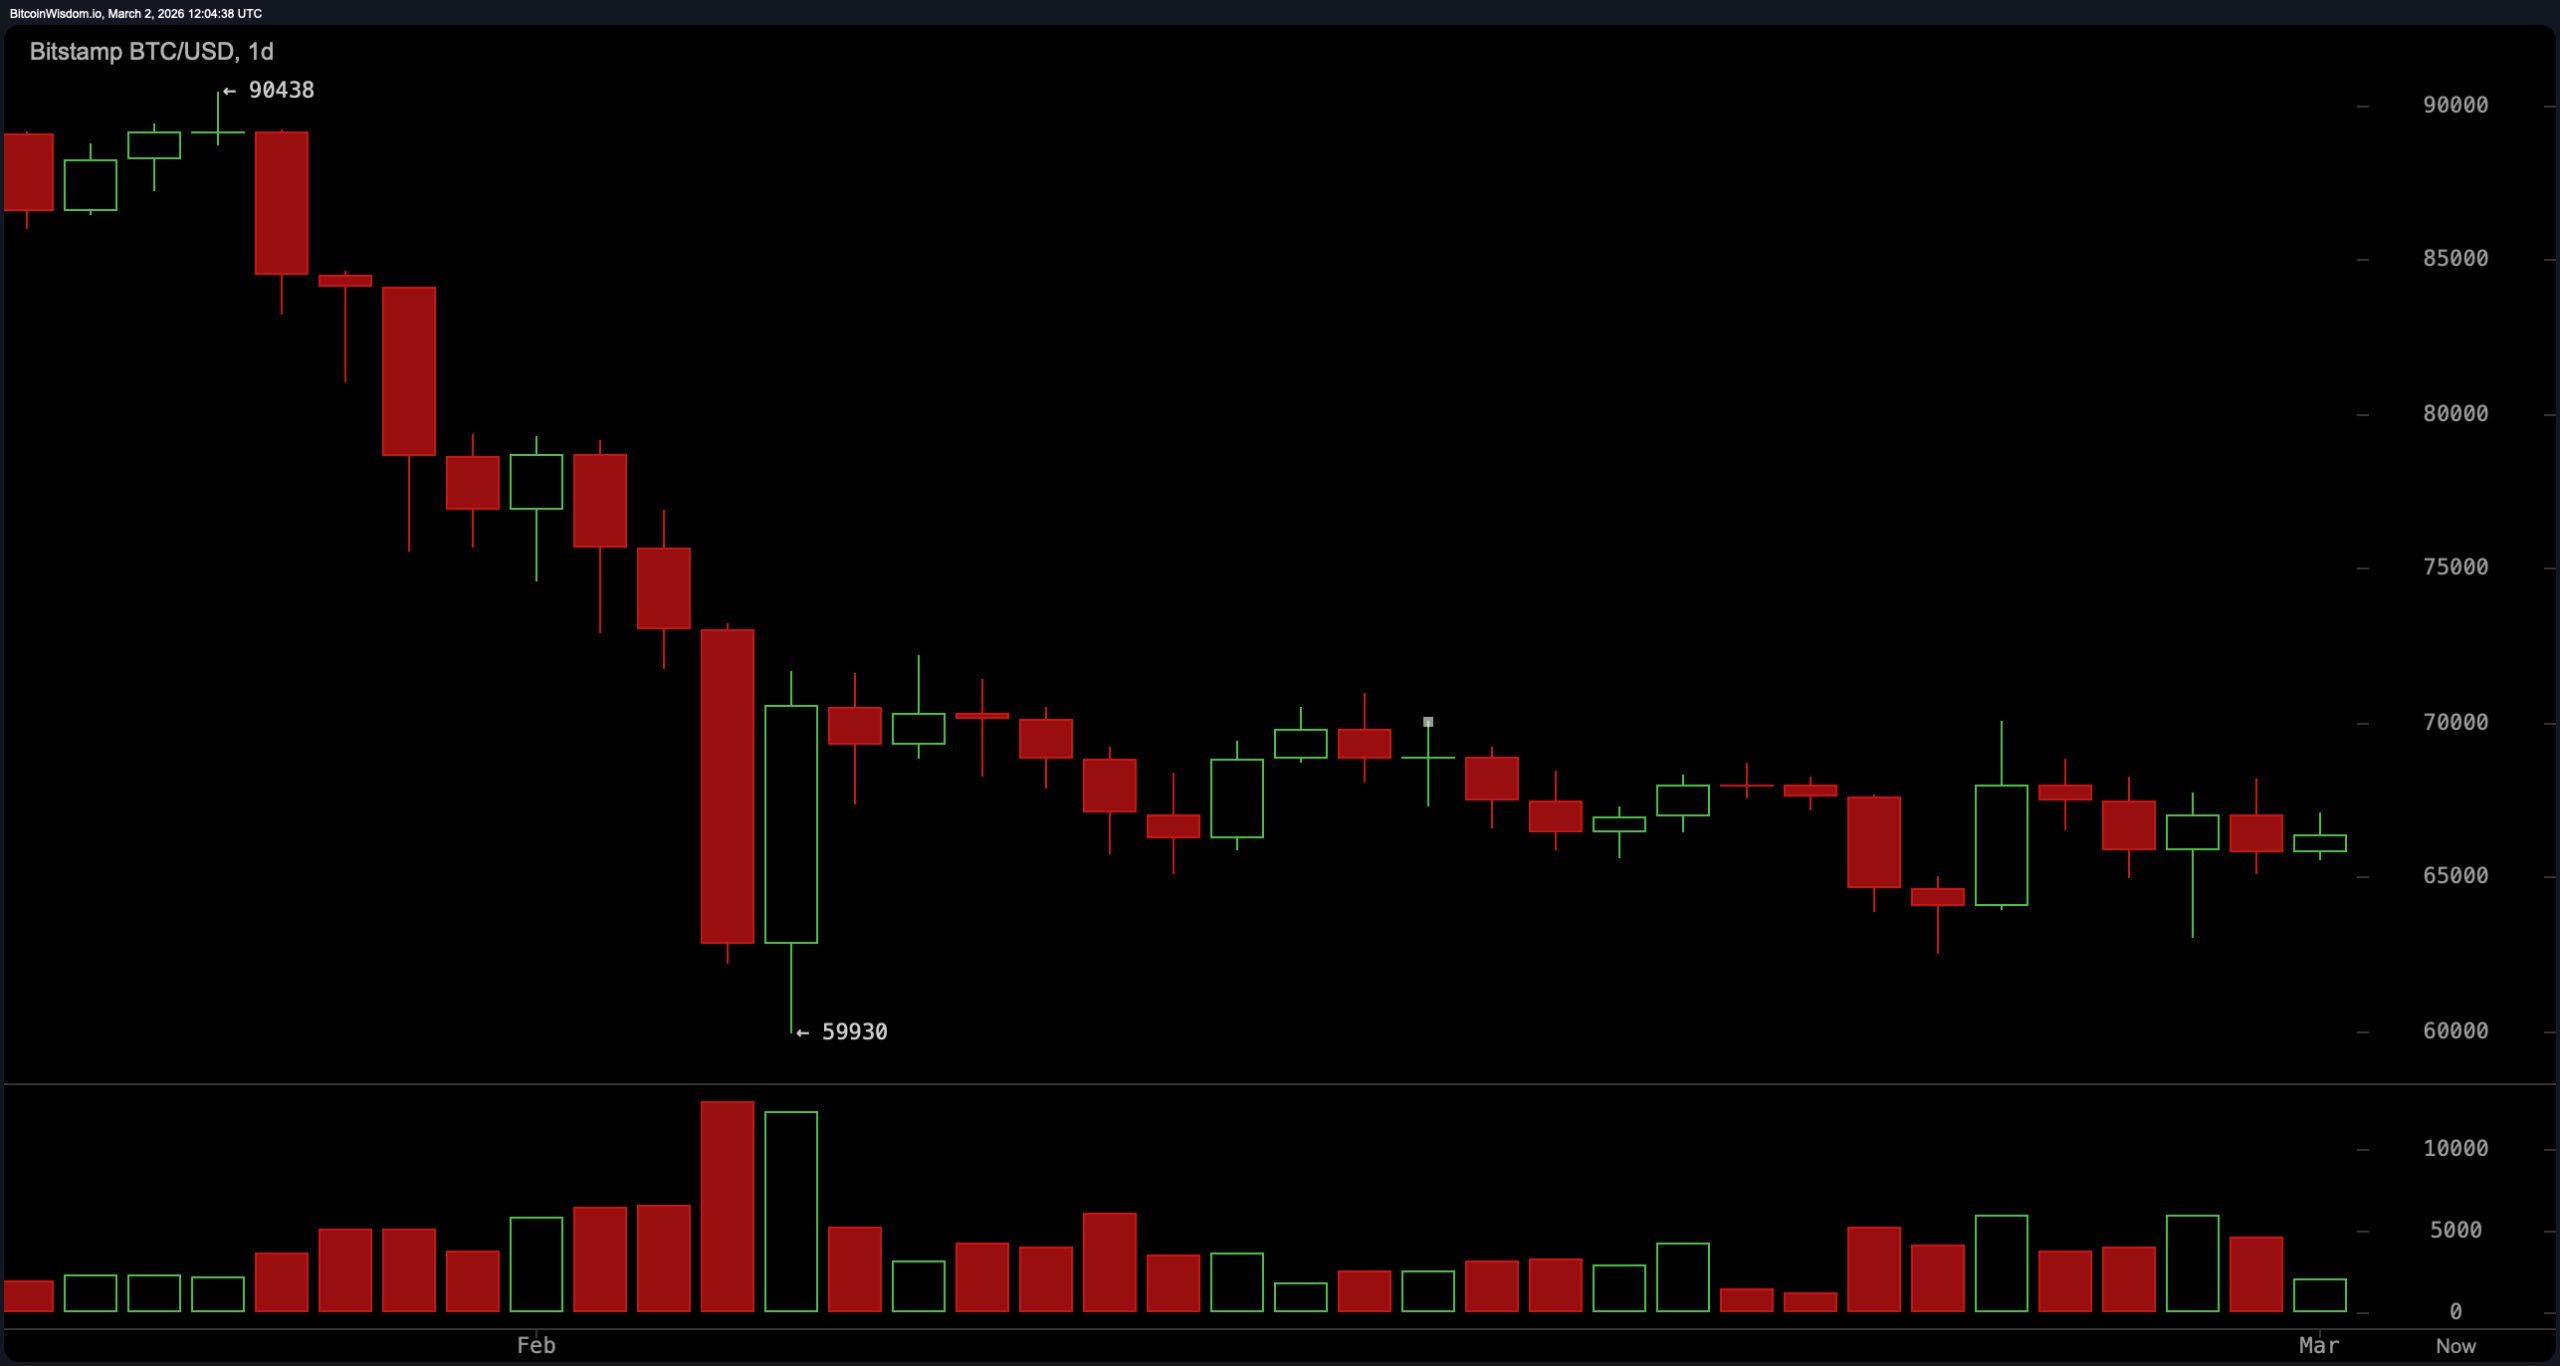
On the daily chart, Bitcoin’s corrective structure is as elegant as a Pasternak poem-rejected at $90,400, it tumbled to $59,900, only to find solace in a high-volume capitulation candle. Since then, it has meandered sideways, a digital Hamlet unable to decide whether to breach the $69,500 to $70,500 resistance band or retreat to the safety of $64,000. Key support? $64,500 to $65,000. Major support? $59,900 to $60,000. The market, it seems, is in a state of existential equilibrium.
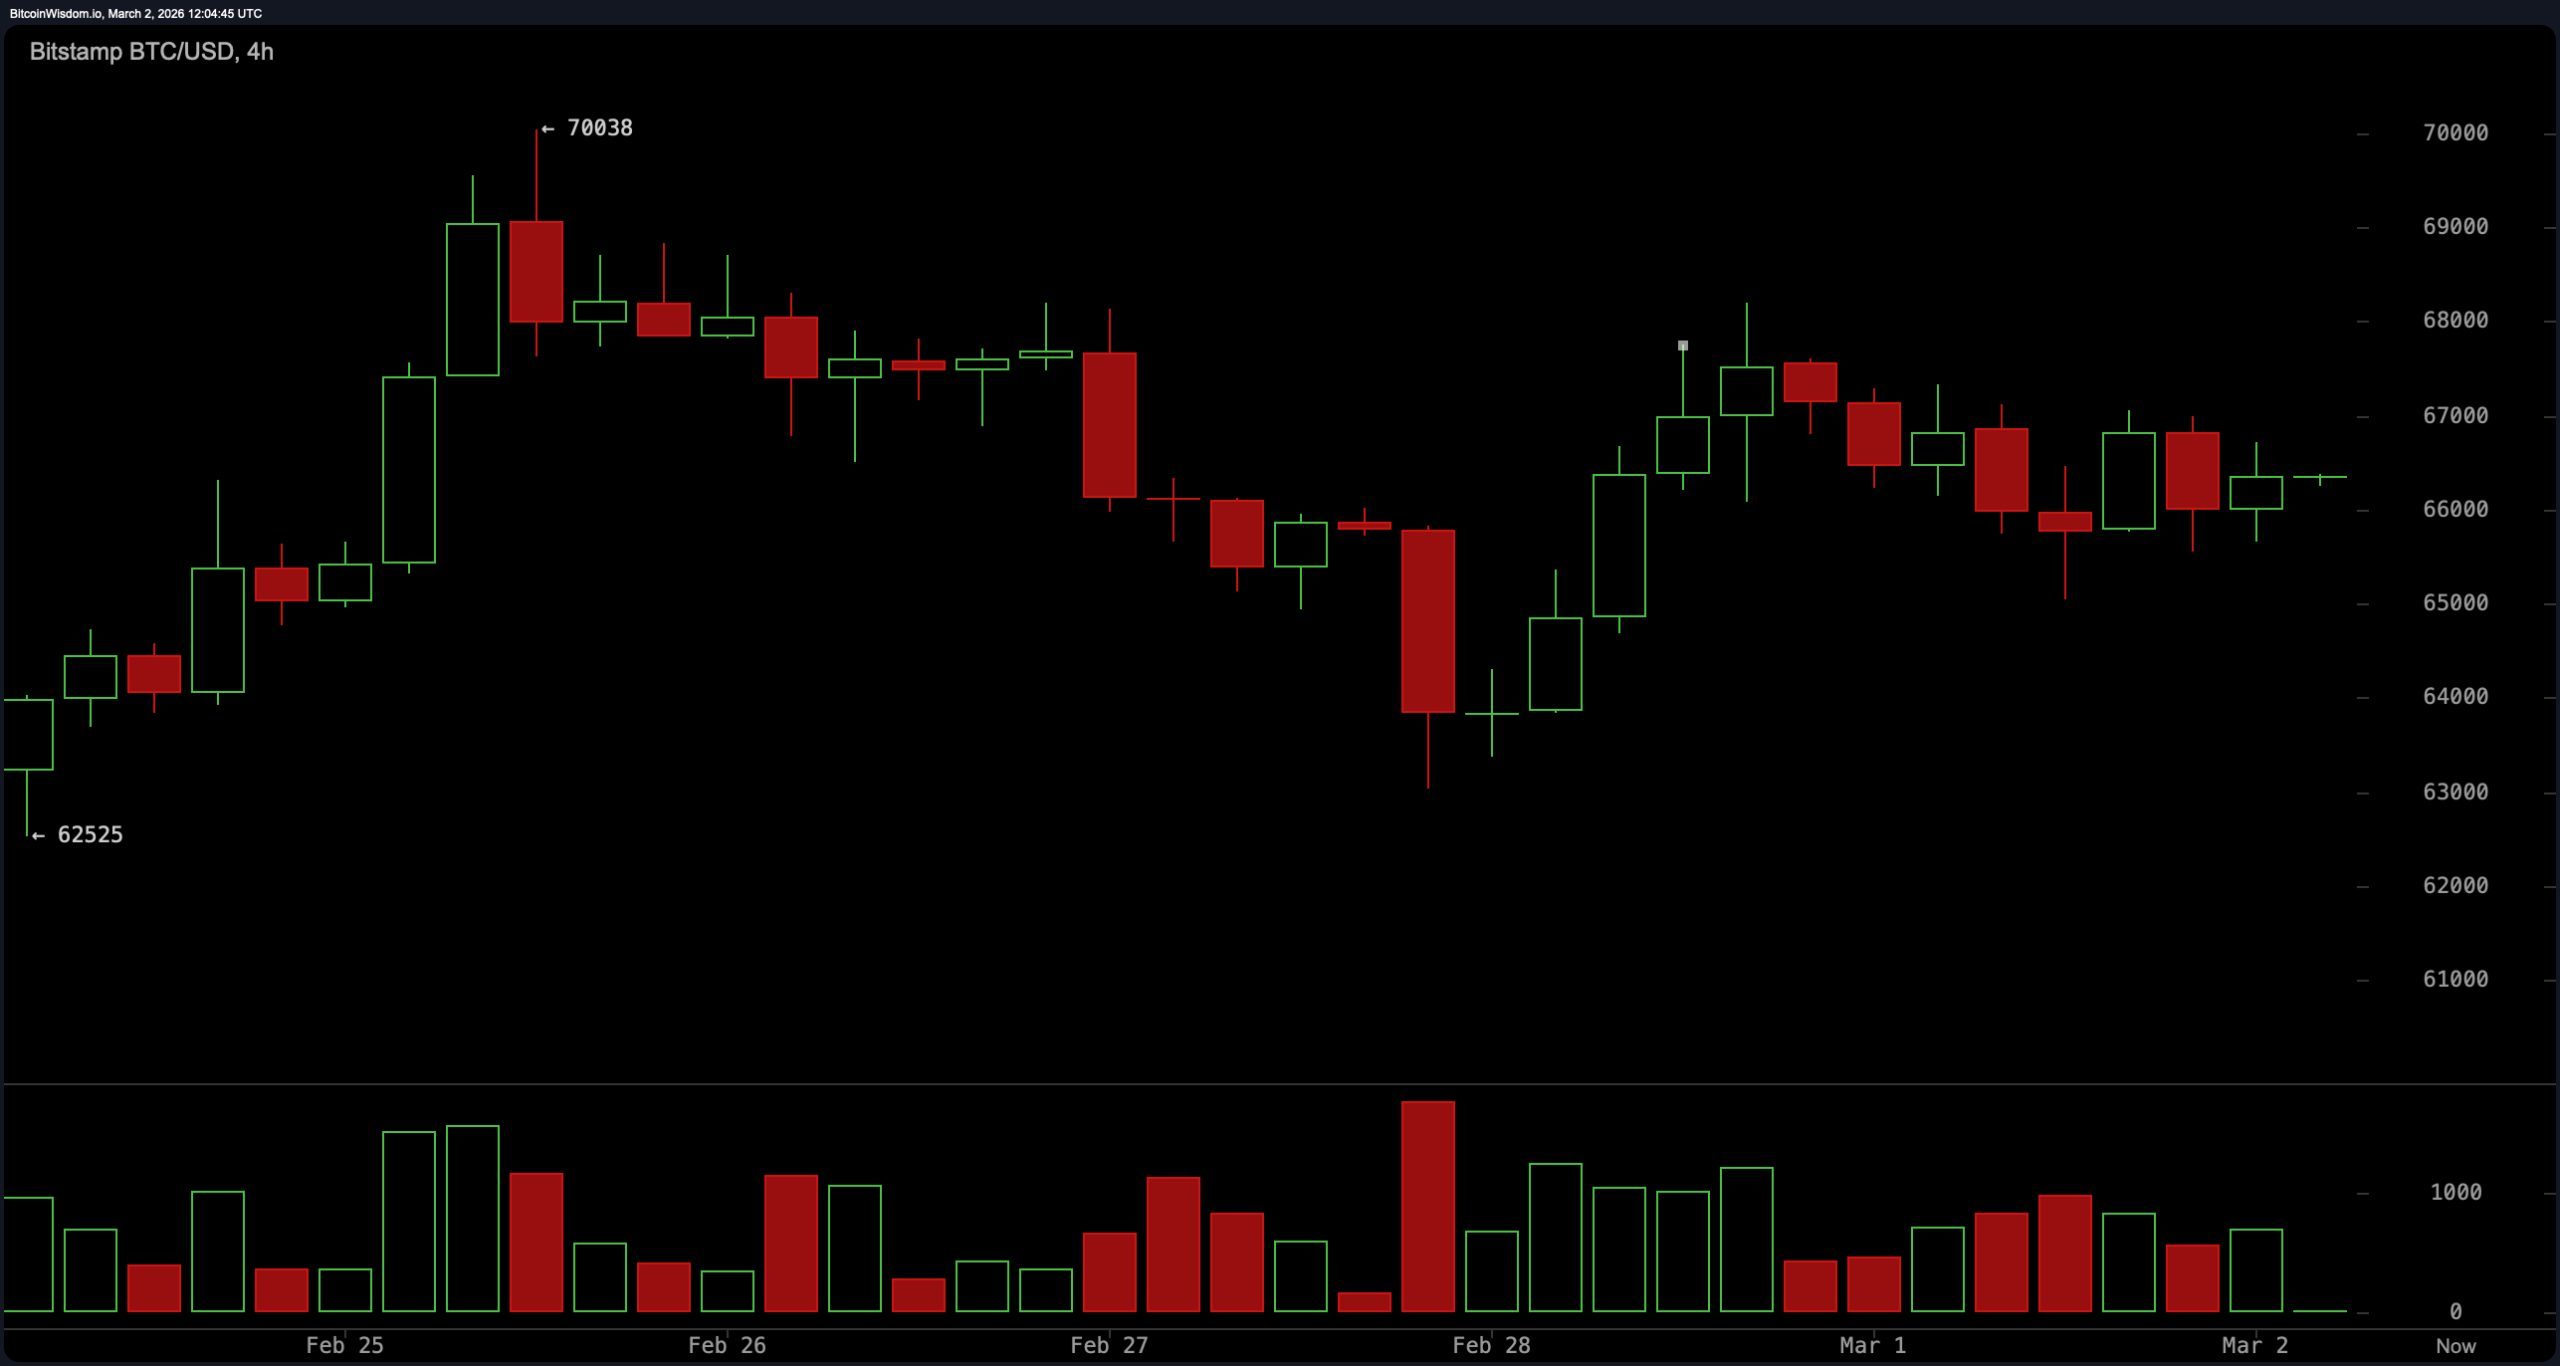
The four-hour chart? A farce. Price rebounds from $63,500, prints a lower high near $68,000, and compresses between $65,500 and $67,000. Volume? Expanded on the decline, contracted on the bounce-a recovery as convincing as a politician’s promise. Resistance at $67,800 to $68,000, support at $65,000. A close above $68,000 might open the path to $70,000, while a close below $65,000 could send it tumbling to $62,000. Neither bulls nor bears have seized control-a market in search of a spine.
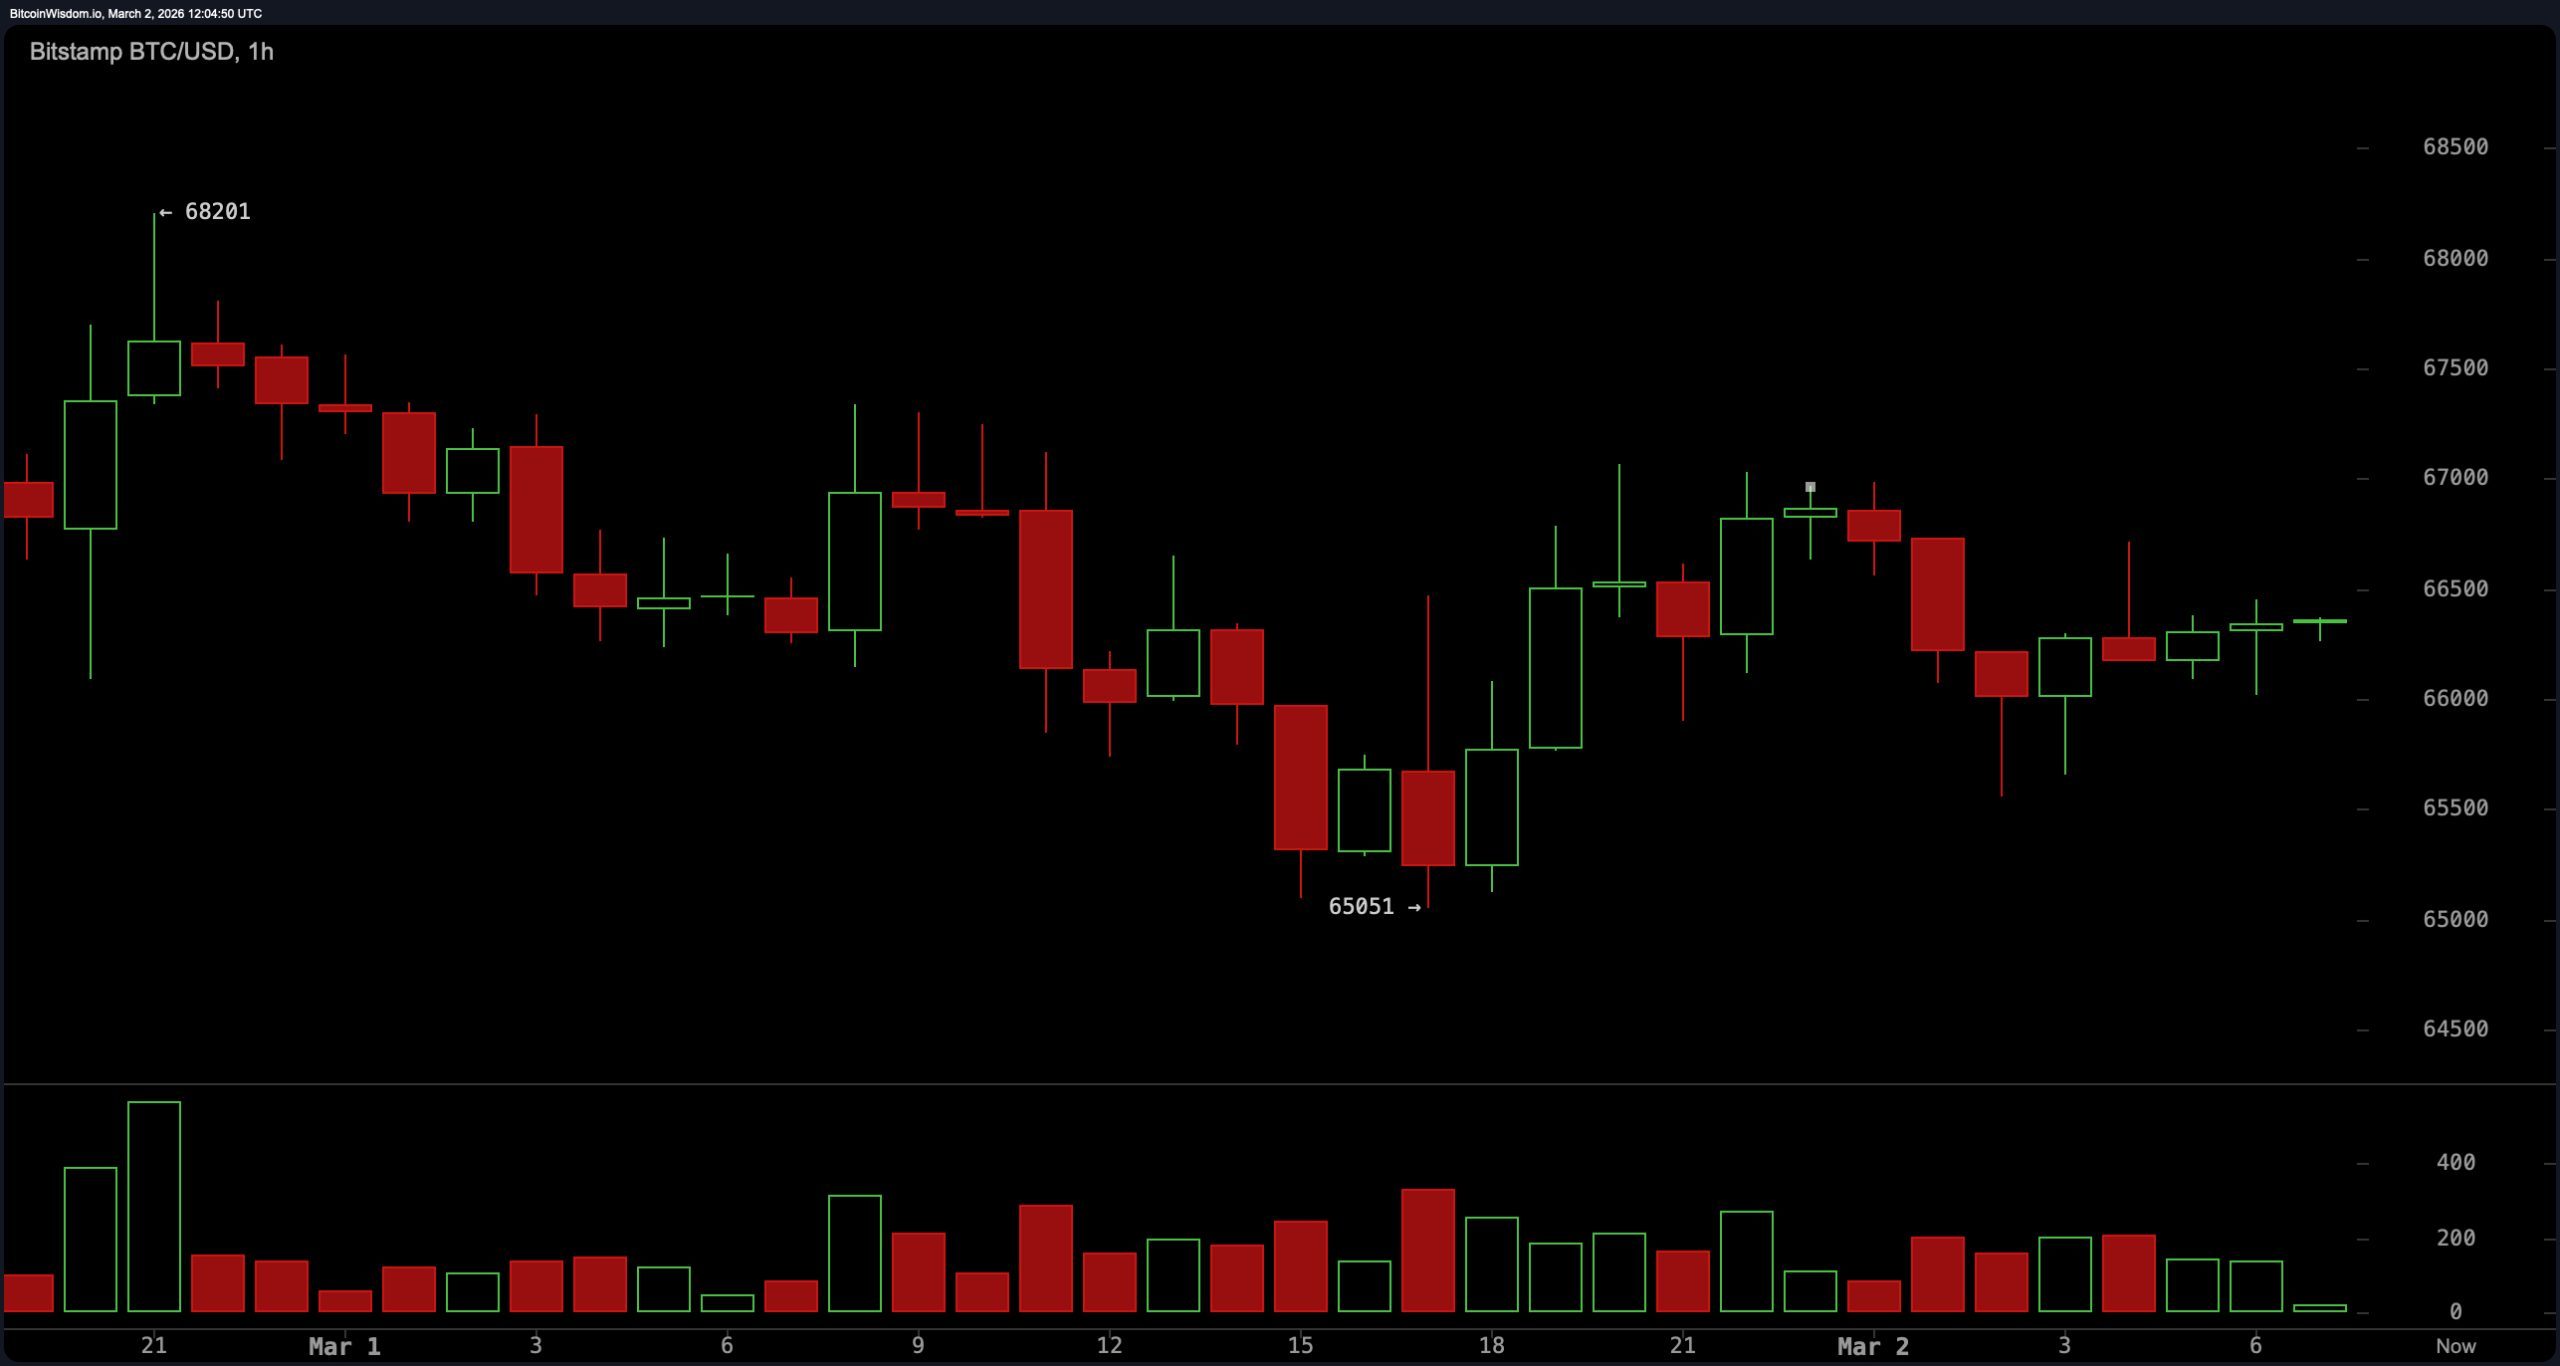
The one-hour chart? A microcosm of hope and despair. A double bottom near $65,000, a higher low at $65,500-a micro uptrend, perhaps. But resistance at $66,800 to $67,000 remains as stubborn as a mule. Momentum? Neutral to slightly bullish, like a lukewarm cup of tea. A breakdown below $64,800 on volume could trigger a swift move to $62,000 or even a retest of $60,000. For now, it’s constructive but capped-a prisoner of its own inertia.
Oscillators? A chorus of indecision. RSI at 41, Stochastic at 49, CCI at negative 56, ADX at 49-all neutral, like a room full of people too polite to voice an opinion. The Awesome Oscillator prints negative 4,041, while the MACD at negative 2,663 offers a buy signal. Momentum? Conflicted. Hardly the stuff of legends.
Moving averages? Overhead, like a cloud of judgment. EMA (10) at $66,650, SMA (10) at $66,468, EMA (20) at $68,200, SMA (20) at $67,153-all signaling downside pressure. Higher timeframes? EMA (50) at $74,636, SMA (50) at $77,222, EMA (100) at $82,362, SMA (100) at $83,363, EMA (200) at $90,306, SMA (200) at $96,821. A stacked resistance that would make Sisyphus weep.
Until Bitcoin reclaims these levels, the technical posture remains corrective. A range trader’s paradise-orderly, compressed, and quietly daring someone to make the first move. Will it break or just fake? Only time will tell.
Bull Verdict: The Optimist’s Delusion
If Bitcoin secures a break above $68,000 on the four-hour chart and clears $69,500 to $70,500 on the daily, the structure shifts from compression to expansion. A move beyond $70,000 would invalidate the lower highs and trigger momentum toward higher liquidity levels. The MACD already hints at a buy signal, though oscillators remain neutral. In this scenario, the range resolves upward, and the corrective phase transitions into a fresh impulsive leg. Hope springs eternal, does it not?
Bear Verdict: The Pessimist’s Triumph
Failure to reclaim $67,800 to $68,000, followed by a breakdown below $65,000-especially a loss of $64,800 on volume-would reinforce the corrective structure. With all major moving averages overhead, downside continuation toward $63,500, $62,000, and potentially a retest of $59,900 to $60,000 becomes probable. Until Bitcoin reclaims $70,000, the trend bias remains structurally vulnerable. Reality, as always, bites.
FAQ 🔎
- What is Bitcoin’s price on March 2, 2026?
Bitcoin trades at $66,372, with a 24-hour range of $65,149 to $67,191. A price as stable as a house of cards. - Is Bitcoin bullish or bearish right now?
Bitcoin remains range-bound below $70,000, with overhead resistance from moving averages signaling macro pressure. A market in search of direction. - What are the key Bitcoin support and resistance levels?
Support at $64,500 to $65,000, resistance at $69,500 to $70,500. A tightrope between hope and despair. - What happens if Bitcoin breaks below $64,800?
A breakdown below $64,800 could open the door to $62,000 and potentially a retest of the $60,000 macro low. The abyss beckons.
Read More
- Robinhood’s $75M OpenAI Bet: Retail Access or Legal Minefield?
- Lonely Player Anomaly Commission Guide In NTE (Wandering Puppet Locations)
- All Skyblazer Armor Locations in Crimson Desert
- All Nameless Hospital Endings Full Guide In NTE
- All Hauntingham’s Letters & Hidden Page in New Super Lucky’s Tale
- How to Complete Funny Blocks Game in Infinity Nikki
- Change Your Perspective Anomaly Commission Guide In NTE (Neverness to Everness)
- Riven Tides Classified Records Keycard Door Location in ARC Raiders
- Black Sun Shield Location In Crimson Desert (Buried Treasure Quest)
- How to Catch All Itzaland Bugs in Infinity Nikki
2026-03-02 15:57