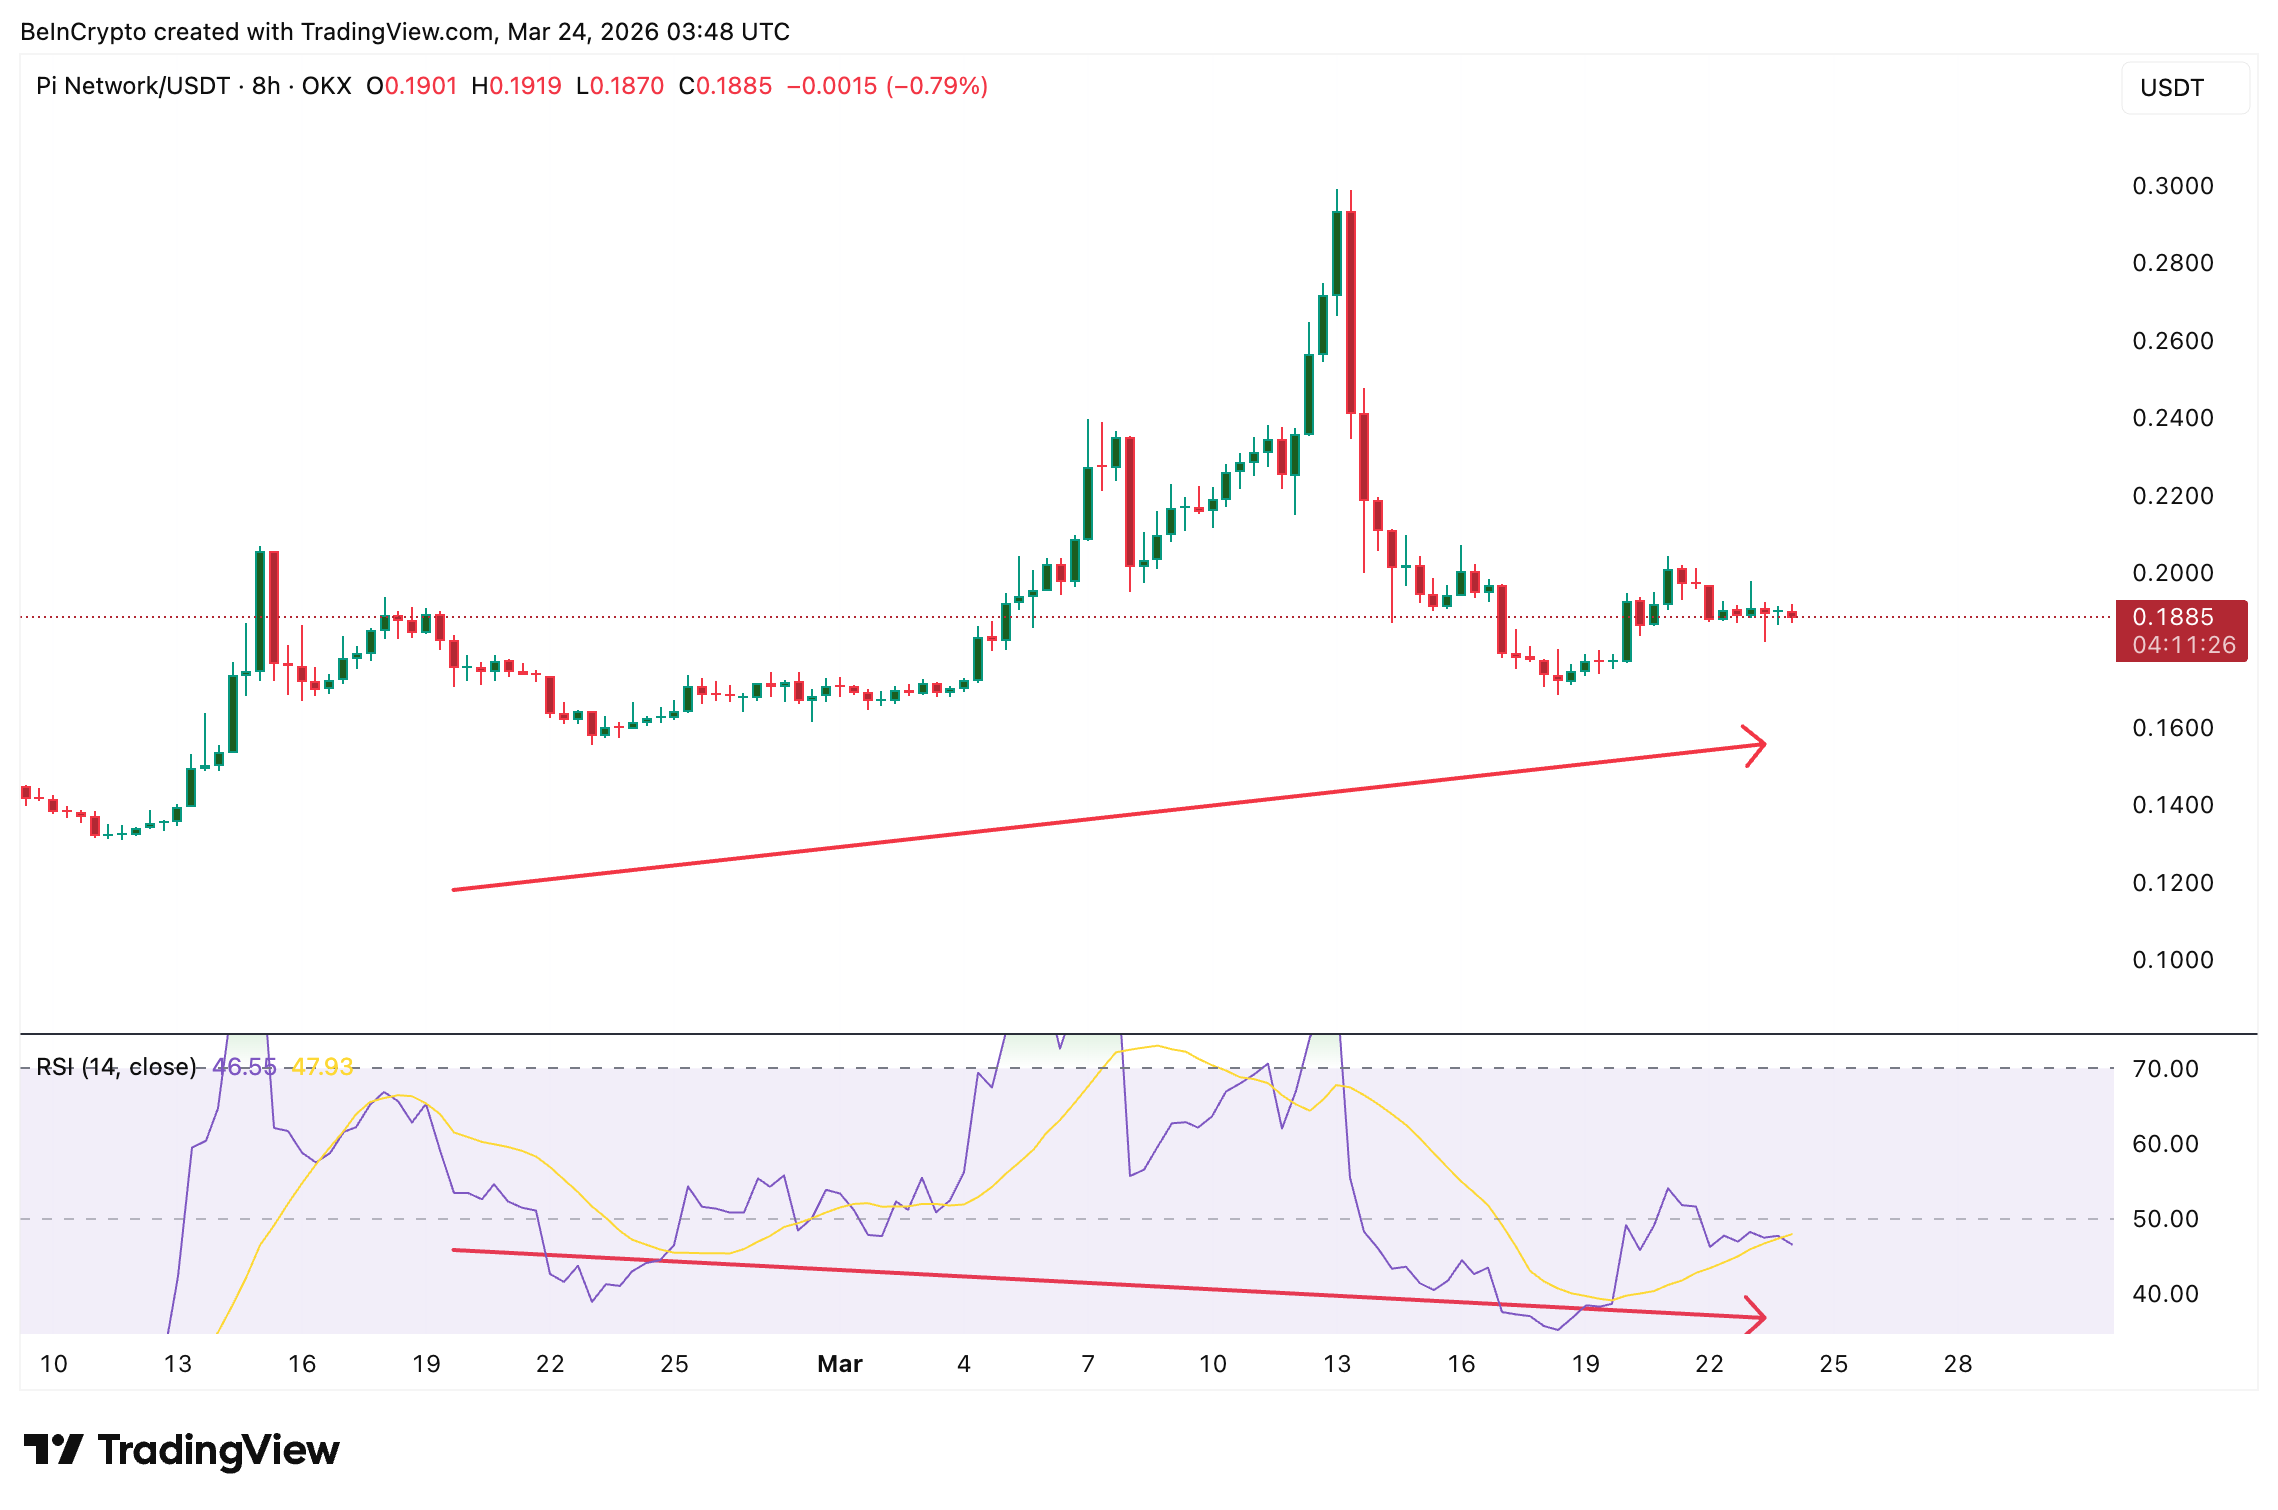
Pi Network (PI) is currently trading around $0.188, which is about 3% lower than yesterday. However, over the past month, the price has still increased by around 11.6%. Looking at an 8-hour chart, two distinct patterns are emerging that could indicate where the price is headed next.
The technical indicators suggest a possible price increase for Pi Coin. A weakening of selling pressure is observed, and a specific chart pattern hints at a potential 22% jump in price. However, our internal Pi Isolation and Shock Index suggests this increase might not happen right away. Currently, the price is at a key point – it needs to either confirm the predicted upward trend or continue to trade sideways.
Hidden Divergence and a Cup-and-Handle Build Together
Looking at the 8-hour chart on OKX, a bullish pattern is developing between February 19th and March 23rd. The price of PI actually went up to a higher low during this time, but the RSI, which measures how quickly prices are changing, went down to a lower low. This type of pattern, called a hidden bullish divergence, often means that selling is losing strength and the price is likely to continue moving up rather than reverse direction.
Interested in more crypto analysis? Subscribe to Editor Harsh Notariya’s daily newsletter here.
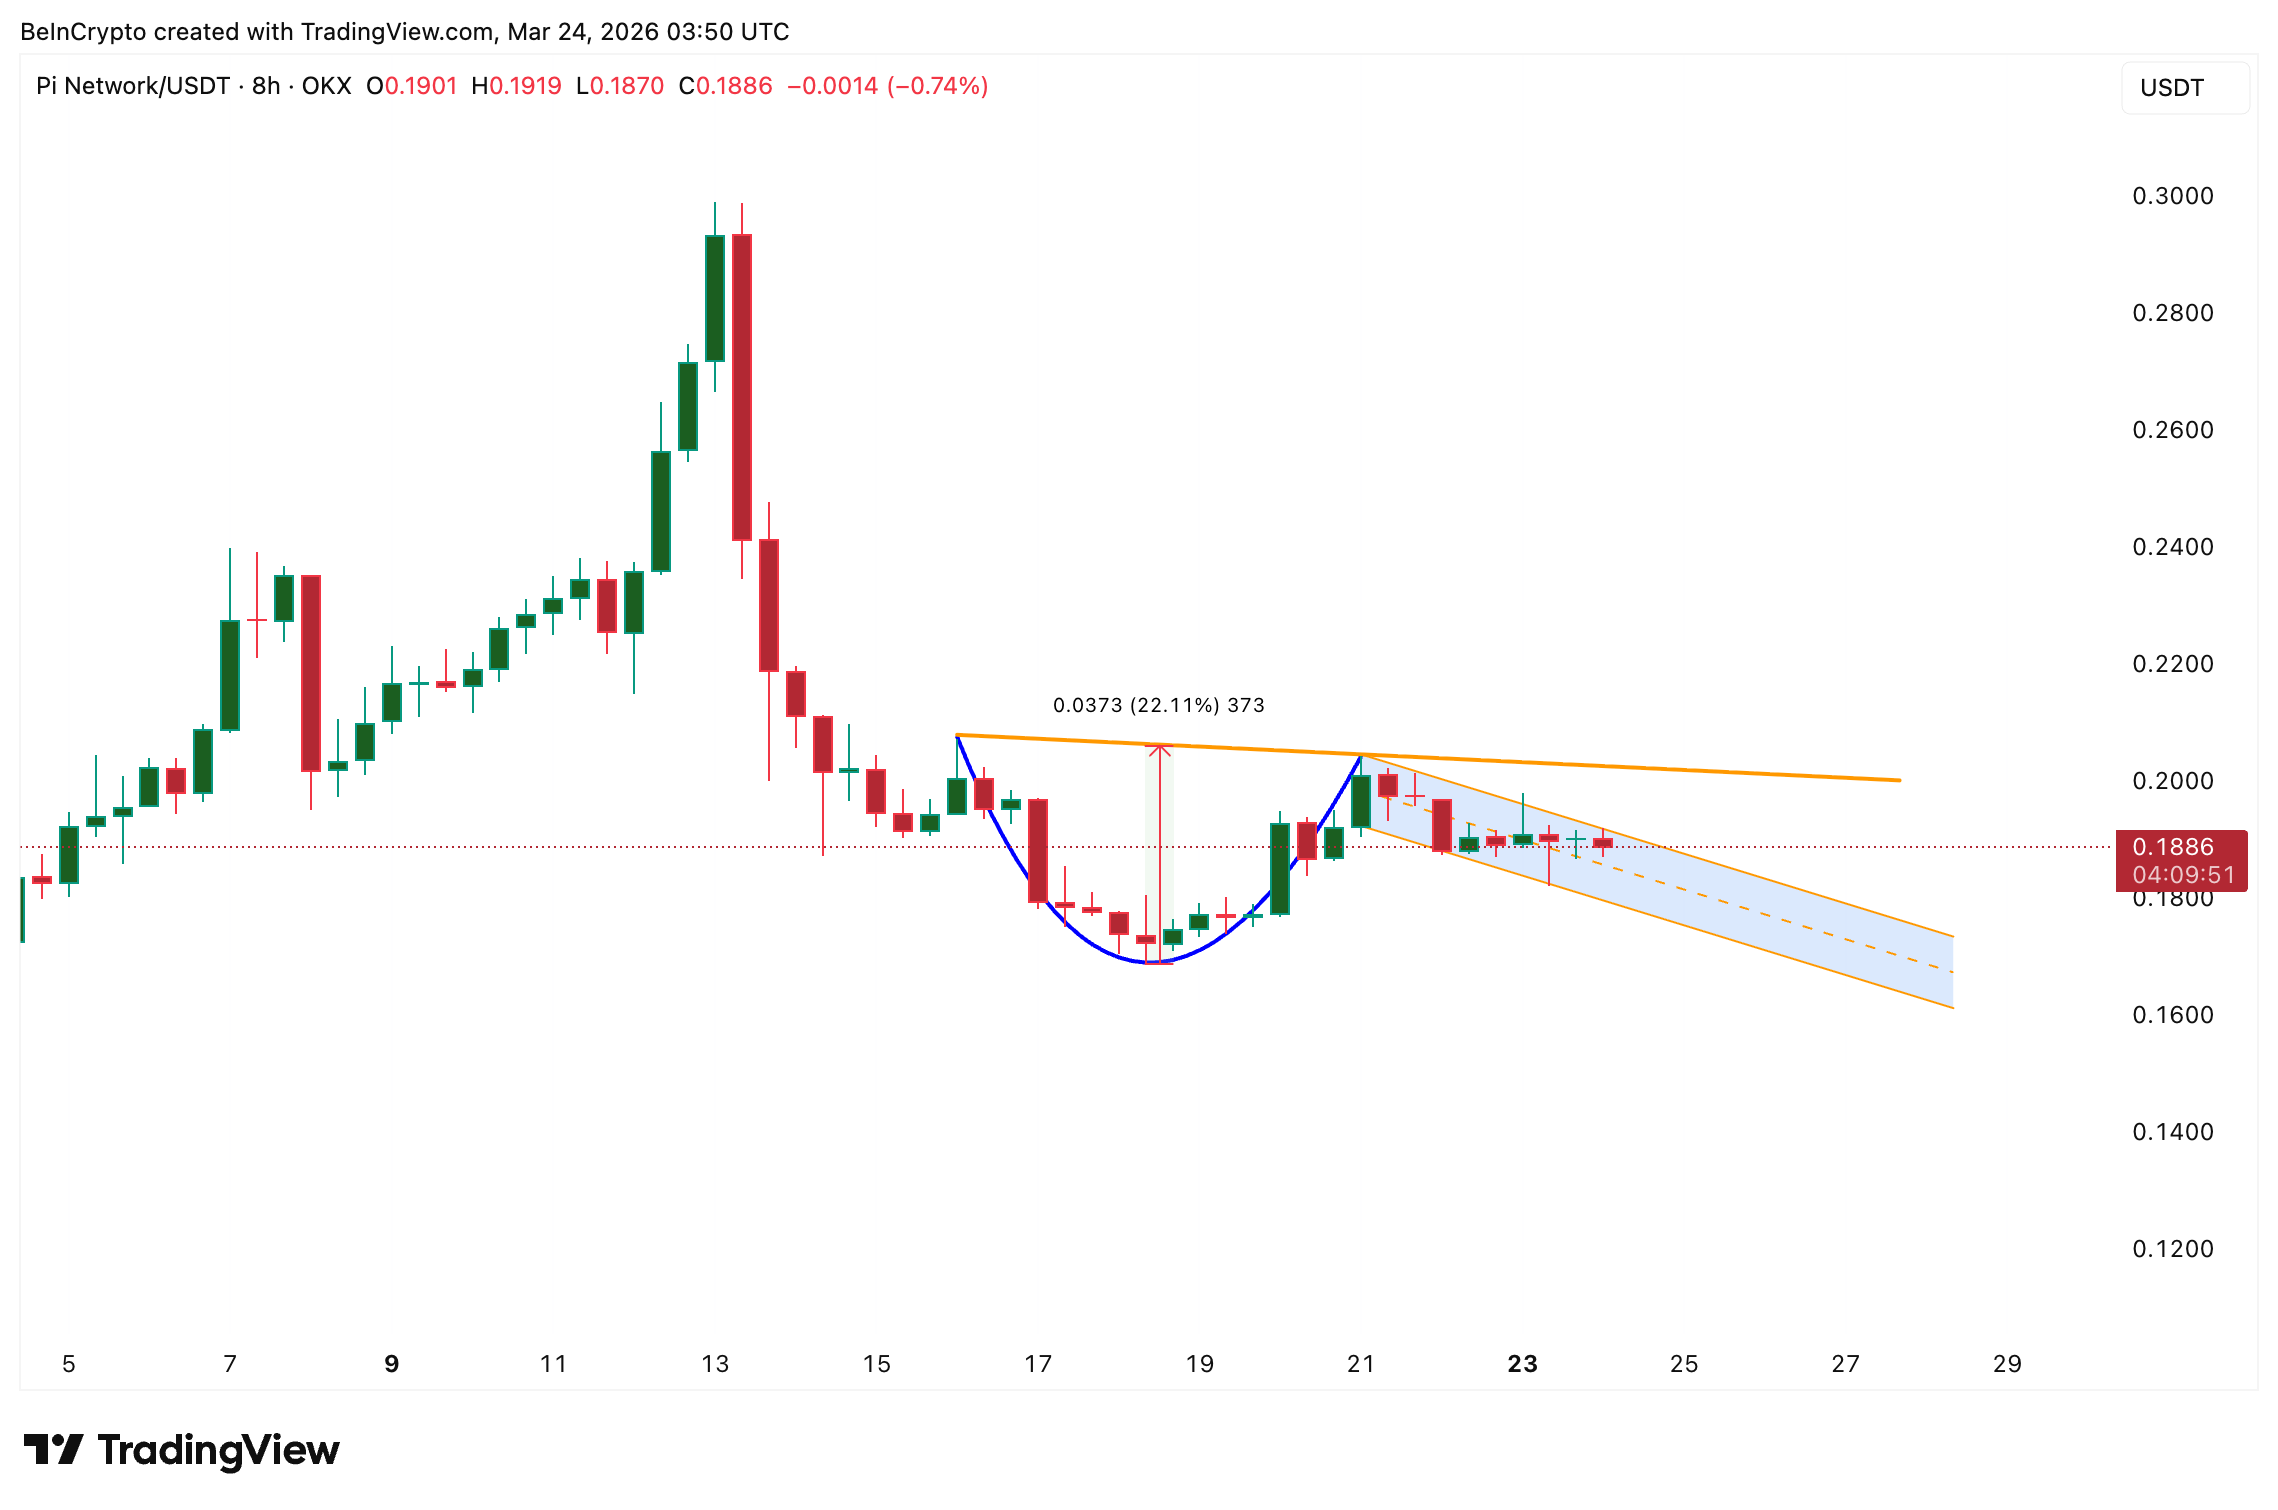
In addition to the recent RSI signals, a bullish cup-and-handle pattern has been developing since mid-March. The rounded base of the ‘cup’ formed between March 15th and 19th, and the price is currently stabilizing within the ‘handle’ portion of the pattern. If the price rises above the handle’s resistance level (the ‘neckline’), it could trigger a 22% price increase.
I’m seeing some promising signs for a potential price increase, but whether it actually happens, and *when*, really hinges on how the Pi Network token performs compared to the rest of the crypto market. That’s why I’m keeping a close eye on this specific index – it gives me a unique perspective on that relationship.
A Proprietary Index Says Wait, but Big Money Is Flowing In
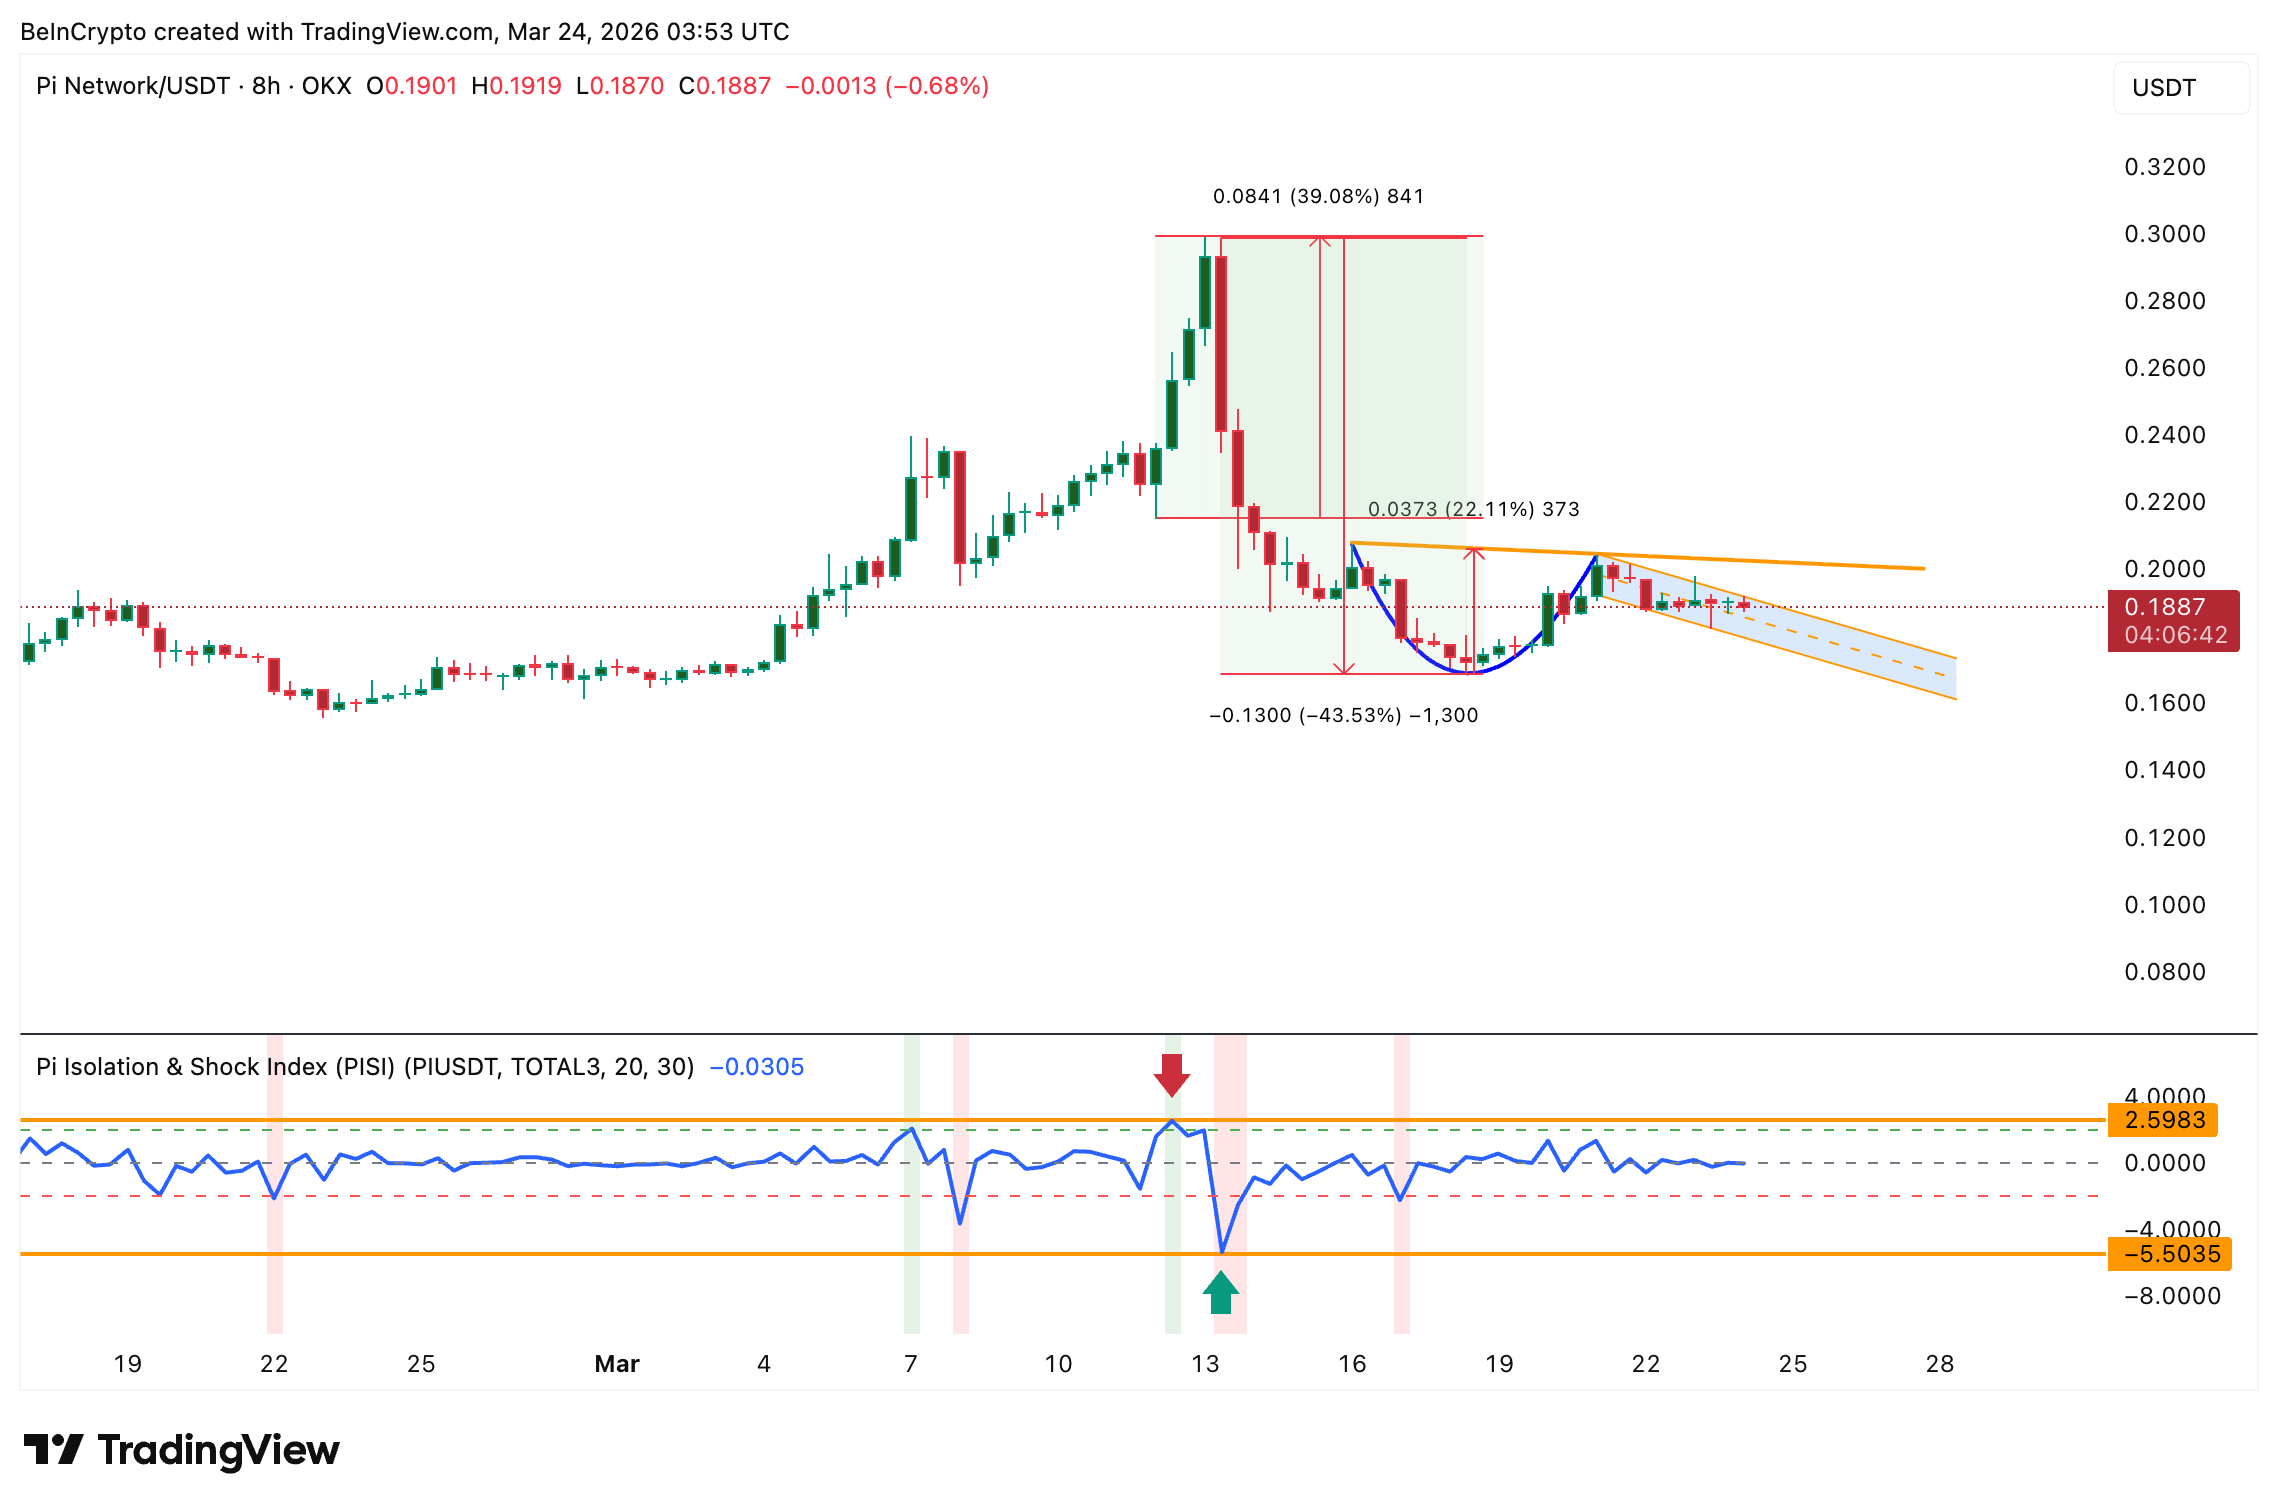
As part of my research, I’ve been tracking Pi’s performance using a custom indicator we call the Pi Isolation and Shock Index, or PISI. It’s a Z-score that essentially tells us how much Pi is moving on its own, separate from the rest of the altcoin market, which we represent with TOTAL3. Right now, the PISI is reading -0.03, which is very close to zero. This suggests Pi is behaving normally, without any significant independent upward or downward momentum.
The PISI indicator has accurately predicted price movements for this token in the past. For example, when the PISI rose sharply on March 12th, the token’s price increased by about 40%. And when the PISI dropped significantly on March 13th, the price fell around 43%. Currently, the PISI is showing a neutral reading, which suggests the price might stay stable for a while before making a larger move.
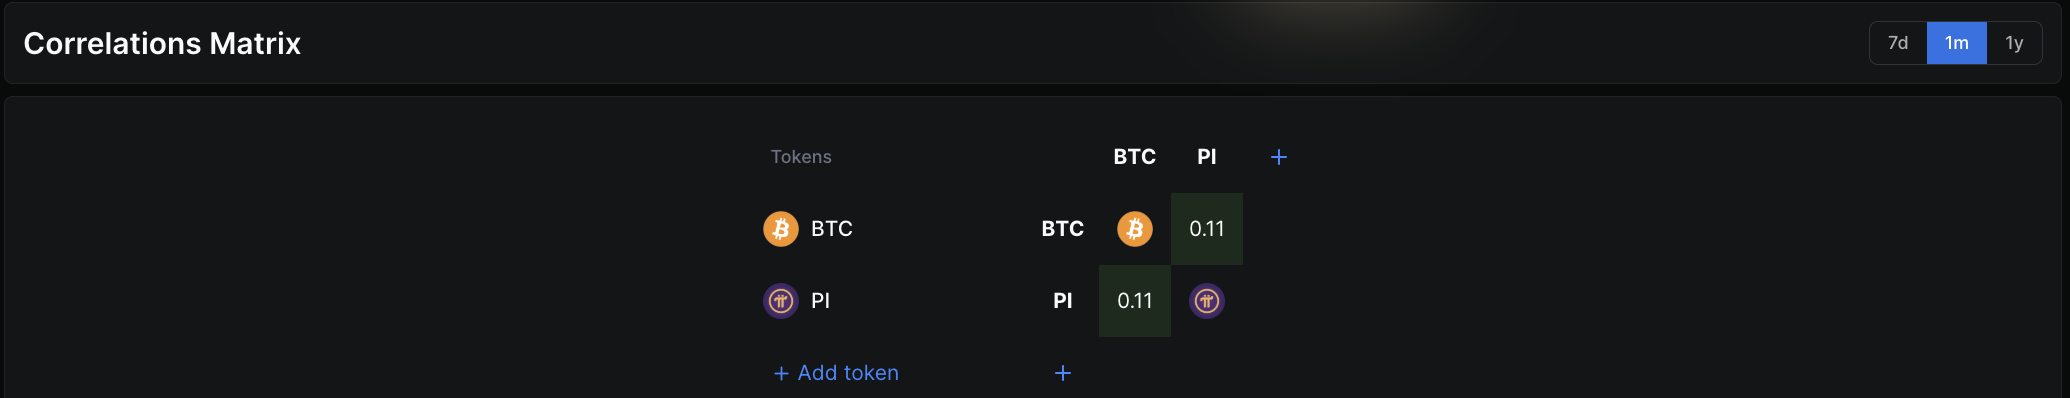
Pi’s price isn’t strongly affected by Bitcoin‘s movements, which explains its relatively slow growth. Currently, there’s only a weak connection – a correlation of just 0.11 – between the price of Bitcoin and Pi Network. This means Pi isn’t rising as quickly as it might if it followed Bitcoin’s trends. Instead, Pi’s price seems to be more influenced by the overall altcoin market. If investors start shifting money into other cryptocurrencies (altcoins), Pi could potentially increase in value, but until that happens, its independent behavior is holding back significant price gains.
Because Pi Coin is closely related to the overall cryptocurrency market (TOTAL3), it could be a good indicator of when investors start moving money into other, smaller cryptocurrencies (altcoins).
However, despite the muted PISI, one indicator is quietly turning bullish.
Pi Coin Price Needs $0.200 to Trigger the Setup As Big Money Flows In
The Chaikin Money Flow (CMF), which shows where large investors are putting their money, recently moved above zero on the 8-hour chart, reaching 0.03. This happened previously in late February, and a price increase for PI followed. With the current cup-and-handle pattern developing and the RSI still showing a positive trend, this new CMF crossover strengthens the likelihood of a price increase, suggesting larger investors are beginning to buy again.
The price faces its first significant challenge around $0.200, which is a key level based on Fibonacci analysis. If the price stays above this point for eight hours, it suggests an upward breakout is likely. Further confirmation of this upward move will come at $0.204, a level that also corresponds to a key part of the cup-and-handle pattern.
If the price rises above $0.204, it could trigger a rally of around 22%, potentially reaching $0.246. If the price continues to climb, $0.275 is a likely next target, based on Fibonacci analysis.
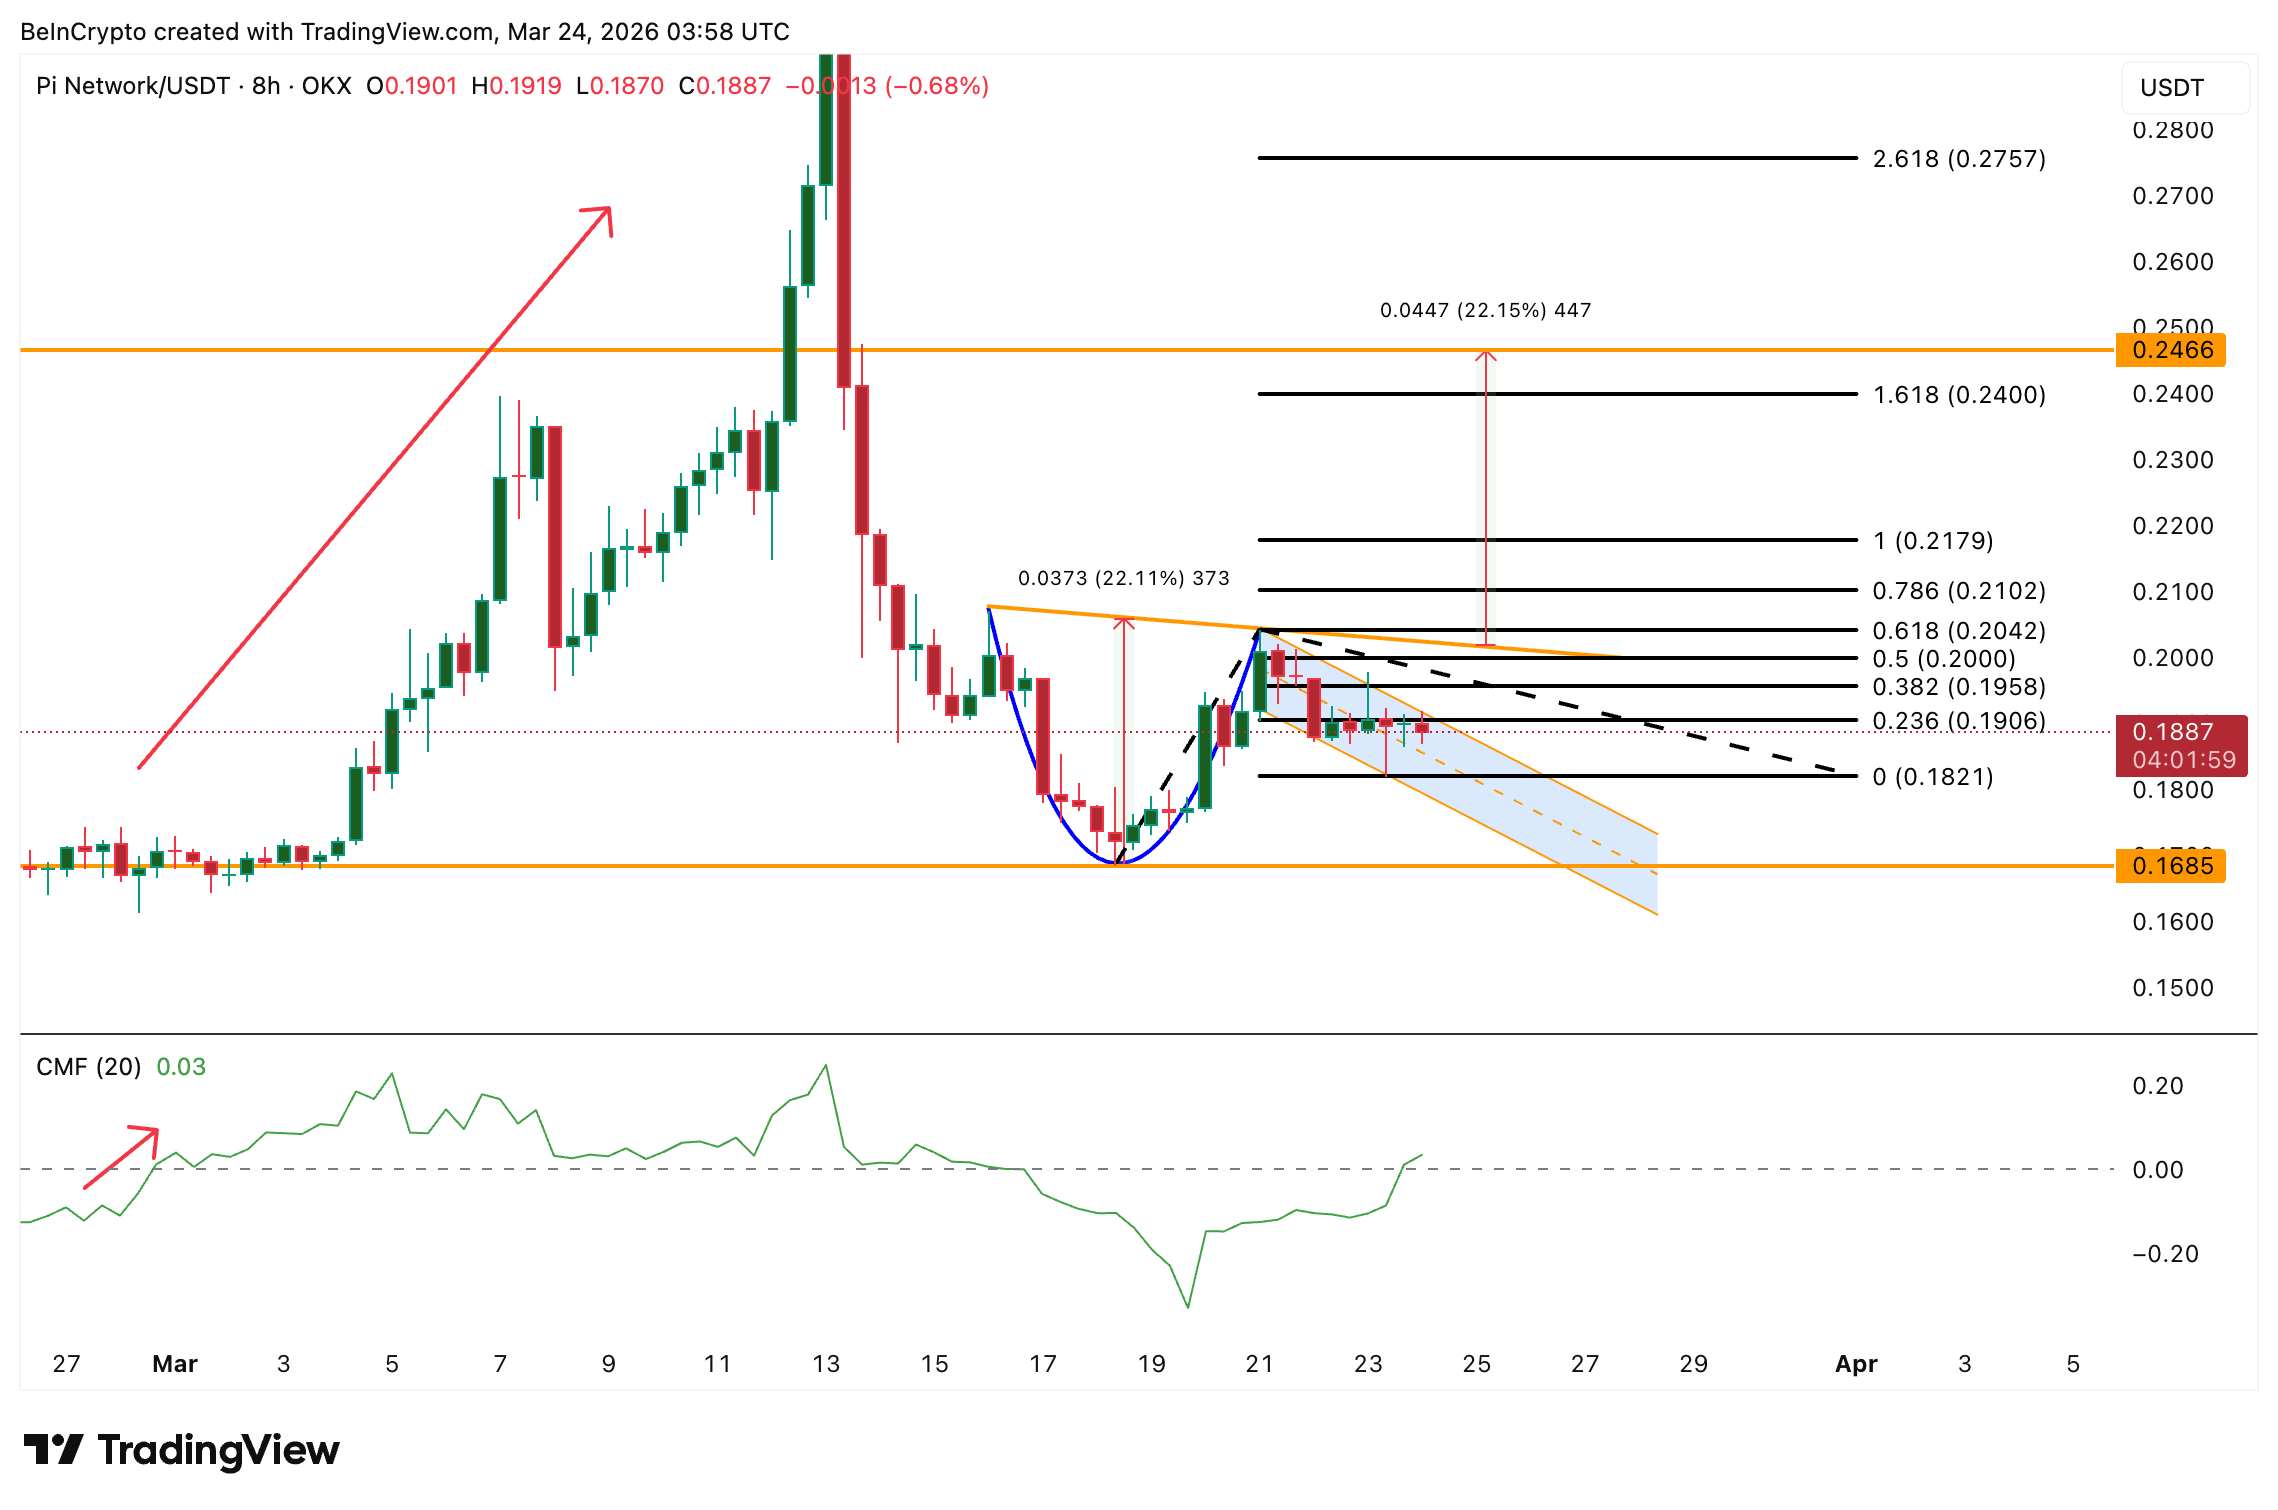
Currently, the price has a strong support level around $0.182. If the price falls below this and then below zero, the expected pattern will become less reliable, and the next support level to watch would be $0.168. If the price closes below $0.168, it would suggest the anticipated pattern is no longer valid.
Pi Coin’s price needs to stay above $0.20 for eight hours to confirm a short-term upward trend, turning what looks like a potential pattern into a confirmed rally.
Read More
- Forza Horizon 6: Find the Ohtani Treasure Chest Location
- NTE Drift Guide (& Best Car Mods for Drifting)
- LEGO Batman Legacy of the Dark Knight Batcave Minikits & WayneTech Caches
- Diablo 4 Best Loot Filter Codes
- Boruto: Ikemoto Has Already Hinted At Sasuke’s New Eye After Return
- USD RUB PREDICTION
- Top 10 Must-Watch Isekai Anime on Crunchyroll Revealed!
- Cookie Run Kingdom Timeline of Fate Update Guide
- Deltarune Chapter 1 100% Walkthrough: Complete Guide to Secrets and Bosses
- Starsand Island’s Rarest Achievements and How to Earn Them
2026-03-24 09:12