Bitcoin lingered near the edge of eighty thousand and one, as if the morning itself paused to listen, on May 10, 2026, just after eight o’clock. The market, in its peculiar fashion, kept a broad bullish bearing across the daily, four-hour, and one-hour charts, while the price action found itself between obstinate resistance and steadfast support. Traders watched Bitcoin as if it were a mischievous rural cat, nibbling at the door while weighing the next audacious leap.
-
Key Takeaways:
- Bitcoin held above $80K on May 10, 2026, preserving a bullish higher-low structure.
- Chart data showed 12 positive moving average signals as BTC neared $81.1K resistance.
- Market data shows $17.7B volume, with traders watching Bitcoin for a breakout toward $84K.
Bitcoin Chart Outlook
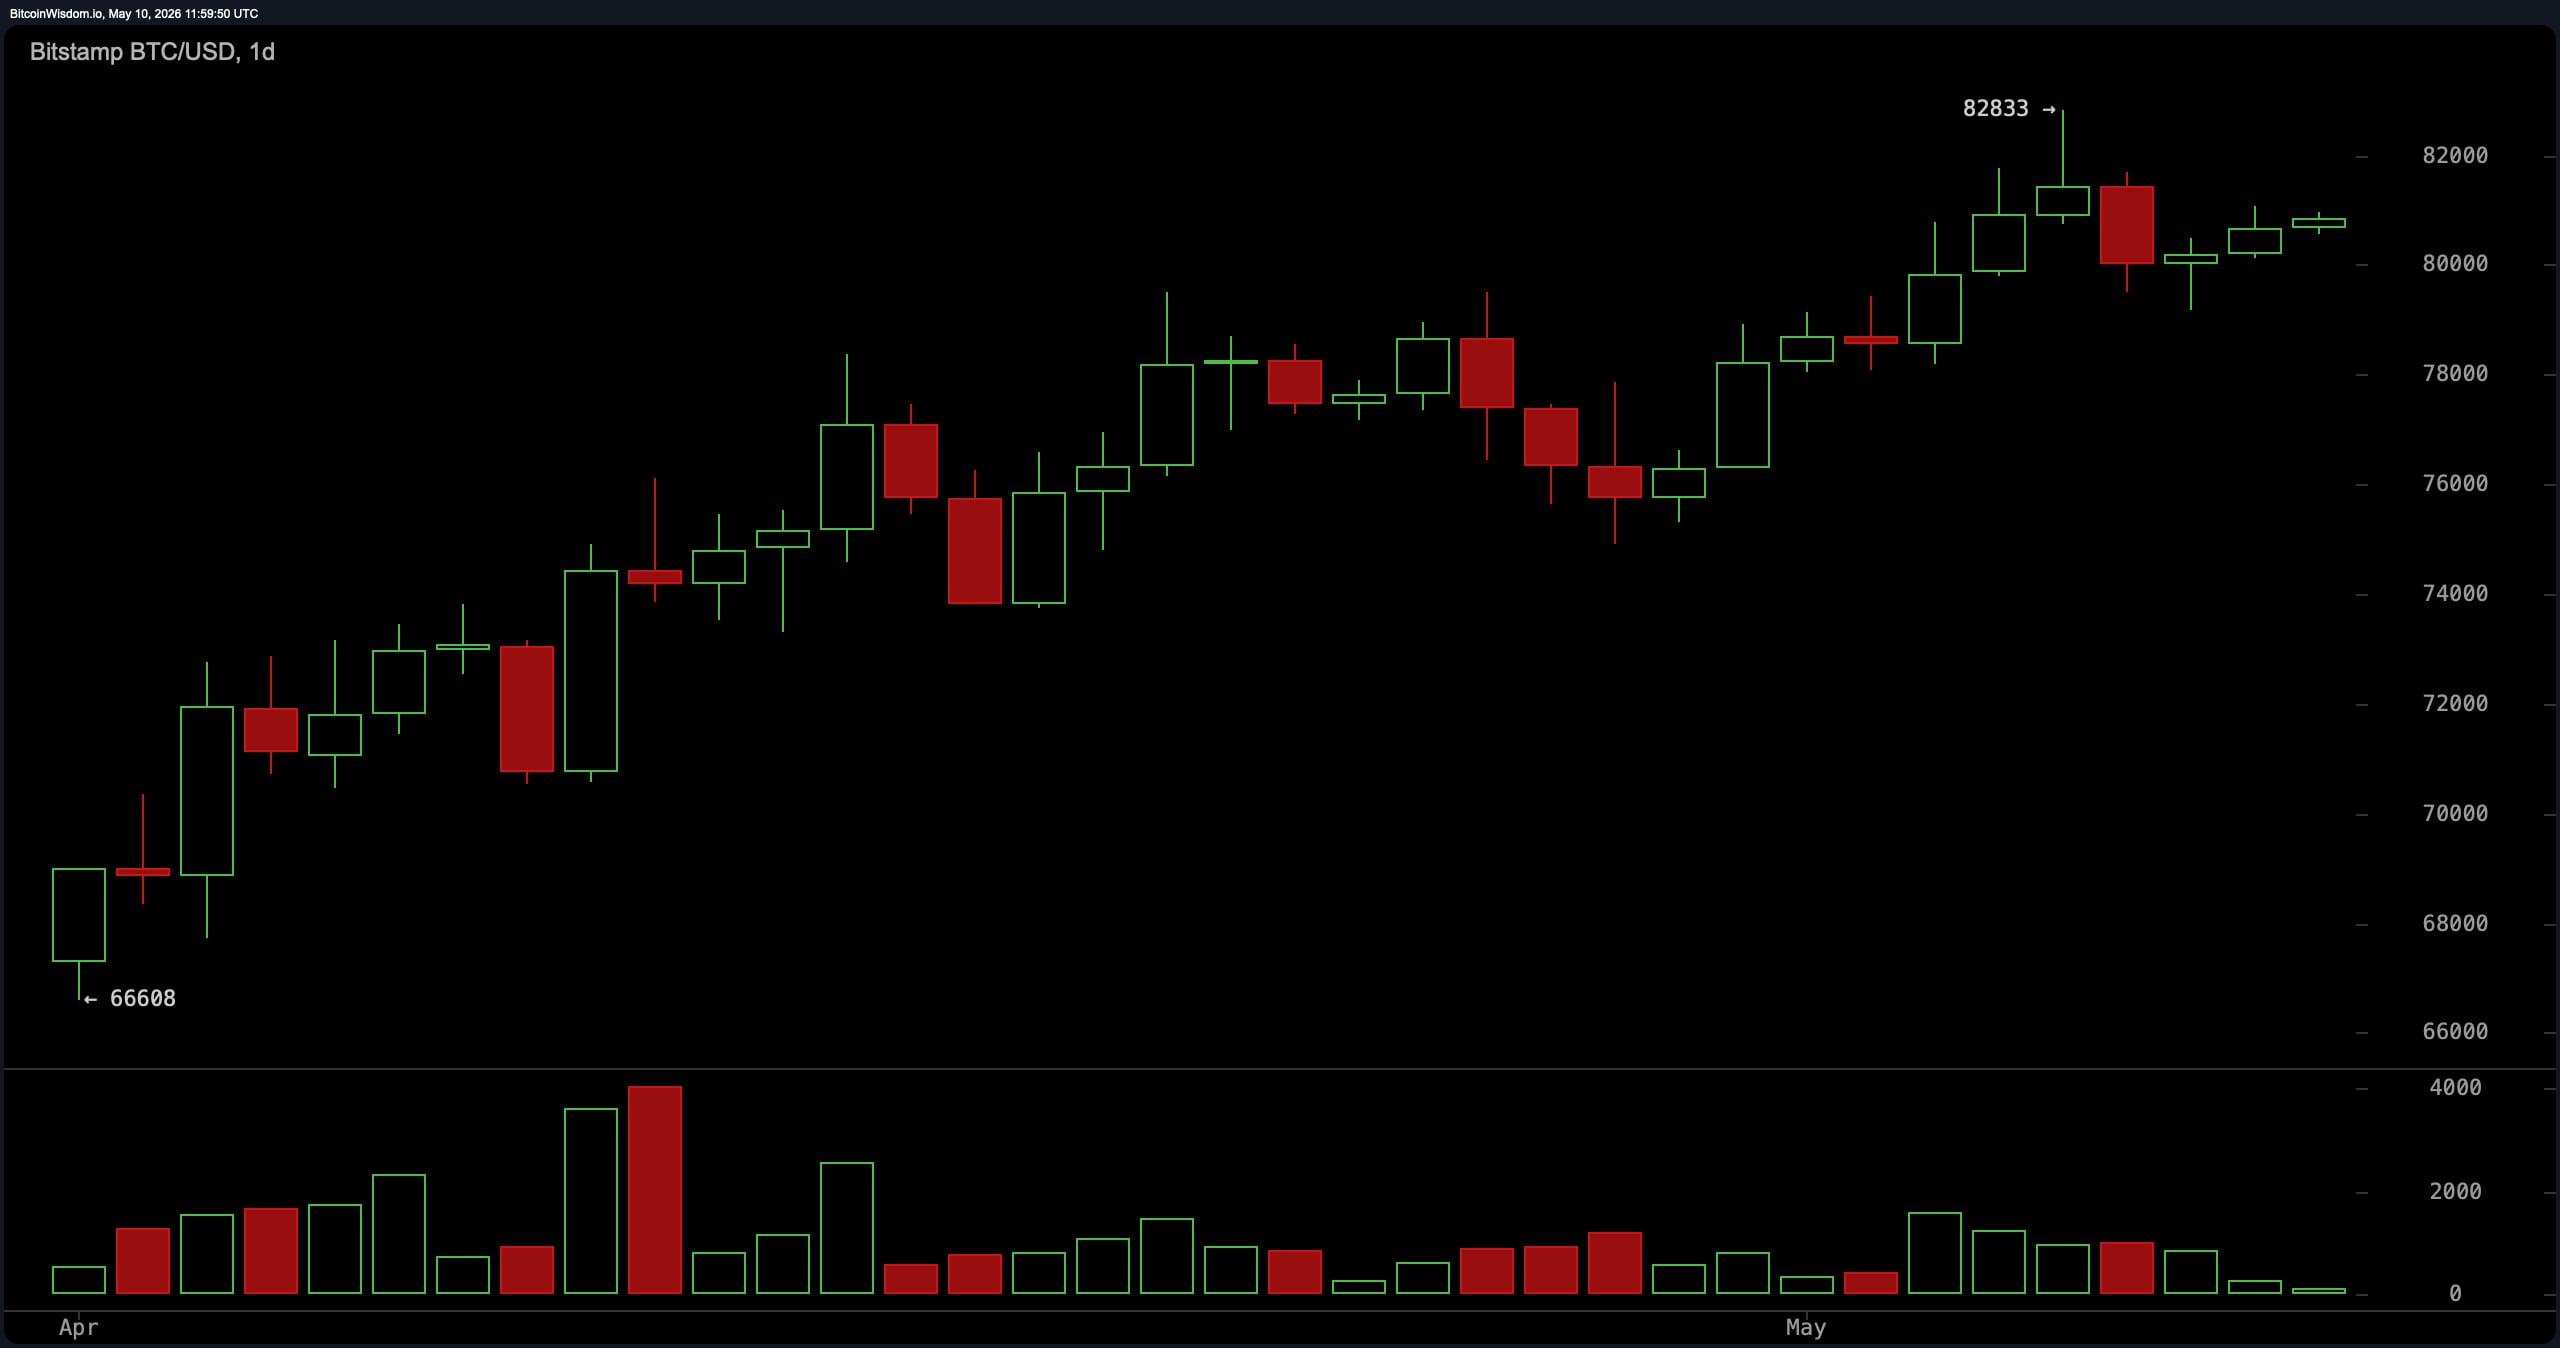
The daily chart favors the ascent, as Bitcoin maintains a pattern of higher highs and higher lows, a constellation technical folk sometimes mistake for enduring strength. Bitcoin recently faced a rebuff near the $82,800 crest, yet the fall did not unfold into a cascade. For, when weak bearish momentum after a rejection is seen, it is often a sign that beneath the surface there persists a benevolent bustle among buyers.
Support between $79,500 and $80,000 continues to hold firmly, keeping the larger trend intact even as the surface hesitates. The market cap remains colossal-roughly $1.62 trillion-reminding us that Bitcoin still holds a throne in the digital empire. Even after years of volatility, Bitcoin refuses to age gracefully; it behaves as though it were a spring chicken in a market of cautious hedgehogs.
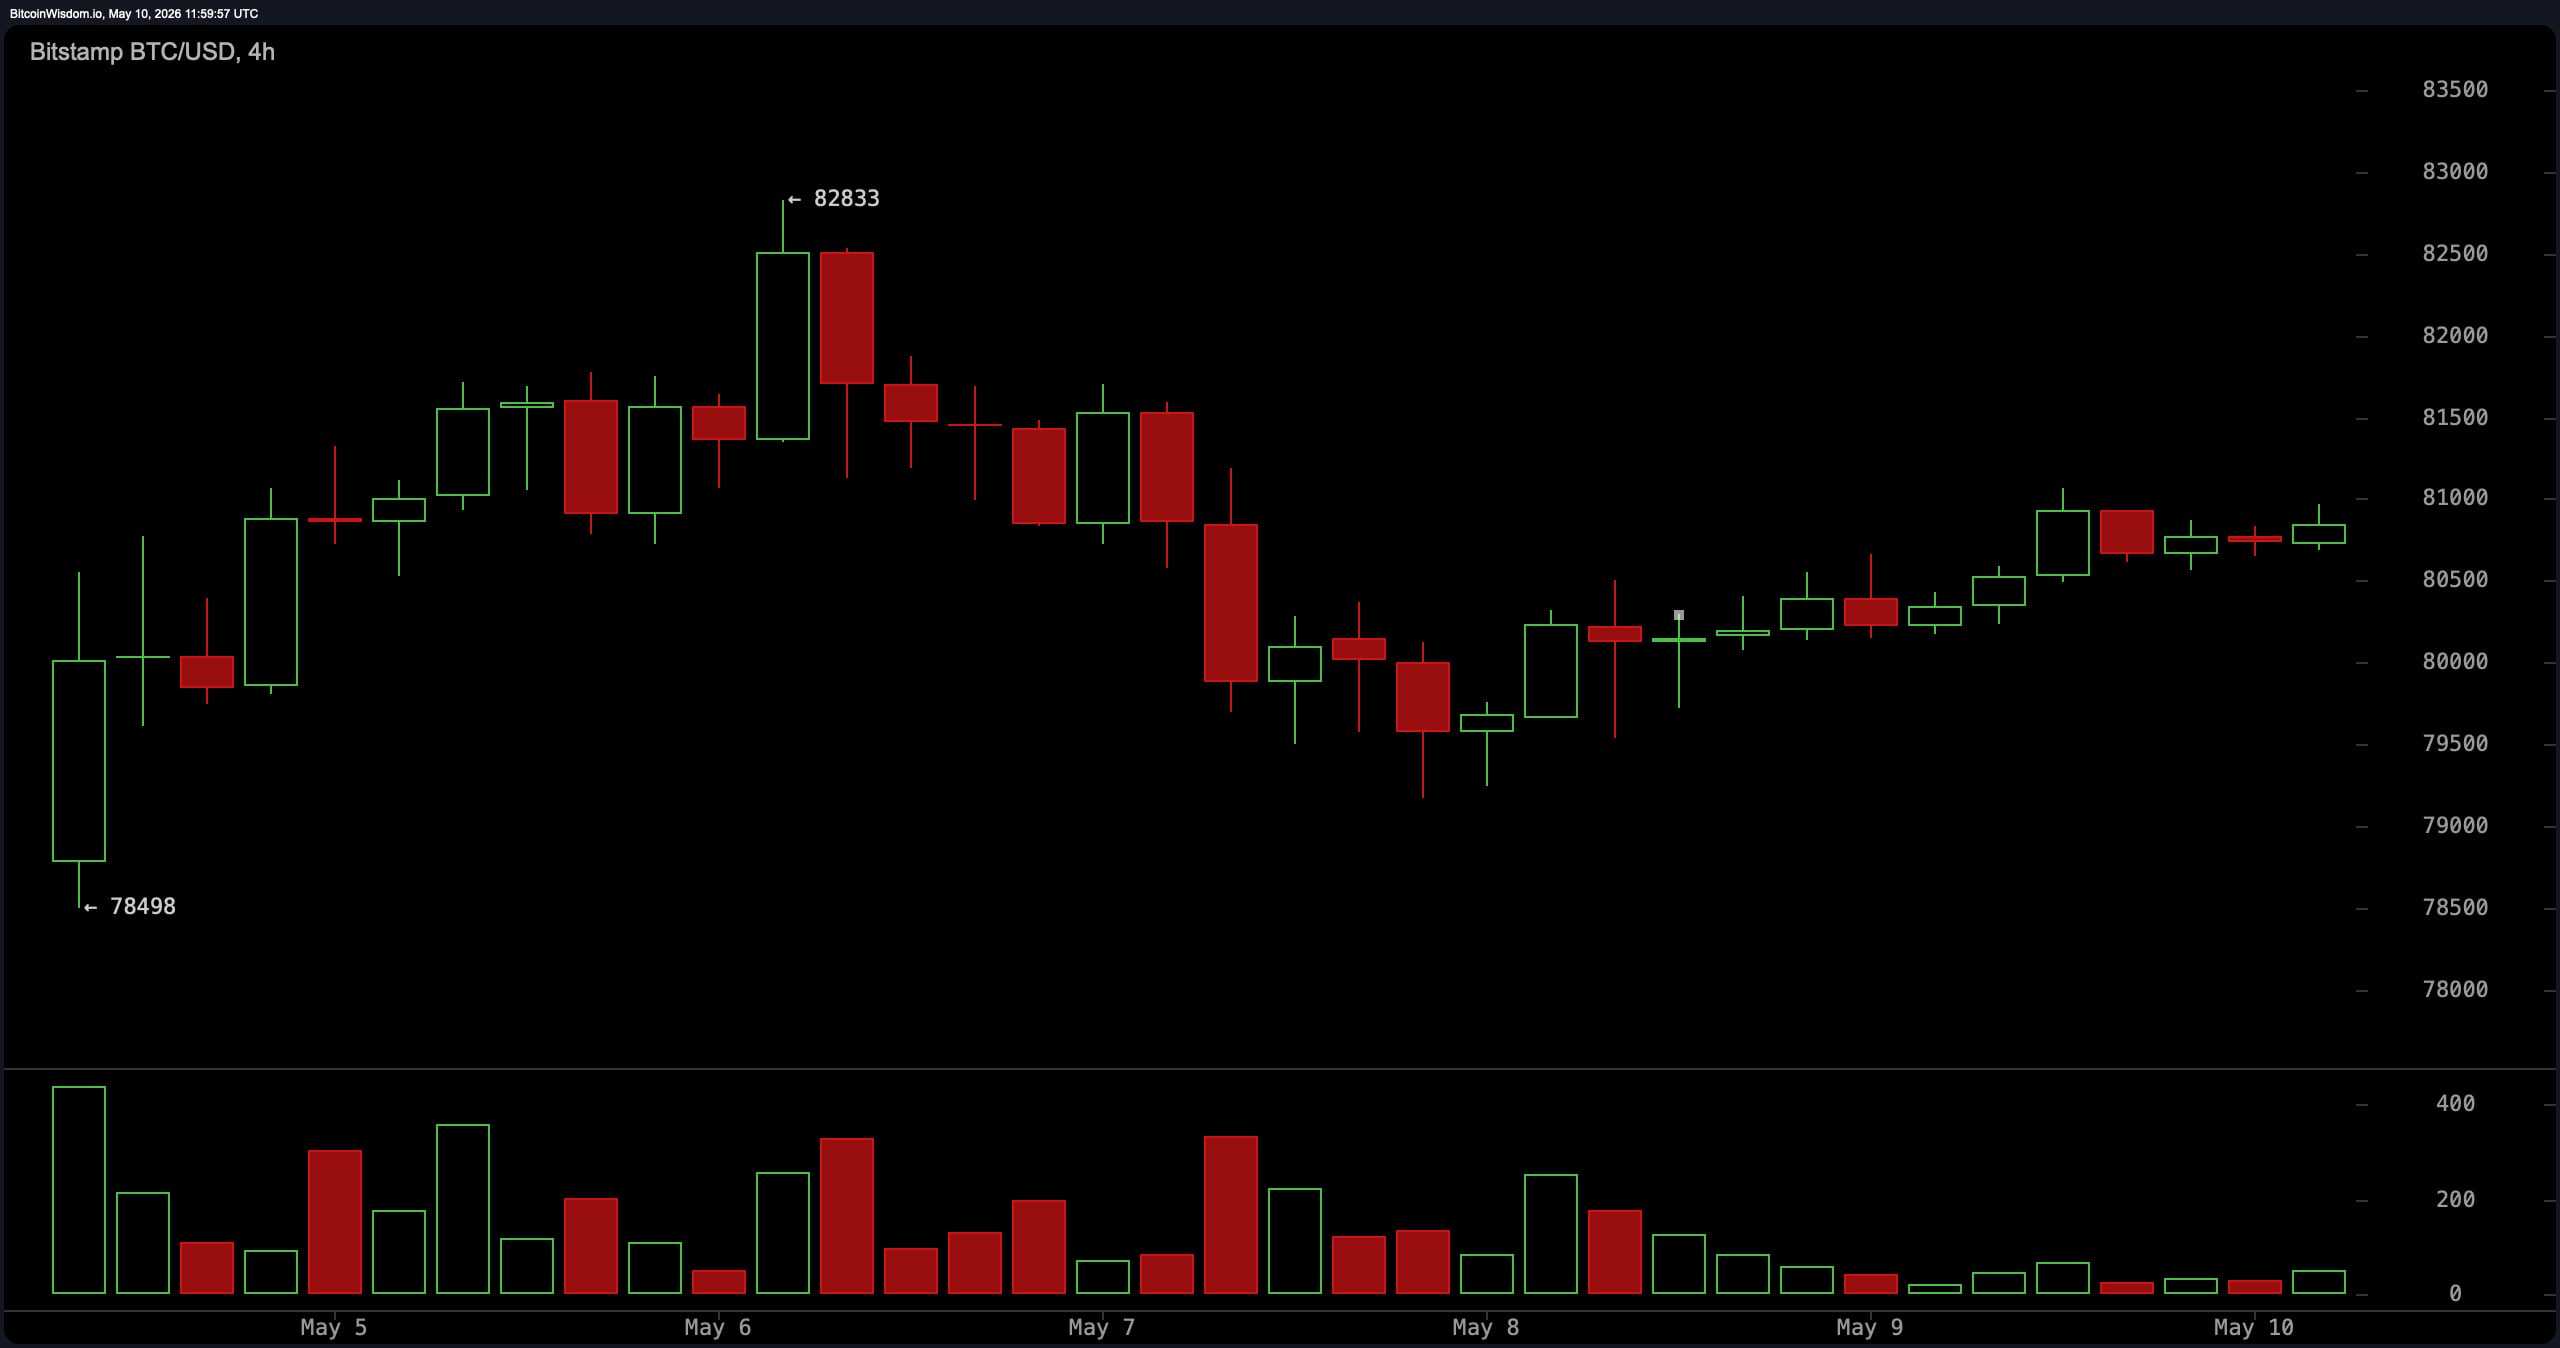
The four-hour chart paints a picture of consolidation after Bitcoin’s latest impulse move higher. Price action remains compressed roughly between $79,500 and $81,000, while dwindling volume and a quiet volatility whisper suggest a classic phase of compression. In technical lore, such episodes often precede a hungry, directional expansion once the price escapes its cozy range. Traders keep a wary eye on the $81,100 level as a potential breakout trigger, while failure to sustain support near $79,500 could sadden short-term sentiment. Until either side commands the stage, Bitcoin seems content to grind sideways, much like a hedge-fund manager dodging hard questions on live television.
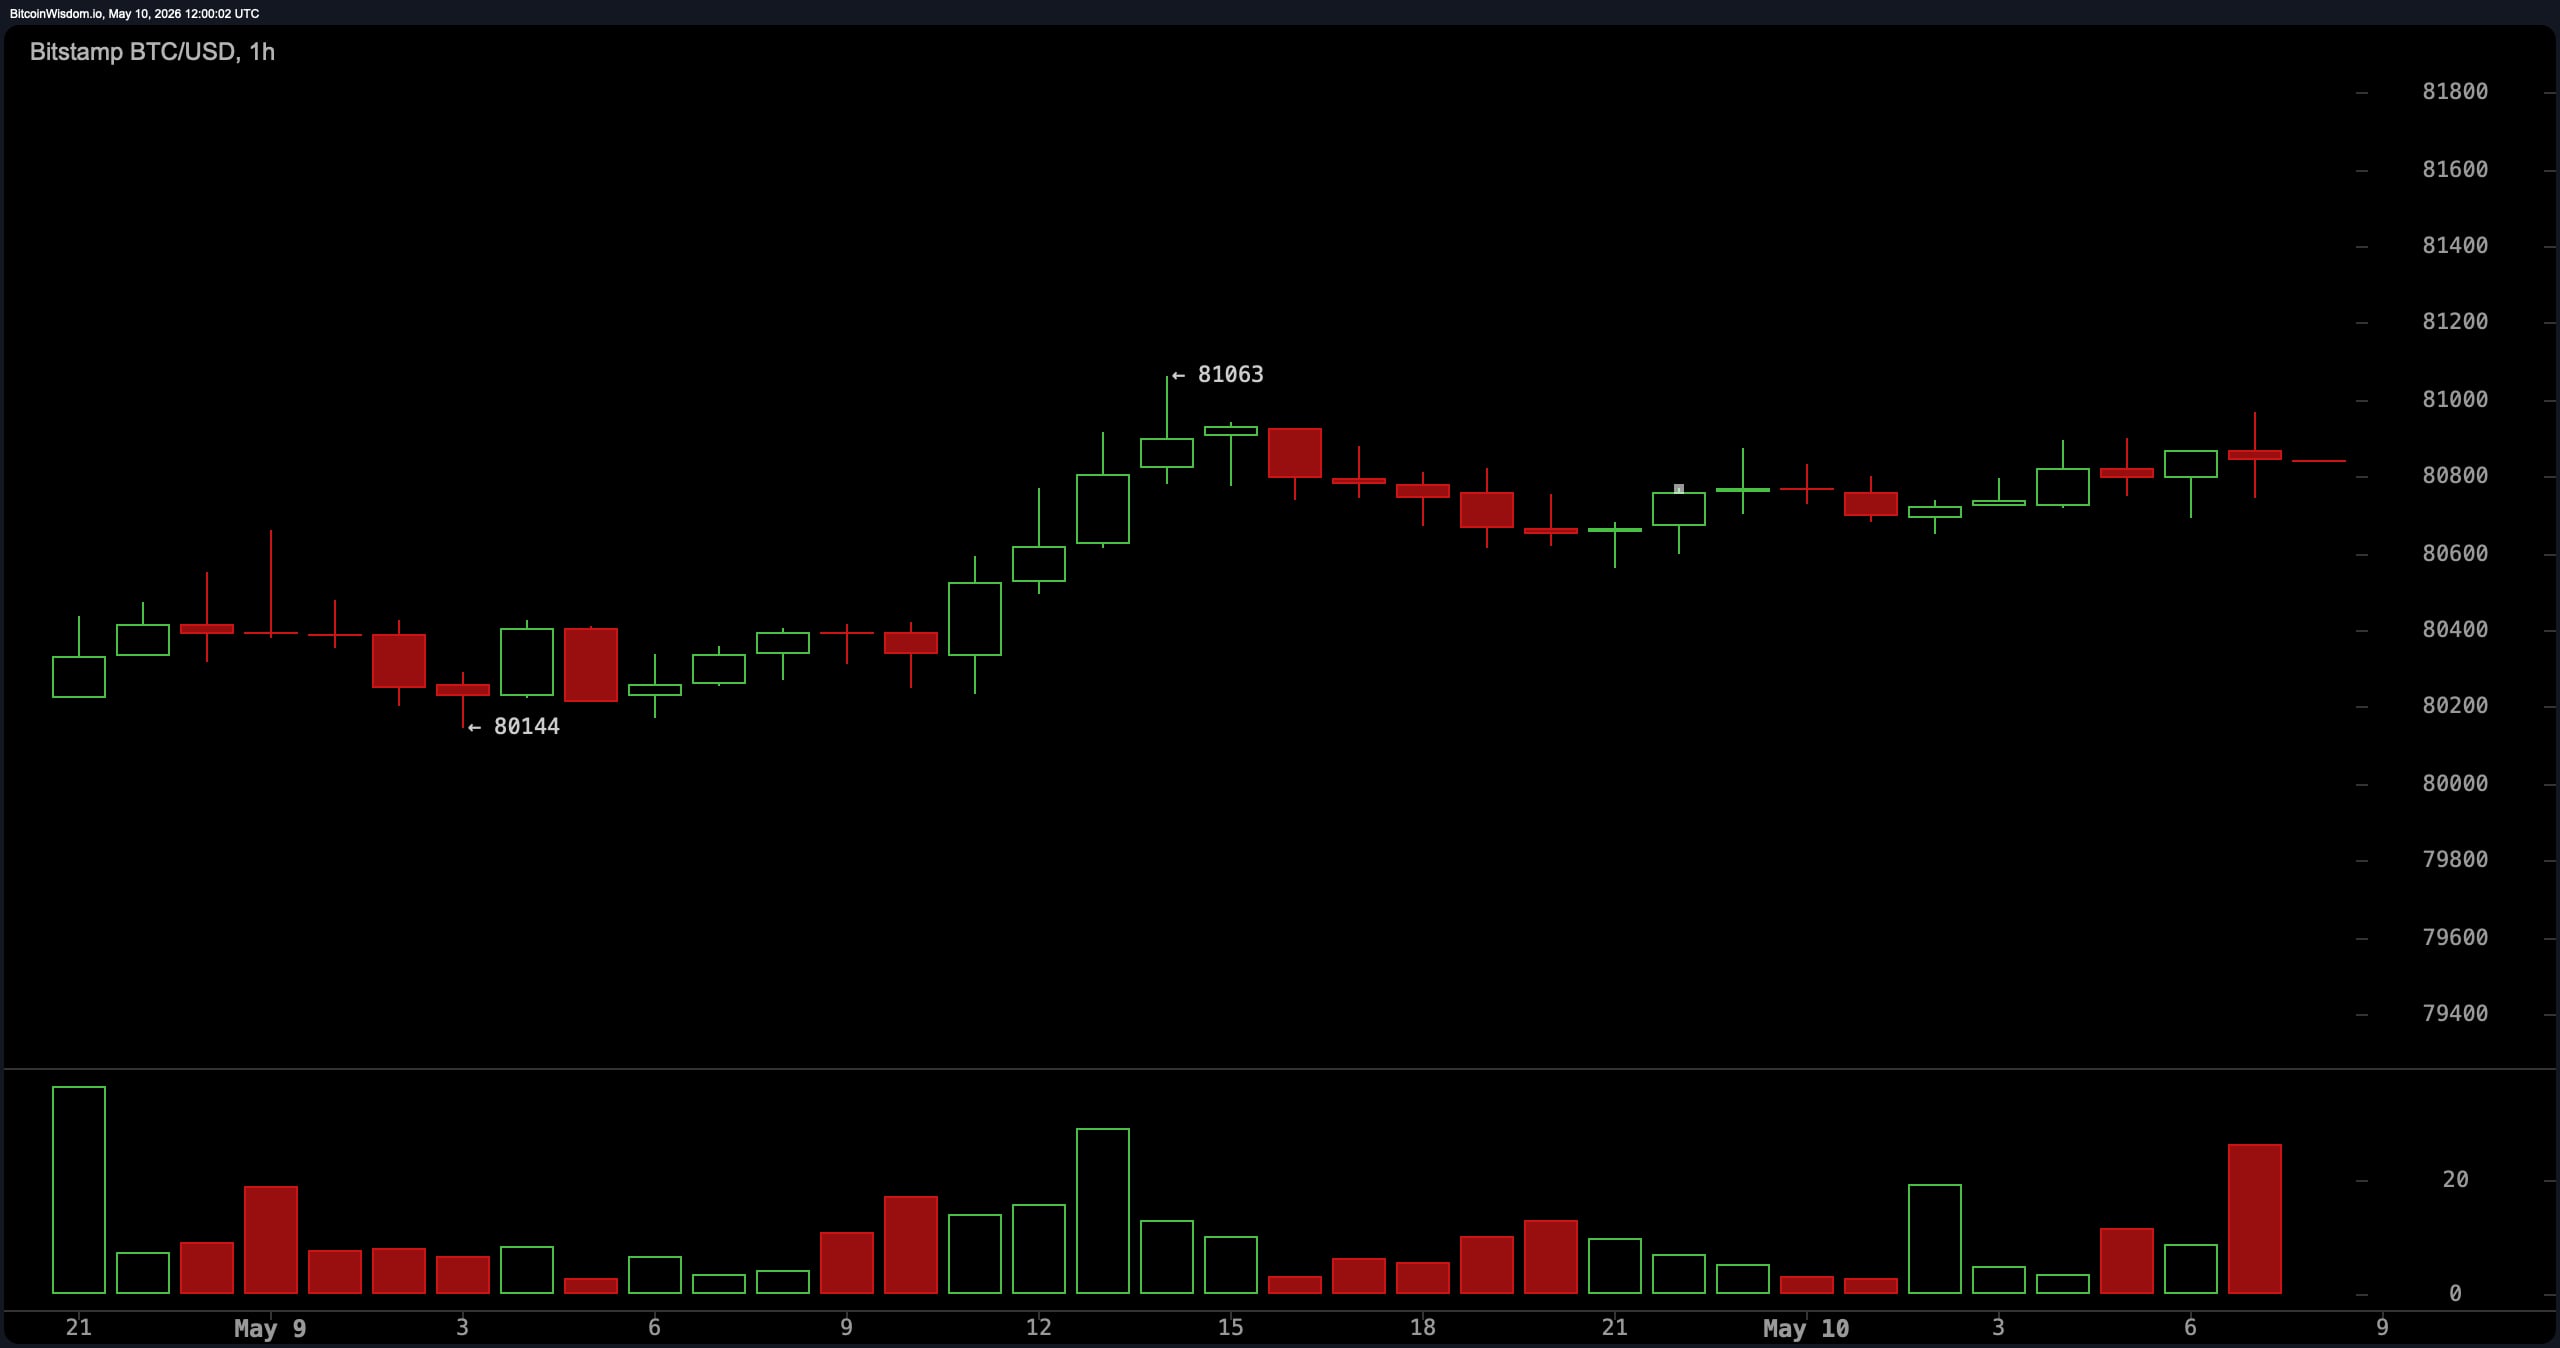
On the one-hour chart, Bitcoin continues displaying neutral-to-bullish momentum with a gradual upward grind and shallow pullbacks. Buyers defend dips between $80,400 and $80,600, preventing deeper retracements. Importantly, market data does not show aggressive downside volume, which suggests accumulation rather than broad distribution. The intraday range between $80,254 and $81,023 mirrors stable participation amid the larger fog of macro uncertainty. Short-term momentum may not blaze, but Bitcoin climbs with the stubborn persistence of someone refreshing a portfolio every seven seconds, pretending they are “long term.”
Oscillators currently deliver a mixed but generally stable technical backdrop. The relative strength index (RSI) stands at 65, neutral enough to invite stronger momentum without shouting “overbought.” Stochastic sits at 72, also neutral, while the commodity channel index (CCI) at 106 hints at weaker near-term momentum. The average directional index (ADX) at 31 whispers that the trend carries some respectable heft. The Awesome oscillator reads 4,186 with a neutral signal, momentum (10) at 4,579 with a modest tilt, and MACD at 1,855, signaling constructive momentum. In short, the map shows mostly neutral readings with a lone positive nudge amid a chorus of cautious voices.
Moving averages remain the chorus line of confirmation. The EMA 10 at $79,833 and the SMA 10 at $79,947 both breathe optimism into the scene. EMA 20, SMA 20, EMA 30, SMA 30, EMA 50, SMA 50, EMA 100, and SMA 100 all echo a positive vibe across shorter and intermediate horizons. Yet the EMA 200 at $82,020 and SMA 200 at $82,719 still cast a shadow of longer-term caution, suggesting that the grand arc of time has not yet fully yielded to the bulls. Still, with 12 positive moving average signals against two weaker readings, the technical backdrop leans toward the bulls. Bitcoin adores drama, but the moving averages seem far less enthused about a bearish twist.
Bull Verdict:
Bitcoin continues holding above the critical zone of $79,500 to $80,000 while tracing higher highs and higher lows on the daily canvas. With 12 positive moving average signals, constructive MACD momentum, and patient dip-buying near $80,400, the broader structure still leans toward upside if BTC can clear resistance near $81,100 and eventually retest $82,800.
Bear Verdict:
Bitcoin remains pressed beneath the gate near $82,800, while waning momentum cues like the CCI and momentum (10) hint that the upside vigor is not invincible. If BTC breaks the $79,500 floor with convincing volume, the present consolidation could tilt toward the downside, unveiling targets near $78,000 and perhaps even $76,800 as the stage props change.
Read More
- Forza Horizon 6: Find the Ohtani Treasure Chest Location
- NTE Drift Guide (& Best Car Mods for Drifting)
- LEGO Batman Legacy of the Dark Knight Batcave Minikits & WayneTech Caches
- How to Open Locked Door in Tenryu River in Nioh 3 (Dirty Key)
- Sega’s “Super Game” is Said to Release Next Month, But Nothing is Known About It
- Skyblivion Gets Encouraging Development Update
- GameRant Daily Crossword (February 10, 2026)
- Asmongold reveals shocking detail about how much money he makes
- God of War Shadow Drops New Game and Confirms Greek Trilogy Remake
- New Steam Game is Like Pokemon If It Were a Sci-fi Shooter
2026-05-10 16:27