Shiba Inu’s recent price movements suggest the current selling pressure might be weakening. While the overall trend is still downward, the latest price patterns show that sellers are losing strength after a long period of falling prices.
The chart tells the story of SHIB’s price movement. Throughout April and early May, the price had been steadily increasing within a defined range. Recently, SHIB broke below that range, which usually signals a further price drop. However, instead of a large decline, sellers struggled to push the price much below $0.00000550, and the downward trend quickly lost steam.
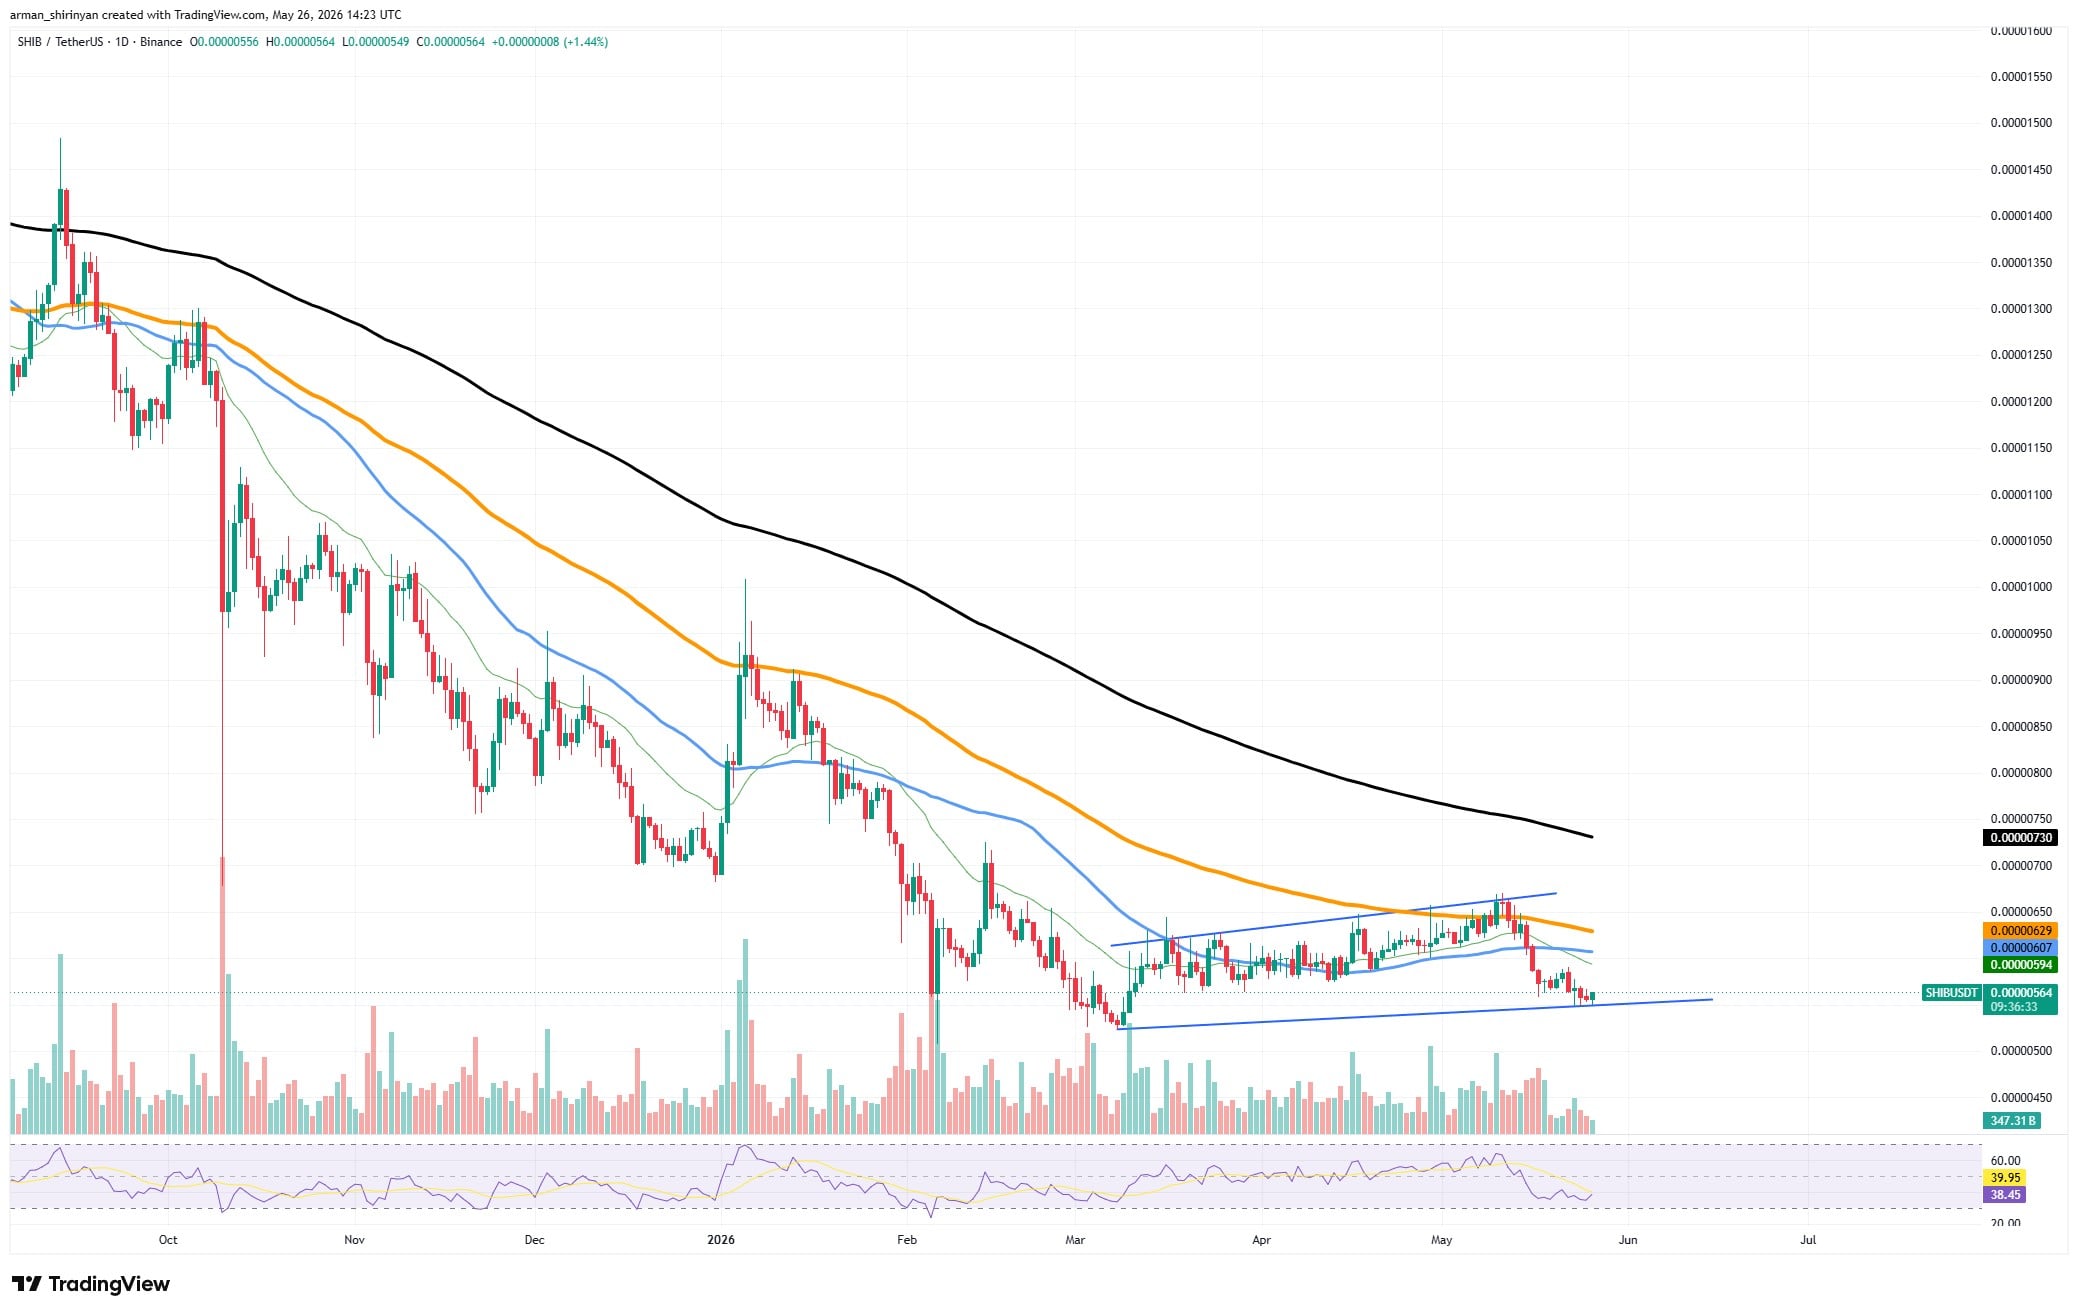
The Relative Strength Index (RSI) is nearing oversold levels without a significant drop, suggesting that downward momentum is slowing down, not speeding up. Although prices have fallen below a key support level, trading volume hasn’t spiked, meaning widespread, panicked selling didn’t occur. Essentially, while sellers managed to break through support, they failed to create strong fear in the market.
Shiba Inu (SHIB) Sellers Exhausted, Dogecoin (DOGE) Zero Addition Question of Time, XRP Recovery Starts: Crypto Market Review
Will Most Anti-Crypto Congressman Lose His Seat?
This is important because the way emotions shift heavily influences the price of cryptocurrencies like SHIB. Even a small increase in buying can quickly stop a price drop, especially when people stop panicking and selling. Also, there might not be many more coins available for sale, as those who wanted to sell likely did so during previous price declines.
Generally, the technical indicators suggest a continuing downward trend for SHIB. Key moving averages for the past 50, 100, and 200 days are all declining, and the price remains below these levels. While the long-term outlook is still uncertain, current conditions seem more stable than the sharp price drops seen earlier in the year.
The price level around $0.00000540 – $0.00000550 is currently a crucial support level. If SHIB can stay above this level and climb back towards the $0.00000590 – $0.00000600 range, it might stabilize instead of falling further. However, a major price increase isn’t expected right away.
Dogecoin’s zero addition is possible
Dogecoin is nearing a critical moment. Its next price movement will likely decide if it continues to fall, potentially losing another digit in value, or if it can finally reverse its current downward trend. Right now, the charts suggest another drop is more likely.
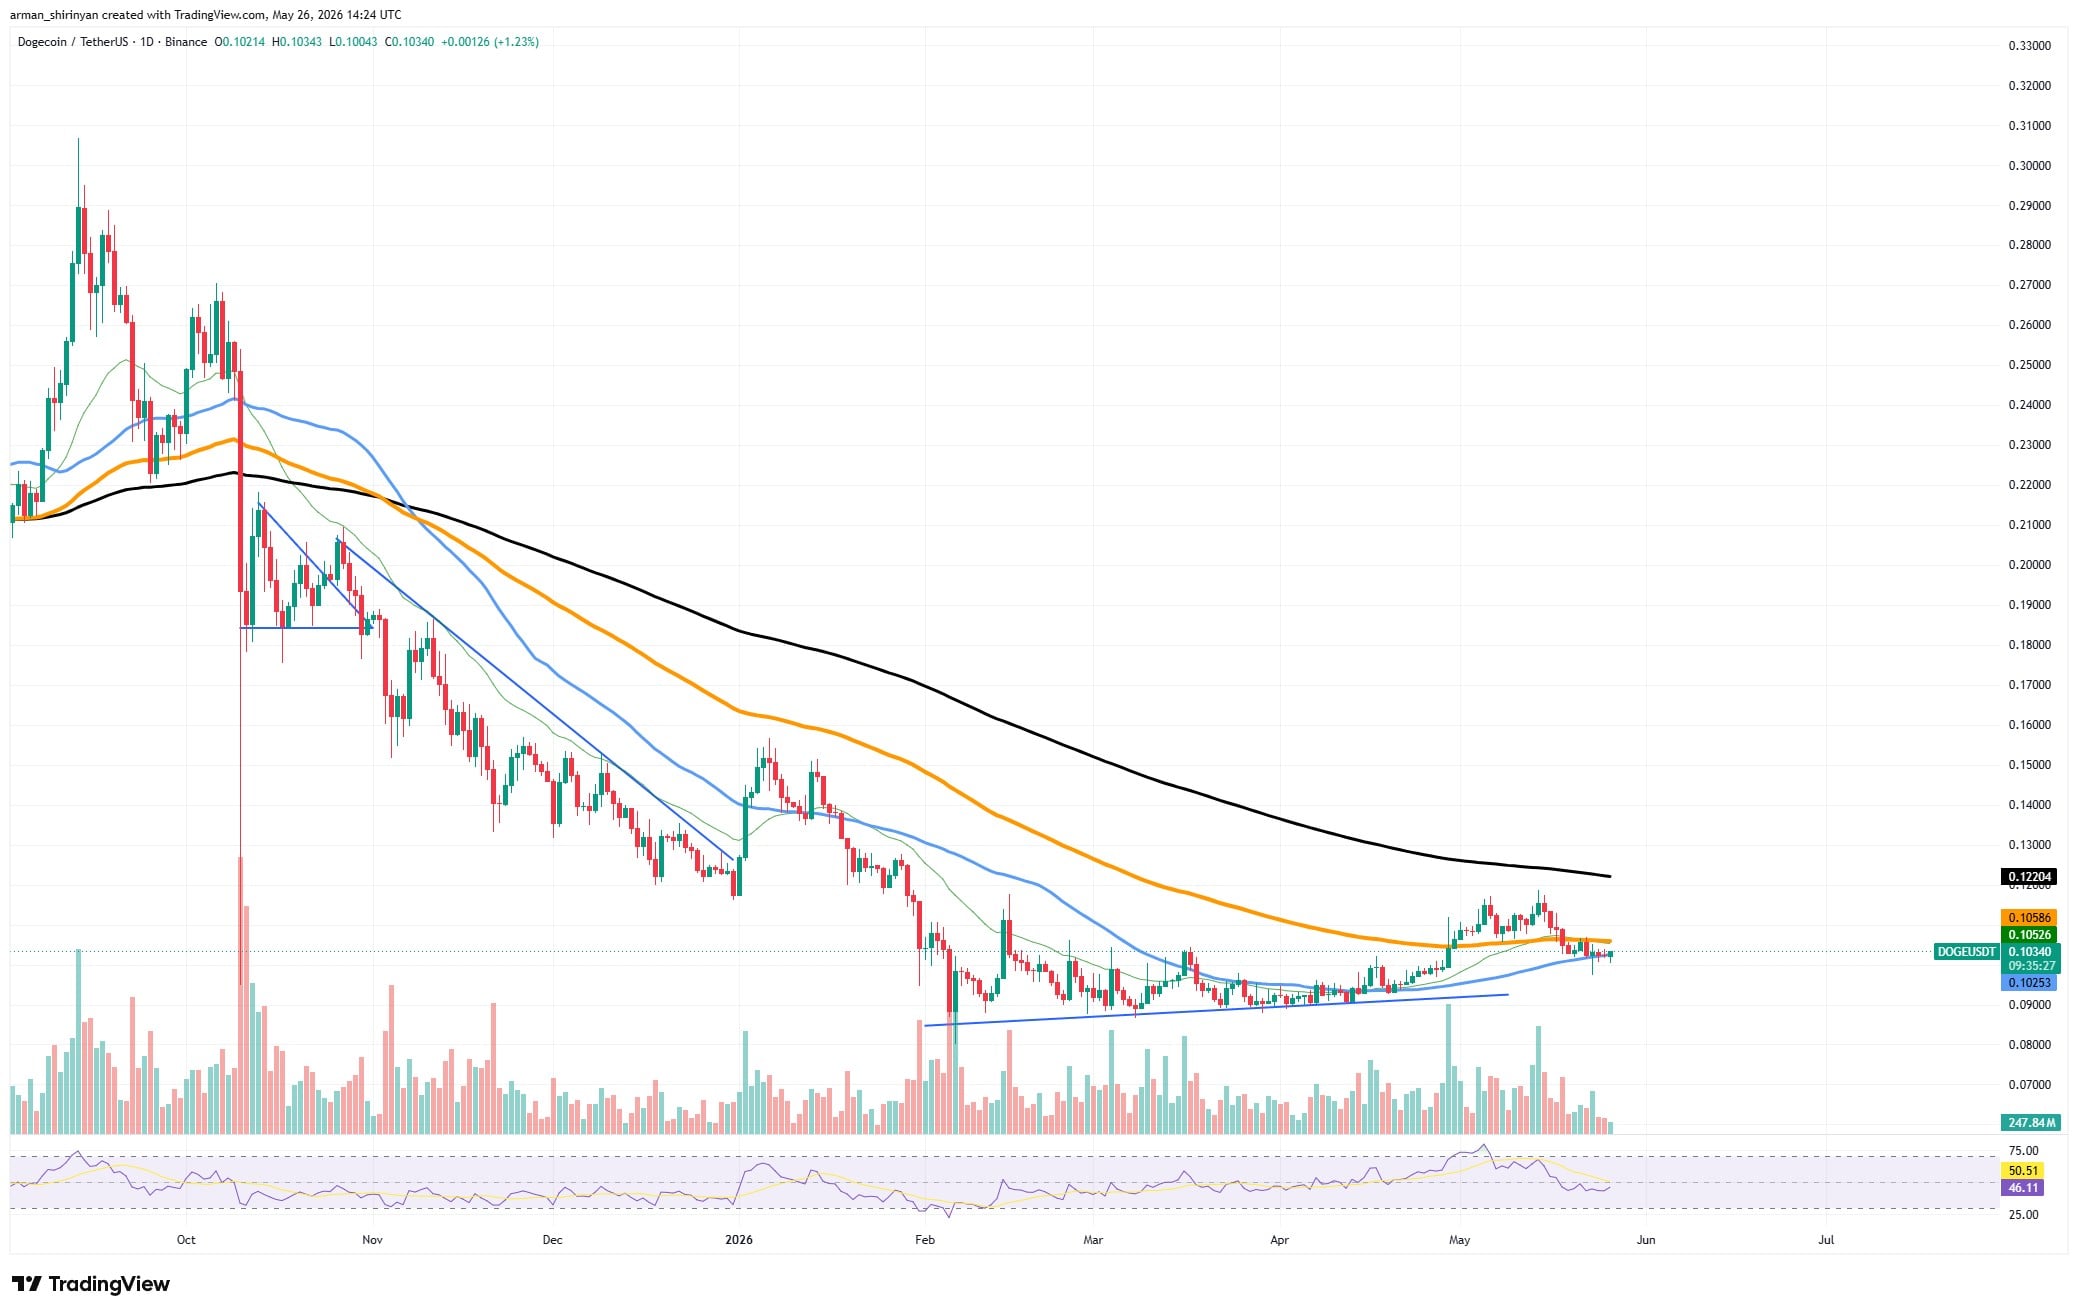
As an analyst, I’m watching DOGE closely. It attempted a breakout in May, but hasn’t been able to hold those gains. We saw a positive push earlier this month, briefly moving above key moving averages, but the rally stalled quickly. Once the price approached the $0.11 resistance level, the upward momentum pretty much disappeared. It’s currently trading just above a significant support area, and I’m keeping a close eye on whether it can regain its footing.
That rejection significantly changed the market’s outlook. Recent trading data shows DOGE is having trouble maintaining its price, and it’s now falling below its 50-day moving average. Trading volume dropped sharply after a failed attempt to break higher, suggesting that investor excitement has waned as the price stopped climbing.
Meme assets like DOGE depend heavily on maintaining strong interest and trading activity. Unlike investments based on real-world value, these often require a lot of speculative buying and consistent support from individual investors. When that buying slows down, the price usually falls. Right now, the situation looks less like people are buying and more like they’re losing interest.
Currently, the market still has one key support level. DOGE is just above an upward trendline that formed when prices recovered in April. As long as the price stays near $0.10 to $0.102, buyers have a chance to steady the price and potentially push it higher again.
Things could get much worse if DOGE loses its current support level. Because meme coin enthusiasm often drops quickly when a token loses a zero, a clear break below the current price floor could send DOGE back down to under $0.10. This price point is a key psychological level, and breaking below it tends to speed up selling as investors react emotionally in the crypto market.
The Relative Strength Index (RSI) suggests that the market is losing strength. While momentum briefly increased during the May rally, it has since leveled off, indicating that the initial excitement that fueled the recent breakout attempt has faded.
There’s still a chance DOGE could recover. If buyers can break through the $0.105-$0.106 resistance level and move prices above the moving averages, it could prevent a larger price drop.
Currently, the price movement of DOGE suggests it’s losing steam and showing signs of potential decline.
XRP’s bounce potential
After a prolonged period of decline, XRP is showing early signs of stabilizing. Recent price movements suggest sellers are losing strength around the key $1.30 support level, although the trend hasn’t fully reversed to bullish yet. This $1.30 level is now a critical point for the entire market.
Over the past few months, XRP has repeatedly approached the $1.30 to $1.32 price range, but hasn’t fallen below it decisively. Each time the price dropped, buyers quickly stepped in to prevent a larger fall. This recent rise from the $1.30-$1.32 support level suggests XRP might be starting to recover, rather than preparing for another price drop.
XRP’s technical setup is gradually getting better. While the 50-day and 100-day moving averages still act as a ceiling between $1.39 and $1.47, they remain below XRP’s current price. Importantly, the recent dip in price didn’t have the same strong downward force as previous declines, suggesting weakening selling pressure.
Instead of falling into oversold levels, the Relative Strength Index (RSI) found support near the midpoint. This is significant because a loss of momentum often signals that a trend change is coming, even before the change is fully established.
XRP has been facing some selling pressure, but the pattern causing it seems to be weakening. The price is still holding above its recent lows, but it’s squeezing closer and closer to that support level. When these kinds of tight patterns finally break, they often result in a significant price move.
Whether the market bounces back depends entirely on whether the $1.30 level continues to hold as support. If the price falls cleanly below $1.30, it would strongly suggest the recent stabilization was just temporary and could lead to another significant drop in prices. While the market has successfully defended this level in the past, repeated attempts to test it are slowly weakening that support.
XRP isn’t currently experiencing a major price drop. Over the past few months, selling pressure has eased, trading volume has become more consistent, and price fluctuations have lessened. These are often the first signs that a price recovery might begin.
The price hasn’t risen significantly yet, but after weeks of selling, the XRP chart is now showing signs that people are starting to buy instead.
Read More
- Forza Horizon 6: Find the Ohtani Treasure Chest Location
- LEGO Batman Legacy of the Dark Knight Batcave Minikits & WayneTech Caches
- Diablo 4 Best Loot Filter Codes
- NTE Drift Guide (& Best Car Mods for Drifting)
- USD RUB PREDICTION
- USD CNY PREDICTION
- Cookie Run Kingdom Timeline of Fate Update Guide
- PS Plus Monthly Games for June 2026 Wish List
- Top 10 Must-Watch Isekai Anime on Crunchyroll Revealed!
- GBP CNY PREDICTION
2026-05-27 03:28