Bitcoin is currently trading above $74,000 and its price chart is showing a pattern called an ascending triangle. Technical analysts see this as a positive sign, suggesting the price is likely to continue going up.
The question now isn’t *if* Bitcoin has bounced back to a key support level, but whether this recovery is strong enough to suggest it will reach $90,000. We need to see if it’s a genuine upward trend backed by real market data and overall economic conditions, or just a temporary price increase that won’t last.
DISCOVER: Best crypto to buy right now – CoinSpeaker’s updated guide
The Ascending Triangle: What the Bitcoin Price Chart Structure Is Actually Showing
An ascending triangle is a chart pattern where the price repeatedly hits a ceiling level, but each time it drops, the lowest point of that drop gets higher. This shows buyers are consistently pushing the price up, while sellers are consistently defending a specific price level.
Bitcoin briefly stabilized above $73,000 earlier this week, then surged past $76,000. This is a price level it hasn’t reached since February 2026.
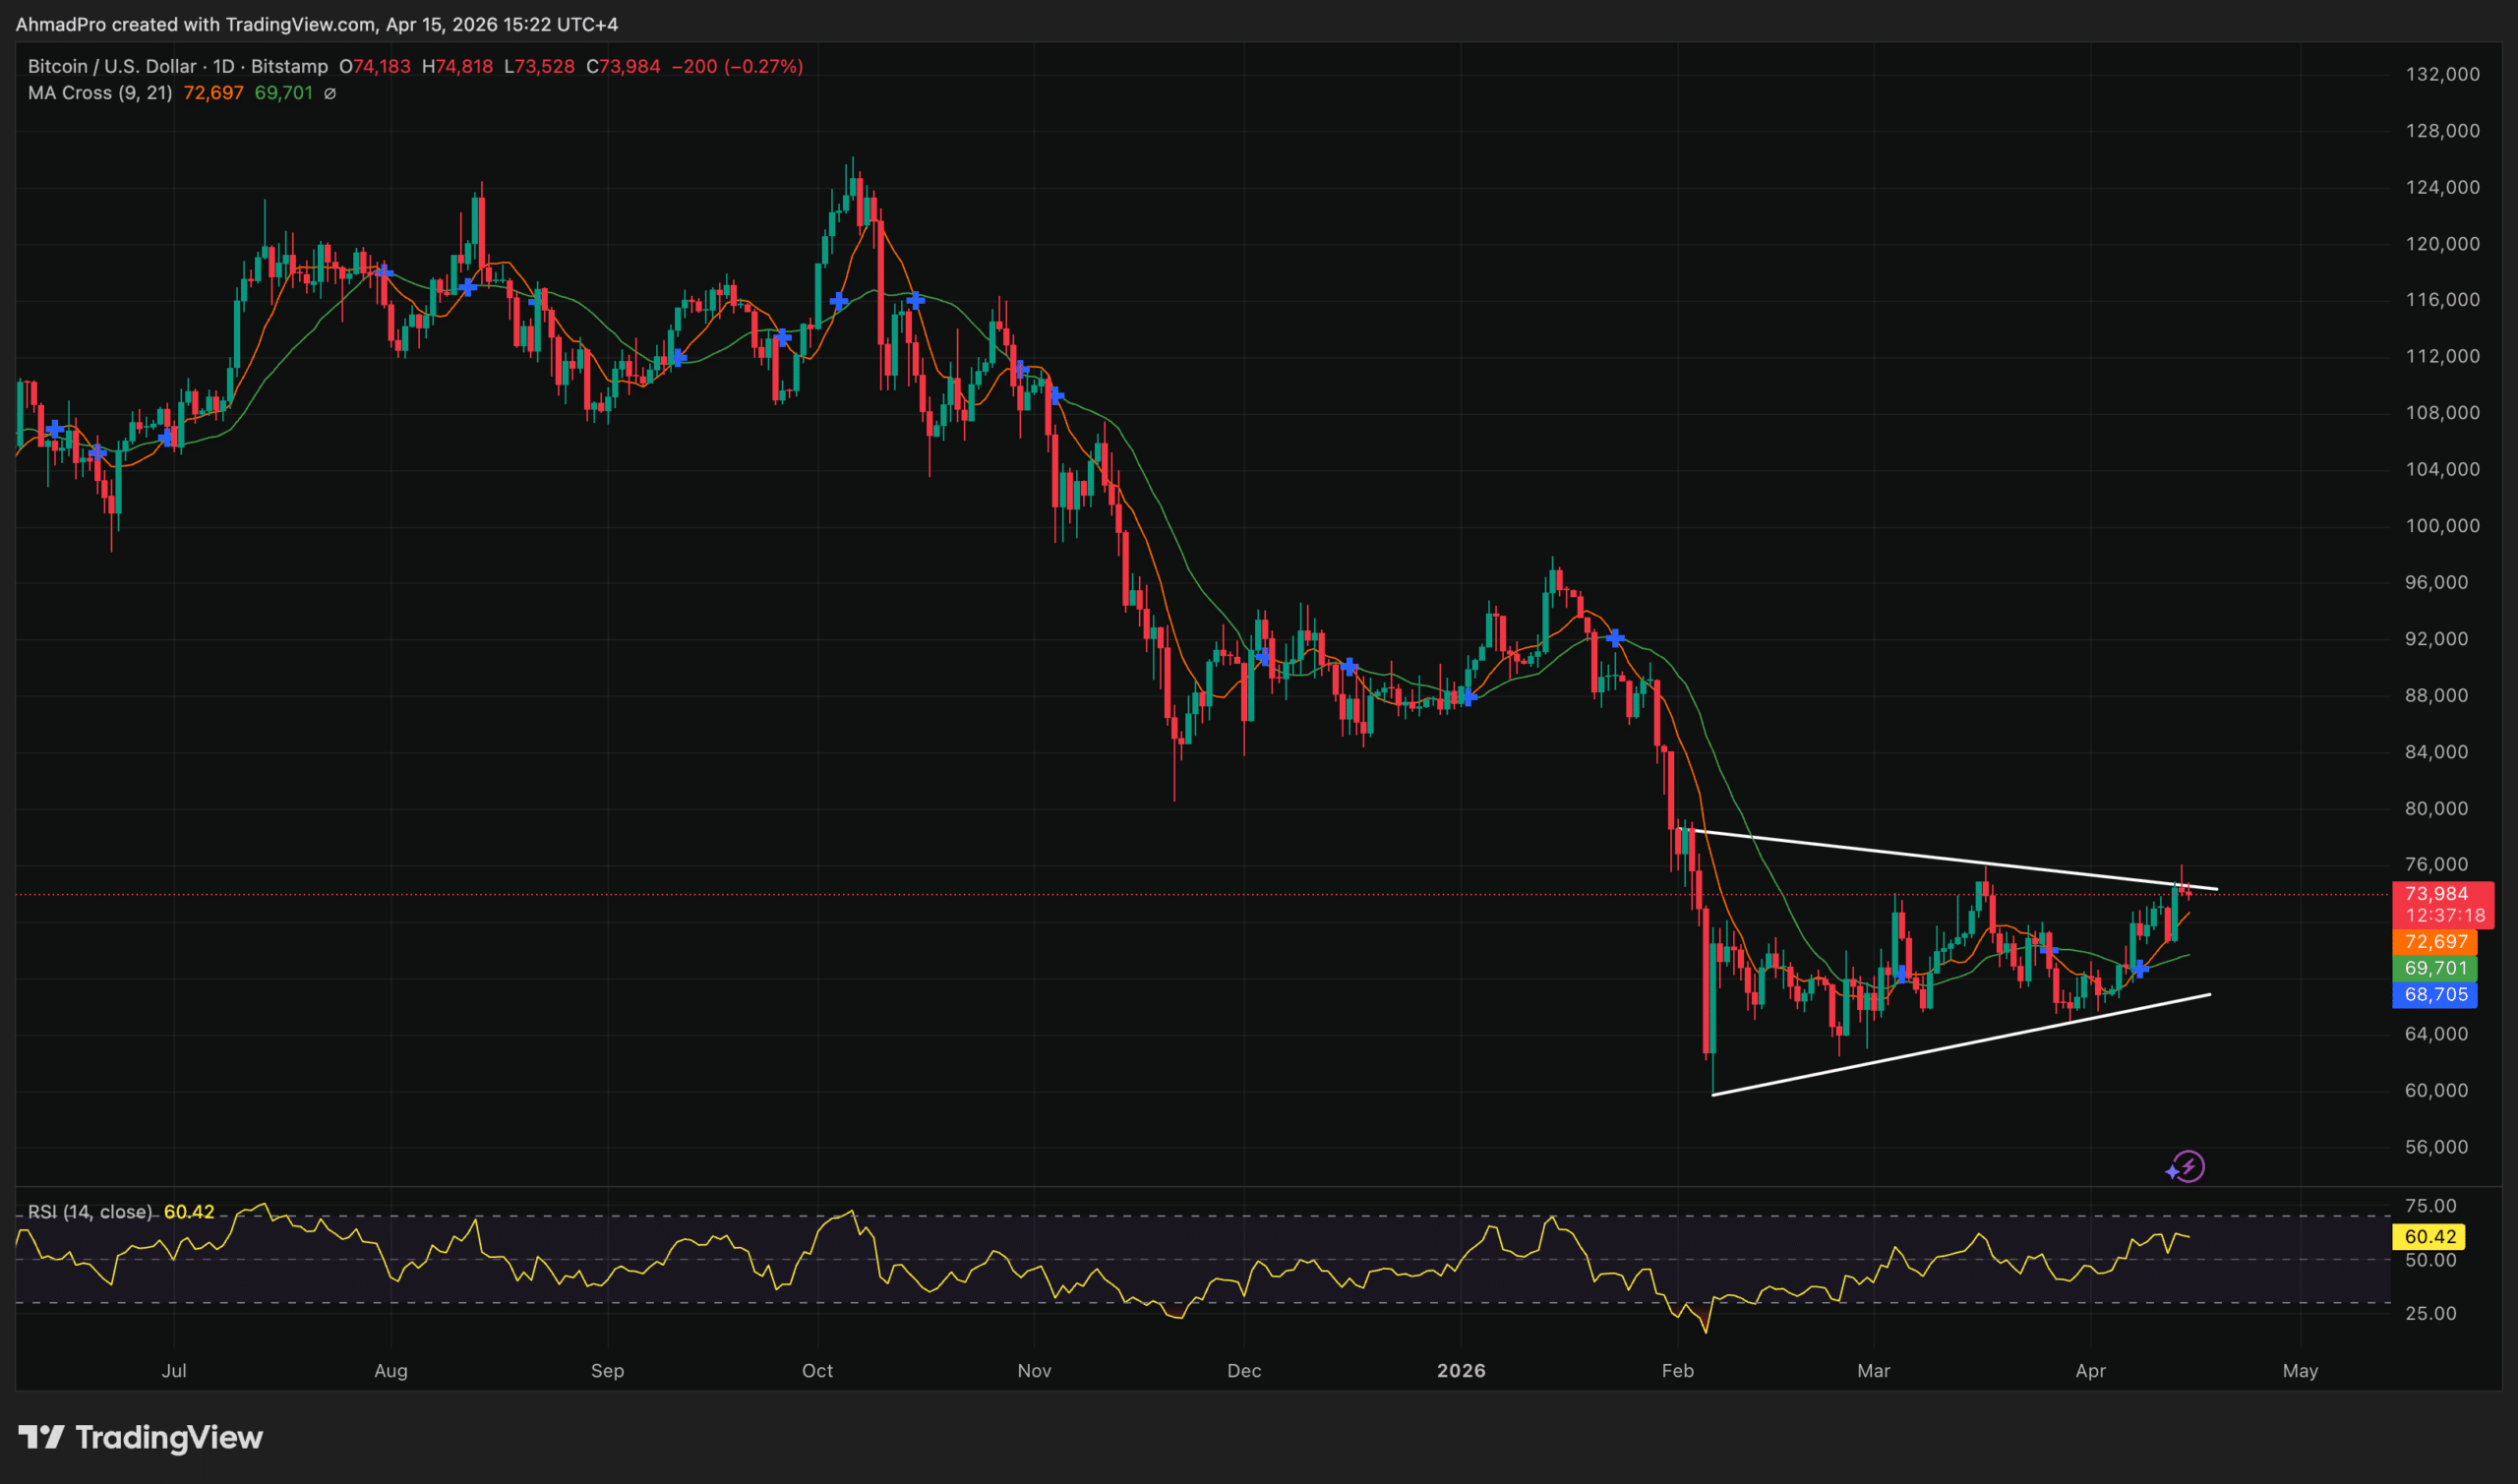
Source: Tradingview
An ascending triangle pattern typically signals a bullish breakout. It suggests increasing buying interest as the price approaches a resistance level, and a decisive move above that level often leads to a price increase roughly equal to the triangle’s widest part.
Based on the current pattern, the predicted target price is around $90,000. This level is significant because it previously acted as a strong resistance point during the late-2025 price increase. If Bitcoin can break through this level and then hold it as support, it would signal a major change in the market’s structure, suggesting a more bullish trend.
As a crypto investor, I’ve been looking at Bitcoin’s chart, and I’ve noticed a pattern. When it dips significantly, then forms an ascending triangle and breaks through a key resistance level that’s been in place for months, it usually signals a strong, lasting price increase – not just a quick bounce back. Basically, it’s a bullish sign suggesting the price is likely to keep going up for a while.
For this upward price movement to be considered a true breakout, Bitcoin needs to consistently close each day above its previous resistance level. So far, it hasn’t managed to do that convincingly. Until we see a clear pattern of daily closing prices staying above $76,000–$80,000, it’s more accurate to describe this as a potential breakout still in progress, rather than a confirmed one.
On-Chain Transmission: Network Activity Supports the Pattern Thesis
Bitcoin’s network is showing strong, ongoing activity. Data from CryptoQuant shows 765,130 transactions occurred on April 5, 2026 – the highest daily number in over a year and a half. This level of activity is even greater than during previous periods when Bitcoin’s price was high, suggesting this isn’t just short-term speculation, but genuine, sustained use of the network.
Source: Cryptoquant
Data from Glassnode confirms that on-chain transaction fees increased by about 4% last week, reaching approximately $153,700. This rise in fees coincides with the price increase, suggesting that the recent recovery isn’t just speculation, but is backed by genuine activity on the network.
Understanding how this information spreads is key to judging if this pattern is reliable. Historically, ascending triangles that emerge when network activity is low tend to quickly fall back down, while those happening with increased transactions and higher fees are usually more stable. Right now, the data suggests there’s support for this pattern, showing people are participating, but it doesn’t necessarily tell us where the price will go next.
Experts are still disagreeing on where Bitcoin’s price is headed, making it hard to predict. Standard Chartered recently lowered its Bitcoin price prediction for the end of 2026 from $200,000 to $100,000, because they believe fewer companies are adding Bitcoin to their reserves and that price increases will depend more on money coming from exchange-traded funds (ETFs). However, they still expect Bitcoin to reach $90,000 as a stepping stone before potentially going higher.
Unlike some other analysts, Bernstein now predicts Bitcoin will reach $150,000 by 2026. They believe this current price increase is different from the usual four-year cycles because institutions are consistently buying Bitcoin. Looking at Standard Chartered’s past predictions shows just how quickly expectations among these large investors have changed.
EXPLORE: Best meme coins to watch – CoinSpeaker’s updated rankings
Read More
- Forza Horizon 6: Find the Ohtani Treasure Chest Location
- LEGO Batman Legacy of the Dark Knight Batcave Minikits & WayneTech Caches
- NTE Drift Guide (& Best Car Mods for Drifting)
- Diablo 4 Best Loot Filter Codes
- USD RUB PREDICTION
- USD CNY PREDICTION
- Cookie Run Kingdom Timeline of Fate Update Guide
- PS Plus Monthly Games for June 2026 Wish List
- Top 10 Must-Watch Isekai Anime on Crunchyroll Revealed!
- GBP CNY PREDICTION
2026-04-15 18:37