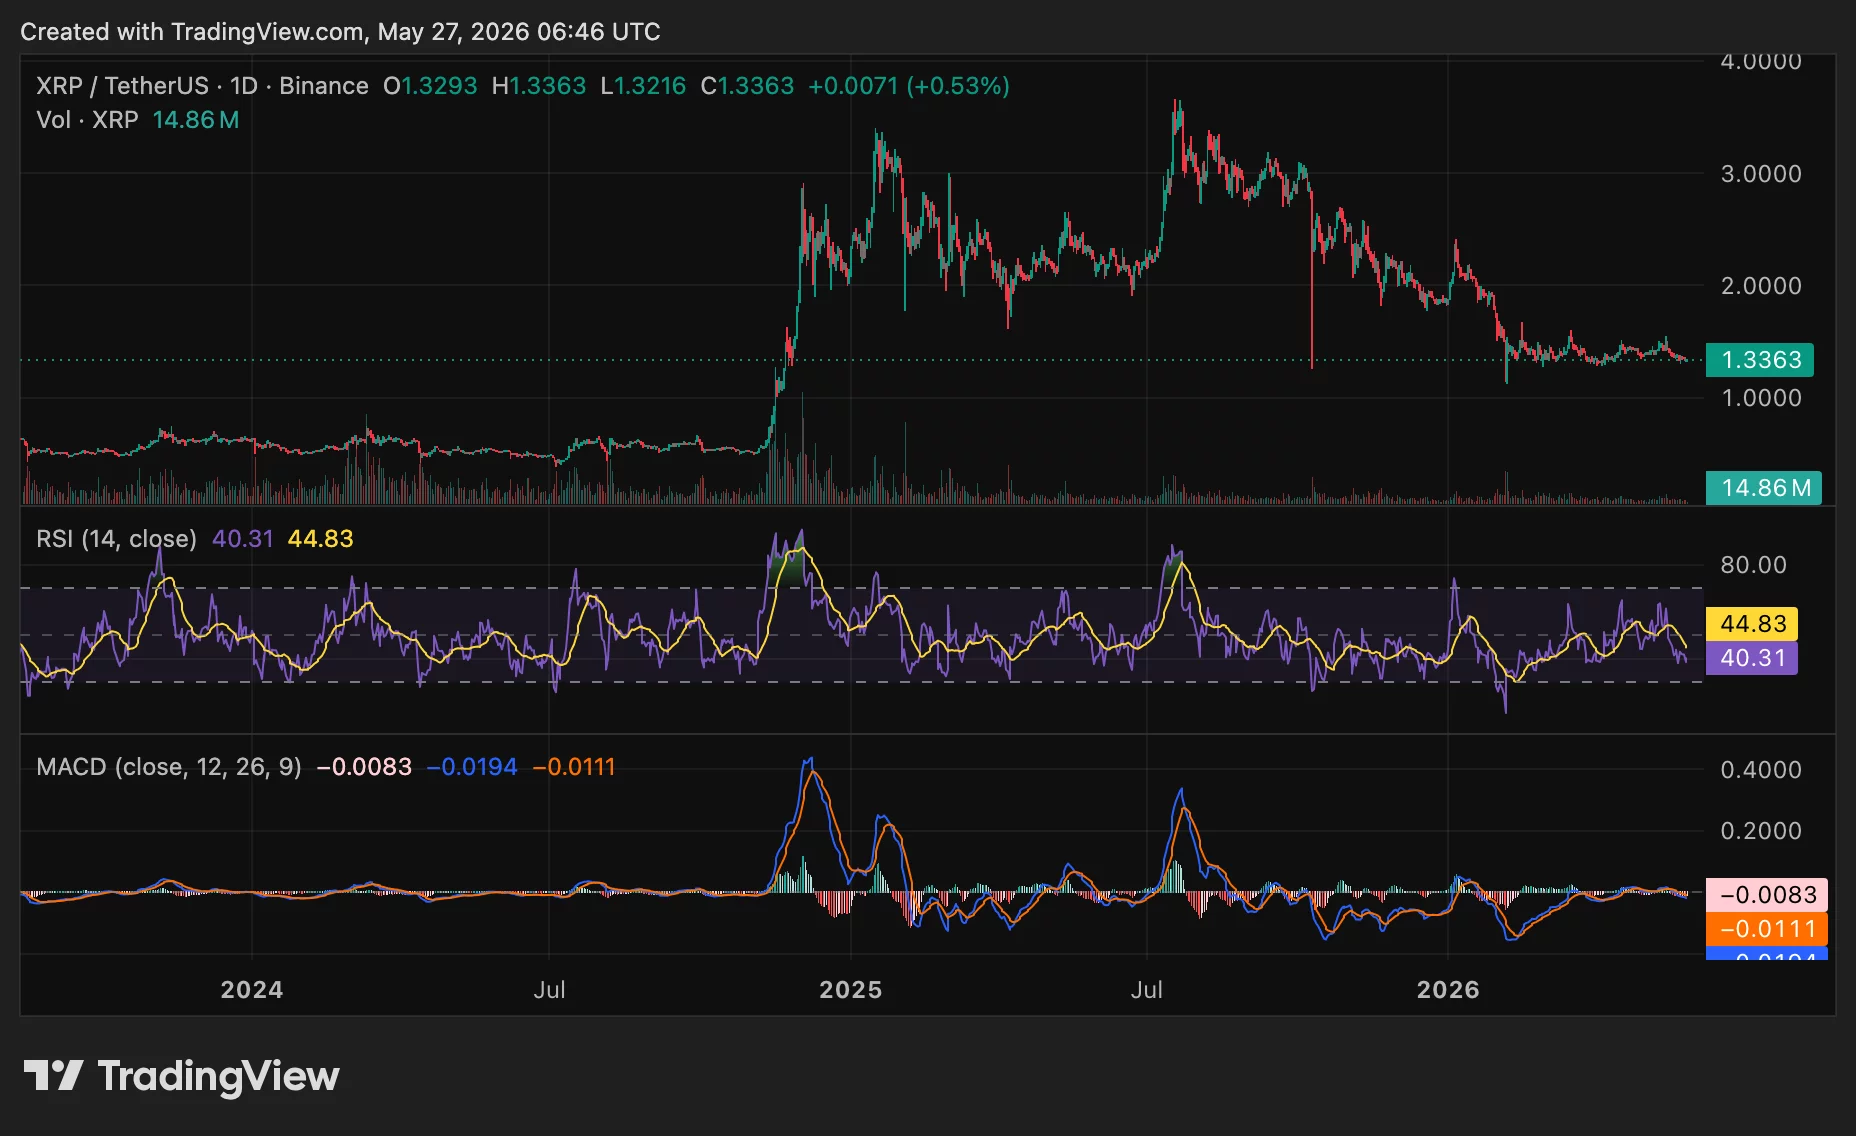
On May 27th, XRP was trading at $1.33, a slight decrease of 1.08% from the previous day. Throughout the day, the price fluctuated between $1.32 and $1.36, with a total of $1.57 billion worth of XRP being traded.
Summary
- XRP price trades near $1.33 as death cross signals keep traders watching downside risk closely.
- Deep MVRV losses show short-term traders are underwater, raising attention on possible rebound conditions now.
- ETF inflows and Binance perp activity suggest speculative demand is rising despite weak technical momentum.
XRP, the cryptocurrency associated with Ripple, is currently the fifth-largest digital token by market value, boasting a market capitalization of $82.39 billion. If all available XRP were in circulation, its total value would reach $133.18 billion.
XRP’s price continued to struggle over extended periods. In the last week, it dropped 2.53%, and over the past month, it fell 6.22%. Looking at longer-term performance, XRP has decreased by 42.04% over the past year, and 42.87% over the last 200 days.
XRP’s technical indicators suggest the price isn’t gaining strong momentum. The Relative Strength Index (RSI) is around 40, which is below its average, indicating a slightly weak but not overly concerning trend. This means buyers haven’t yet firmly taken charge of the market.
Looking at the MACD, I’m seeing it staying under the signal line, and the histogram is just a little bit negative. This suggests some downward pressure, but it doesn’t look like a strong selling trend. To see things improve and indicate stronger momentum, we’d need a decisive move back above that signal line.
Death cross puts $1.70 resistance in focus
According to ChartNerd, XRP has recently shown a bearish technical pattern called a ‘death cross’ – specifically, its 20-day and 50-day Exponential Moving Averages have crossed downwards. While XRP might briefly rise towards the $1.70 range, the analyst believes any gains will likely be limited by broader market resistance.
The analyst also highlighted the weekly chart, noting that XRP experienced a similar ‘death cross’ pattern around January 2026, when it reached a low of $2.40. Following that, the price briefly recovered, rising towards the 20-week exponential moving average around $1.50, but faced resistance and fell back in May.
XRP recently formed a death cross on its weekly chart, similar to what happened in January 2026 around the $2.40 level. After that previous death cross, the price briefly rallied towards the 20-week moving average at $1.50, but it’s now facing resistance in May. This current resistance coincides with another death cross on the 2-week chart, so we’re keeping a close watch on XRP’s price action.
— 🇬🇧 ChartNerd 📊 (@ChartNerdTA) May 26, 2026
XRP is currently facing conflicting signals. While a technical indicator called the ‘death cross’ suggests a potential downtrend, the price hasn’t fallen dramatically yet. This leaves traders watching closely to see if the current support level will hold.
The key concern is still whether the price will fall soon. Even if it temporarily rises, reaching around $1.70, it will likely still face significant overall market challenges. This suggests traders might view any price increase as a temporary check, rather than a lasting turnaround.
MVRV data points to trader capitulation
According to Santiment, the typical XRP trader has lost 47% of their investment over the last month. They also noted that XRP’s 30-day MVRV ratio—a measure of profit/loss for short-term holders—is at its lowest point since December 2020, indicating many traders either sold when the price was very low or are currently facing significant losses.
Recent XRP traders—those active over the last month—have experienced significant losses, averaging around -47%, and many have sold their holdings at the lowest prices. Historically, market-value-to-realized-value (MVRV) figures tend to balance out to 0%, suggesting that XRP is currently trading at a remarkably low price. The following chart illustrates…
— Santiment Intelligence (@SantimentData) May 26, 2026
This data suggests XRP is in a unique position compared to typical chart patterns. Very low MVRV scores usually happen when investors are feeling fearful and discouraged. These situations can often lead to price increases when some good news emerges.
Santiment cautioned that the MVRV metric shouldn’t be relied upon as a foolproof indicator of market reversals. They specifically noted that a low MVRV score doesn’t automatically mean a price change will happen, making it a helpful signal, but not a definitive one.
My research indicates that the data also explains the continued interest in XRP. When a lot of short-term traders are holding losing positions, it can actually reduce the selling pressure. However, for a real price recovery to happen, we need to see stronger buying activity, increased trading volume, and a more consistent upward trend. Right now, those elements are still lacking.
ETF inflows keep institutional demand in view
Interest in XRP exchange-traded funds (ETFs) continues to be a positive sign for the cryptocurrency. Data from SoSoValue shows that XRP spot ETFs saw $1.55 million in net inflows on May 26th, bringing the total inflows to $1.41 billion. Trading volume remained relatively low at $13.38 million.
U.S. spot XRP ETFs saw a surge in investment on May 11th, with $25.8 million flowing in – the highest amount since January 5th. Franklin Templeton, Bitwise, and Grayscale were among the firms that experienced positive investment that day.
Network activity also saw an increase during this time. Data from Santiment indicated 48,453 active addresses – the most since March 30th – and 3,317 new addresses joining the network, a level not seen since March 19th.
Binance perp activity adds short-term heat
According to CryptoQuant analyst Arab Chain, trading activity for XRP futures on Binance is increasing, suggesting more speculation. They noted an imbalance in trading volume around 0.54 and a Z-score near 0.95, both indicating higher-than-usual activity.
In my research, I’ve noticed traders are increasingly focusing on short-term trades and using higher leverage. Interestingly, despite this activity, the price of XRP hasn’t shown a corresponding strong movement. For much of the time I observed, it stayed fairly stable, fluctuating between $1.34 and $1.45.
As a researcher, I’ve been looking at how perpetual futures – or ‘perps’ – impact price action, and the difference between perp activity and spot trading is significant. We’re seeing that increased activity in perps can accelerate price movements, but it also raises the risk of liquidations, especially when many traders are positioned in the same direction. For XRP specifically, we need to see more genuine buying pressure on the spot market to solidify any gains driven by this speculative trading and establish a more sustainable upward trend.
Read More
- Forza Horizon 6: Find the Ohtani Treasure Chest Location
- LEGO Batman Legacy of the Dark Knight Batcave Minikits & WayneTech Caches
- NTE Drift Guide (& Best Car Mods for Drifting)
- Diablo 4 Best Loot Filter Codes
- USD RUB PREDICTION
- USD CNY PREDICTION
- Cookie Run Kingdom Timeline of Fate Update Guide
- PS Plus Monthly Games for June 2026 Wish List
- Top 10 Must-Watch Isekai Anime on Crunchyroll Revealed!
- GBP CNY PREDICTION
2026-05-27 10:31