Stellar XLM holds support at $0.1360-$0.1278 as traders watch $0.1729, $0.2193 and a possible move toward $0.53.
Stellar (XLM) is trading near a long-term support zone, having taken a deep dive from its recent highs-because nothing says “recovery” like a good old-fashioned plunge.
The area between $0.1360 and $0.1278 is a key area to watch. Traders are now watching whether XLM can hold this range and build toward a possible move to $0.53. A noble ambition, if not slightly optimistic.
Long-Term Support Zone Keeps XLM in Focus
XLM has returned to a price area that traders have tracked for months. A veritable treasure map for the financially masochistic.
The zone between $0.1360 and $0.1278 acted as support before, and it has already been tested. As if the market hadn’t already proven itself adept at repeating mistakes.
As a result, this range is now a key part of the current Stellar price outlook. One market analyst, CG TRADES, said XLM is trading on its “long term support” area. How thrilling.
The same note placed invalidation at a monthly close below $0.1278. For now, that keeps the support range active on the higher timeframe. A precarious balancing act, akin to walking a tightrope while blindfolded.
is trading on its long term support 0.1360$ – 0.1278$ area… (already tapped with feb low)
as long as this support holds on monthly Tf… expecting it to reach 0.537$ minimum from here….
invalidation – monthly close below 0.1278$…
– CG TRADES (@CG_trades_)
This setup matters because long-term support often shapes the next major move. When price holds, buyers may try to rebuild momentum. However, a clean monthly break below support would weaken the recovery case. A classic “if you can’t beat them, join them” scenario.
The daily chart still shows a weak structure, even as price sits near support. XLM is trading near $0.168, which is below the prior swing low near $0.1729. That means the market has not yet confirmed a trend change. How original.
XLM is trading near $0.168, which is below the prior swing low near $0.1729. That means the market has not yet confirmed a trend change. For that reason, traders are watching several recovery levels above the current price. A game of “will it, won’t it?”
The first level is $0.1729, followed by $0.2193 and $0.2557. A move above that range would improve the daily chart and support the bullish case. Or it would just be another false dawn.

Until then, price action may still reflect a relief bounce inside a broader correction. A temporary reprieve, much like a sunset-beautiful, but ultimately fleeting.
The larger downtrend followed the sharp rally into the $0.39 to $0.55 region. Since then, XLM has printed lower highs and lower lows on the daily timeframe. A downward spiral with a side of drama.
Momentum data also remains mixed at this stage. The RSI has improved from weaker levels, yet it still does not confirm strong upside control. A tenuous situation, much like a relationship built on lies.
So, the market still needs stronger closes above resistance to support a move toward $0.53. A tall order, but then again, nothing worth having comes easily.
Read Also:
Stellar Builds Privacy Layer Enabling Banks To Move Trillions Securely On Chain
Short Squeeze Adds Near-Term Support to XLM Price Action
At the same time, derivatives data shows that many traders had leaned short. On Binance, the long short ratio by accounts stood at 0.7753. A testament to the market’s collective pessimism.
Top trader data also showed a cautious or bearish tilt. The top trader long short accounts ratio was 0.9294, while positions were at 0.7416. A bleak outlook, but then again, why be optimistic when you can be profitable?
In contrast, OKX showed a more balanced reading near 1.05. A rare moment of sanity in a sea of chaos.
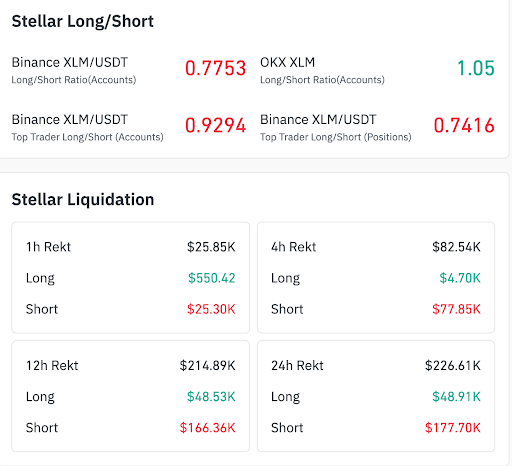
Liquidation data then showed a sharp move against those shorts. Over one hour, short liquidations reached $25.30K, while long liquidations were just $550. A short squeeze, perhaps? Or just a very expensive game of chicken.
Over 24 hours, shorts lost $177.70K, while longs lost $48.91K. Those figures point to a short squeeze in the near term. A temporary reprieve for bulls, but don’t get too excited.
That type of move can lift prices quickly, especially when the market is positioned the wrong way. Even so, XLM still needs follow-through buying and stronger closes above resistance. A classic “wait and see” scenario.
Stellar remains at a key point on both the monthly and daily charts. Support near $0.1360 to $0.1278 is still holding, and short covering has added near-term strength. A fragile hope, but a hope nonetheless.
The next phase now depends on whether XLM can reclaim higher levels and keep the path toward $0.53 open. A gamble, but then again, what’s life without a little risk?
Read More
- Forza Horizon 6: Find the Ohtani Treasure Chest Location
- LEGO Batman Legacy of the Dark Knight Batcave Minikits & WayneTech Caches
- NTE Drift Guide (& Best Car Mods for Drifting)
- Diablo 4 Best Loot Filter Codes
- Cookie Run Kingdom Timeline of Fate Update Guide
- USD CNY PREDICTION
- PS Plus Monthly Games for June 2026 Wish List
- USD RUB PREDICTION
- GBP CNY PREDICTION
- CNY RUB PREDICTION
2026-04-17 01:57